Hungarian Association of Agricultural Informatics European Federation for Information Technology in Agriculture, Food and the Environment
Journal of Agricultural Informatics. Vol. 11, No. 1 journal.magisz.org
Variability in Rainfall Prediction Quality Over Time
Jayalath Bandara Ekanayake1, Thanuja Dananjali 2
I N F O
Received 08-06-2020 Accepted 15-07-2020 Available on-line 17-07-2020 Responsible Editor: R. Szilágyi
Keywords:
MLP, M5P, Linear Regression, Rainfall prediction, prediction quality variability.
A B S T R A C T
Many rainfall prediction models have been proposed. The common methodology followed by those models is that the model is trained using the data prior to the target and tested the model in one or few time points and claimed that the model is generalized. However, this project shows that the above procedure is not sufficient to generalize rainfall prediction models as in some target periods the models fail to achieve a decent prediction quality. The models--Multilayer Perceptron (MLP), M5P and Linear Regression--were trained and tested in all possible combinations of targets and training periods from the weather data collected between the year 2002 and 2015 from the station located at Badulla, Sri Lanka. The prediction quality of the models was measured using Mean Absolute Error (MAE) and visualize them in heat-maps to show that the prediction quality varies over the targets and length of the training periods. This indicates that testing models in one or a few time points is not sufficient to generalize the models. Further, the reasons for such drastic changes in prediction quality will be investigated in our future projects.
1. Introduction
Predicting climatic changes are important as they directly affect on agriculture, tourism, natural disasters etc. Among the climatic factors rainfall plays a significant role as it has a significant impact on the agriculture, which contributes to the economy of most of the middle-income countries. Therefore accuracy in rainfall prediction is important though it is a scientifically and technologically challenging task (RanjanNayak et al., 2013)
There are many existing rainfall prediction models, which employed different models and methodologies such as numerical, statistical, and machine learning models (Abbot & Marohasy, 2012; Adamowski & Sun, 2010; Aksoy & Dahamsheh, 2009; Bodri & Čermák, 2000; Bushara & Abraham, 2015; Chattopadhyay & Chattopadhyay, 2008; Choubin et al., 2016; & Mekanki,2015; Gholizadeh, MH & Darand, M, 2009; Deo et al., 2017; Kang et al., 2020; Lee et al., 2018; Mislan et al., 2015; Mulualem & Liou, 2020; Onyari & Ilunga, 2013; Poornima & Pushpalatha, 2019; Prasetya & Djamal, 2019; RanjanNayak et al., 2013; Sumi et al., 2012; Vos & Rientjes, 2005). Statistical and Artificial Neural Network (ANN) models are the commonly used empirical models. However, the literature shows that the ANN models perform better than the traditional statistical models(Adamowski & Sun, 2010). The common methodology used by those models is that the models are trained using data prior to the target and tested the model using data in the target period. The models are tested in one or few target points and claimed that the models are generalized. The downside of this method is that the models are temporarily generalized and in some points in time the prediction quality of the models is not up to the standard. The objective of this research project is to show that the prediction quality of the models varies over time and testing the models in one time point or in few time points are not sufficient to generalize the models.
1 Jayalath Bandara Ekanayake
Uva Wellassa University [email protected]
2 Thanuja Dananjali
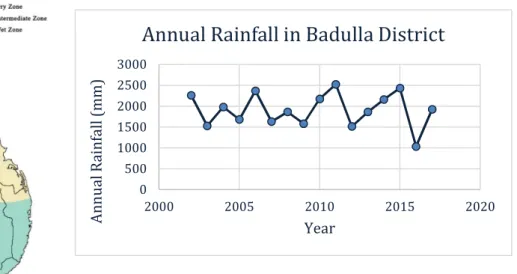
To that end we use rainfall data at Budulla, Sri Lanka from the year 2002 to 2015. The altitude of Badulla district is 670m and it is classified as an intermediate zone as shown in Fig. 1. As in Fig. 2 the annual rainfall of this area significantly changes during the above time frame. More importantly the significant changes in rainfall within a year is also observed. Therefore, predicting the rainfall in a given time point is a challenging task in Badulla district. In this project we train MLP, M5P model tree, and linear regression models.
Figure 1. Climatic Zones in Sri Lanka
2. Related Works
Bodri (2000) trained backpropagation Artificial Neural Network (ANN) models using 38 years of data collected from two Czech meteorological stations. The model predicts rainfall of the next month and summer precipitation in the next year.
An adaptive basis function neural network, which is a variation of backpropagation algorithm was proposed to predict rainfall in Kerala state, India (Ninan et al., 2003). They used past 87 years of data to train the model and it was tested using a test dataset.
Chattopadhyay (2008) in their research proposed three backpropagation neural network learning rules namely, momentum learning, conjugate gradient descent (CGD) learning, and Levenberg–Marquardt (LM) learning, and a statistical model in the form of asymptotic regression. The models were trained on data collected from the year 1871 to 1999. The ANN with the conjugate gradient descent-learning algorithm provides best prediction quality in predicting monsoon rainfall in India.
Multiple perceptron neural networks with the backpropagation learning algorithm were trained using monthly rainfall data from Tehran station collected over past 53 years to predict next-month rainfall of next year (Gholizadeh & Darand 2009). They showed that the ANN models combined with genetic algorithms further enhanced the prediction quality.
The next-month precipitation of meteorological stations -Baqura, Amman and Safawi- in Jordan is forecasted using artificial neural network (ANN) models (Aksoy & Dahamsheh, 2009). The feed forward backpropagation (FFBP), radial basis function (RBF), generalized regression type ANNs and a simple multiple linear regression (MLR) model are compared, and revealed that the FFBP outperforms all the other models.
0 500 1000 1500 2000 2500 3000
2000 2005 2010 2015 2020
A
nn
ua
l R
ai
nf
al
l (
m
m
)
Year
Annual Rainfall in Badulla District
Adamowski (2010) proposed Levenberg Marquardt artificial neural network models alone with discrete wavelet transforms (WA) to forecast flow in non-perennial rivers in semi-arid watersheds. The models applied in data collected from two different rivers in Cyprus. In both cases, the coupled wavelet-neural network models were found to provide more accurate flow forecasts than the artificial neural network models.
Abbot (2012) proposed a rainfall prediction model using ANN, which is stand-alone, dynamic, recurrent and time-delay, for monthly and seasonal rainfall forecasting in Queensland, Australia. The performance of the model was compared with the forecasts generated by the Australian Bureau of Meteorology’s Predictive Ocean Atmosphere Model for Australia (POAMA)-1.5 general circulation model (GCM) and revealed that the model achieved a lower RMSE for 16 of the 17 sites compared.
Sumi (2012) developed a novel hybrid multi-model method to predict rainfall in Fukuoka city, Japan. They compared this model with multivariate adaptive regression splines, the k-nearest neighbor, and radial basis support vector regression, and concluded that the hybrid model best fits with predicting daily and monthly rainfall in Fukuoka city.
Nayak (2013) conducted a survey on rainfall prediction models developed using different artificial neural network architectures over the past twenty-five years. The survey revealed that the forecasting techniques--MLP, BPN, RBFN, SOM and SVM--are suitable to predict rainfall than other forecasting techniques such as statistical and numerical methods.
A rainfall runoff models were developed using a multilayer perceptron neural network (MLPNN) with backpropagation algorithm and M5P-Model tree to predict the discharge at Luvuvhu River, Mhinga gauging station (Onyari & Ilunga, 2013). The M5P outperformed the MLPNN in predicting flow with a RMSE of 2.666, and a correlation coefficient of the observed and the predicted flow of 0.89.
Bushara (2015) constructed a novel ensemble method using a Meta classifier vote combining with three base classifiers IBK, K-star and M5P to predict monthly rainfall in Central Bureau Sudan. The dataset contained date, minimum temperature relative humidity, wind direction and rainfall as the predictors. The Meta classifier outperforms all the basic classifiers and the Meta classifier.
Mekanki (2015) presented two models- linear Multiple Regression (MR) analysis and non-linear Artificial Neural Networks (ANN) MLP with backpropagation- to forecast long-term seasonal rainfall in South Australia using the potential climate predictors and revealed that the ANN outperforms the MR in predicting rainfall in South Australia.
Mislan (2015) applied an Artificial Neural Network (ANN) with the backpropagation Neural Network (BPNN) algorithm to predict rainfall in Tenggarong, East Kalimantan - Indonesia. They found that the BPNN with two-hidden layers and the architecture [2-50-20- 1, epoch 1000] produced the minimum Mean Square Error (MSE) value of 0.00096341.
Bahram (2016) proposed multilayer perceptron with the Levenberg-Marquardt (LM), adaptive neuro-fuzzy inference system (ANFIS) and the M5P models to predict the drought index based on large-scale climate indices. Contrary to Onyari (2013), Bahram et.al. claimed that the multilayer perceptron outperformed the other two models.
Deo (2017), in his study advances drought modelling using multivariate adaptive regression splines (MARS), least square support vector machine (LSSVM), and M5Tree models to forecast Standardized Precipitation Index (SPI), which is a rainfall-based metric and well-suited to forecast drought at different periods in climatically diverse regions. The results revealed that the performances of the models depend on combination of predictors and the regions.
Poornima (2019) presented Long Short-Term Memory (Intensified LSTM) based Recurrent Neural Network (RNN) to predict rainfall using a standard dataset of rainfall. The trained network will produce predicted attribute of rainfall. The results show that the LSTM outperformed Holt–Winters, Extreme Learning Machine (ELM), and Autoregressive Integrated Moving Average (ARIMA), Recurrent Neural Network and Long Short-Term Memory models.
Prasetya (2019) proposed Recurrent Neural Networks with LSTM to predict weekly rainfall using attributes; rainfall, temperature, and humidity in a year. The learning algorithm--Stochastic Gradient Descent (SGD) and Adaptive Moment Estimation (Adam)—is trained using 10 years of data. The models trained on several datasets and the results show that the LSTM provides a decent accuracy on predicting weekly rainfall.
Mulualem (2020) used hydro-meteorological, climate, sea surface temperatures, and topographic attributes to train multilayer perceptron (MLP) feed-forward artificial neural network (ANN) models with the backpropagation algorithm to forecast the standardized precipitation evapotranspiration index (SPEI) for seven stations in the Upper Blue Nile basin (UBN) of Ethiopia. They used data from 1986 to 2009 to train the models and from 2010 to 2015 to test the models.
Kang (2020) developed a recurrent neural network model named Long Short-Term Memory (LSTM) to predict the rainfall based on meteorological data from 2008 to 2018 in Jingdezhen City. The input variables were selected based on the relative importance. The experimental results show that the LSTM outperformed classical statistical algorithms and the machine learning algorithms.
All the above models follow a common procedure to train and test the models. First, models were trained using the data collected from a chosen period of time and tested them using a dataset collected from a different time period, which is ahead of training period. For example, if the prediction period of models is t, then the training period is t-1, t-2, t-3, etc. The models were tested only one or few time points. Further, those models were trained using data collected from a long history. Such evaluation and training implicitly assumes that the evolution of rain patterns and its underlying data distribution are relatively stable over time. Is this assumption always true? As in the testing period, does the prediction quality remain constant in other prediction periods? These issues need more investigations, as they have not been investigated in the literature and the next section provides detail approaches to address them.
3. Experimental Design
3.1. Dataset
The dataset consists rainfall data in Badulla District collected from the Department of Meteorology, Sri Lanka. Attributes of the dataset--rainfall in millimetres, minimum and maximum temperature, minimum and maximum relative humidity--are recorded in 4865 instances in daily basis from January 2002 to December 2015. The dataset was pre-processed as it contained some missing values, which are replaced with the mean values. The instances are ordered based on the recorded date and categorized into weeks so that every seven instances were assigned a unique week ID starting from December 2015--the latest recording date--resulting 695 week-IDs. MySQL workbench was used to store and query the dataset.
3.2. Development tools
Eclipse 2019/12 integrated development environment (IDE) used as a development platform. The models were implemented using Java integrated with WEKA (weka-dev-3.9.3.) libraries (Hall et al., 2009). The Java Database Connections (JDBC) driver was used to connect the database.
3.3. Training and testing models
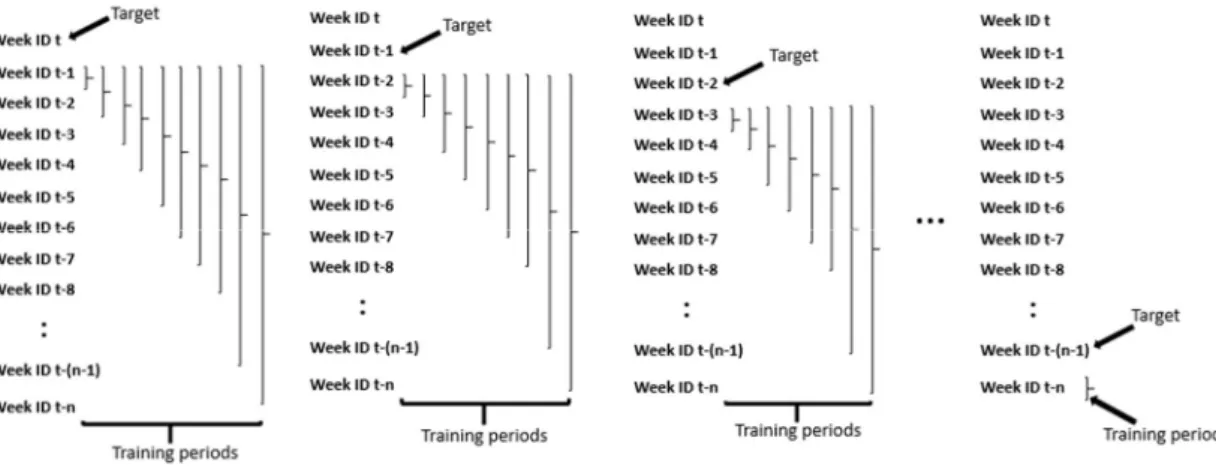
The models are trained and tested as follows. First, the target was set as the first week of the dataset i.e week-ID =1 and the training period of the models was one week before the target i.e. week-ID=2. Then, keeping the target fixed the training period was expanded into two weeks backward from the target. This process is repeated until the last week of the dataset. Next, move the target one week backward (i.e. week-ID=2) and repeat the same procedure as above. For example, if the initial target period is on the week t and the initial training period is [t - 1], and then expanded it into [t – 1, t - 2], and so on. Next we move the target period to [t - 1] and the initial training to [t - 2], then [t - 2, t - 3] and repeat the same procedure with other targets. This procedure is depicted in Fig. 3.
Figure 3. Training and testing process of models
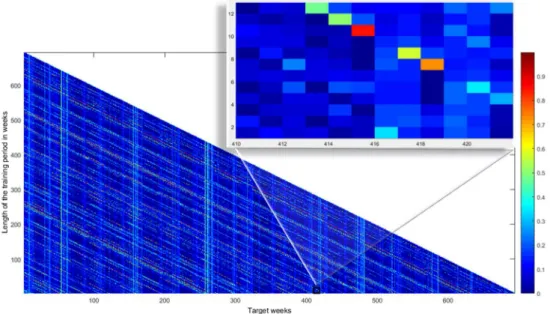
The MAE values greater than 100 were removed, as they are highly erroneous. The other MAE values are normalized and visualized them in heat maps as in Fig. 4-6. The X-axis of the heat map shows the target period and the Y-axis shows the length of the training period. The heat maps are generated using MATLAB. Moreover, the MAE values are categorized into 10 intervals and represented in histograms as shown in Fig. 7 (a)-(c). The X-axis of the histograms shows the MAE and the Y-axis shows the number of occurrences.
Finally, the accuracy of the MLP with backpropgation learning algorithm is measured by changing the configurations of MLP so that the number of hidden layers and number of neurones in each layer is varied from 1 to 3 and 1 to 6 respectively. The randomness of the different configurations of MLP is determined using run chart followed by the normality test, which identifies the optimum configuration of the MLP. Table-1 shows only the stable configurations of MLP.
4. Results and Discussion
The MLP, M5P pruned, and linear regression models are trained and tested in each and every target periods and training periods, and the results are visualized in the Fig. 4-6 respectively. According to the observations in Fig. 4 generated from MLP, the models involved in predicting rainfall on certain target periods (e.g., week ID 414) obtain MAE around 0.1 while the models that predict rainfall in week ID 416 obtain MAE around 0.4. In some prediction periods (e.g., week ID 415) initially the prediction quality is around 0.1 MAE but when expanding the learning period up to 10 weeks back, the model drops the prediction quality (MAE 0.8) and further expansion of the training period again captures the performances. Moreover, the minimum MAE values for each target period typically lie on neither ends. This indicates that the models are not needed to train on data collected from very long or very short history to obtain the maximum accuracy. The similar observations can be found in other two models as well.
55% MAE between 0 and 9. This further confirms that the MLP outperforms the other two models in predicting rainfall (Adamowski & Sun, 2010).
Figure 4. MAE values of MLP models
The MLP model has several parameters such as number of hidden layers, number of neurons in the hidden layers, learning algorithm etc. It is interesting to observe the performances of the model while changing these parameters. Hence, the performance of the models was measured by changing the number of hidden layers and the neurones while keeping the learning algorithm--backpropagation-- fixed. Table 1 shows the run chart and the normality test of the stable configurations of the models. The backpropagation MLP with two hidden layers--layer 1 consists 4 neurones and layer 2 consists 3 neurones--provides the minimum standard deviation and hence, can be considered as the optimal model compared to the other two models. The M5P is a model tree, which derives linear regression models at the leaves of the tree. In predicting the rainfall the M5P models derive one to three linear regression models, which generally use all the predictor variables. Similarly, the linear regression models pick all predictor variables for the rainfall prediction, which indicates that the given predictor variables are equally important in predicting rainfall.
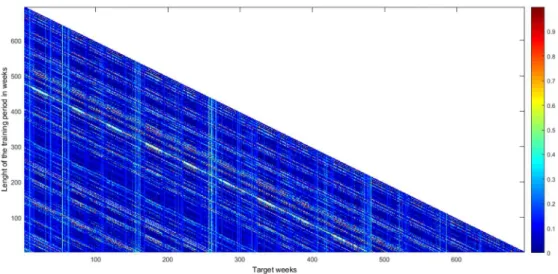
Figure 6. MAE values of Linear Regression models
(a): MLP (b): M5P
(c): Linear Regression
Figure 7. Number of models in each MEA interval
zero or very few non-zero values, but they are close to zero. It implies that the models somewhat unable to capture the environmental parameters of sunny days, resulting degradation in prediction quality.
Table 1. Run Chart and Normality Test
# of hidden layers
Run Chart Approximate P-values
Normality Test
I II Clustering Trend Mixtures Oscillation P-value STD
2 - 0.000 0.83 1.00 0.17 <0.005 12.17
4 2 0.000 0.918 1.00 0.082 <0.005 1.492
4 3 0.000 0.918 1.00 0.082 <0.005 1.341
6 4 0.000 0.545 1.00 0.455 <0.005 1.718
5. Conclusion
The aim of this project is to show that the prediction quality of the rainfall prediction models varies over time. To that end MLP, M5P, and Linear regression models were trained and tested in every possible combination of training periods and target periods starting from the year 2002 to 2015. The performances of the models were evaluated using MAE as all the three models predicting continuous values. The MAEs of the models are visualized in heat maps.
The heat maps indicate that all the three models show inconsistency in prediction quality. It is observed that in some instances predicting the same target using different length of training periods shows variability in prediction quality. Further, it observed that the prediction quality of some target periods is superior to some other target periods, indicates that the variability in prediction quality can be observed among different target periods. Also, it revealed that in order to obtain a good prediction quality or at least a decent performance, the models should be trained using neither a very long nor a short history data.
The MLP with backpropagation learning algorithm and with two hidden layers each consisting 4 and 3 neurones is well fit with rainfall prediction as it obtain minimum MAE compared to the other two models. The M5P generates maximum three linear regression models for rainfall prediction. These models pick more or less all the parameters for rainfall prediction. Also, the linear regression models pick similar parameters for the prediction. Similar to the M5P and Linear regression models, the error rate of MLP is increased when the desired rainfall is zero or close to zero. In other words the models do not very well capture the underlying environmental parameters of sunny days.
To our knowledge there is no decision procedure or a tool that support users to decide when and when not it is beneficial for them to apply rainfall prediction models. This is very crucial information for the users since it revealed that rainfall prediction quality varies over time such that there exists a period of stability and change. This question will be addressed in our future studies together with exploration of other prediction models such as Recurrent Neural Network (RNN) as such models may fit with time series data.
Acknowledgement
The work/publication is supported by Research grant 2016, Sabaragamuwa University of Sri Lanka
References
Abbot, J., & Marohasy, J. (2012). Application of artificial neural networks to rainfall forecasting in Queensland,
Australia. Advances in Atmospheric Sciences, 29(4), 717–730. https://doi.org/10.1007/s00376-012-1259-9
Adamowski, J., & Sun, K. (2010). Development of a coupled wavelet transform and neural network method for
flow forecasting of non-perennial rivers in semi-arid watersheds. Journal of Hydrology, 390(1–2), 85–91.
Aksoy, H., & Dahamsheh, A. (2009). Artificial neural network models for forecasting monthly precipitation in
Jordan. Stochastic Environmental Research and Risk Assessment, 23(7), 917–931.
https://doi.org/10.1007/s00477-008-0267-x
Bahram, C, Arash M, & Mohammad G 2016 ‘Application of several data-driven techniques to predict a
standardized precipitation index’ Atmósfera, vol. 29, Issue 2, pp. 121-128. doi:10.20937/ATM.2016.29.02.02.
Bodri, L., & Čermák, V. (2000). Prediction of extreme precipitation using a neural network: Application to
summer flood occurrence in Moravia. Advances in Engineering Software, 31(5), 311–321.
https://doi.org/10.1016/S0965-9978(99)00063-0
Bushara, N. O., & Abraham, A. (2015). Novel Ensemble Method for Long Term Rainfall Prediction. 15.
Chattopadhyay, S., & Chattopadhyay, G. (2008). Comparative study among different neural net learning algorithms applied to rainfall time series. Meteorological Applications, 15(2), 273–280.
https://doi.org/10.1002/met.71
Choubin, B., Malekian, A., & Gloshan, M. (2016). Application of several data-driven techniques to predict a
standardized precipitation index. Atmósfera, 29(2), 121. https://doi.org/10.20937/ATM.2016.29.02.02
Rasel, HM, Imteaz, MA, Hossain, I, & Mekanki, F (2015, November 29) 'Comparative study between linear and
non-linear modelling techniques in rainfall forecasting for South Australia. Weber, T., McPhee, M.J. and
Anderssen, R.S. (Eds) MODSIM2015, 21st International Congress on Modelling and Simulation. https://doi.org/10.36334/MODSIM.2015.L1.rasel2
Deo, R. C., Kisi, O., & Singh, V. P. (2017). Drought forecasting in eastern Australia using multivariate adaptive
regression spline, least square support vector machine and M5Tree model. Atmospheric Research, 184, 149–175.
https://doi.org/10.1016/j.atmosres.2016.10.004
Gholizadeh, MH & Darand, M 2009 'Forecasting Precipitation with Artificial Neural Networks (Case Study:
Tehran)'. (n.d.). https://doi.org/10.3923/jas.2009.1786.1790
Hall, M., Frank, E., Holmes, G., Pfahringer, B., Reutemann, P., & Witten, I. H. (2009). The WEKA data mining
software: An update. ACM SIGKDD Explorations Newsletter, 11(1), 10–18.
https://doi.org/10.1145/1656274.1656278
Kang, J., Wang, H., Yuan, F., Wang, Z., Huang, J., & Qiu, T. (2020). Prediction of Precipitation Based on
Recurrent Neural Networks in Jingdezhen, Jiangxi Province, China. Atmosphere, 11(3), 246.
https://doi.org/10.3390/atmos11030246
Lee, J., Kim, C.-G., Lee, J. E., Kim, N. W., & Kim, H. (2018). Application of Artificial Neural Networks to
Rainfall Forecasting in the Geum River Basin, Korea. Water, 10(10), 1448. https://doi.org/10.3390/w10101448
Mislan, Haviluddin, Hardwinarto, S., Sumaryono, & Aipassa, M. (2015). Rainfall Monthly Prediction Based on
Artificial Neural Network: A Case Study in Tenggarong Station, East Kalimantan - Indonesia. Procedia
Computer Science, 59, 142–151. https://doi.org/10.1016/j.procs.2015.07.528
Mulualem, G. M., & Liou, Y.-A. (2020). Application of Artificial Neural Networks in Forecasting a
Standardized Precipitation Evapotranspiration Index for the Upper Blue Nile Basin. Water, 12(3), 643.
https://doi.org/10.3390/w12030643
Ninan, I. R., Philip, N. S., & Joseph, K. B. (2003). A Neural Network Tool for Analyzing Trends (Vol. 29). Onyari, E. K., & Ilunga, F. M. (2013). Application of MLP Neural Network and M5P Model Tree in Predicting
Streamflow: A Case Study of Luvuvhu Catchment, South Africa. International Journal of Innovation, 4(1), 11–
15. https://doi.org/10.7763/IJIMT.2013.V4.347
Poornima, S., & Pushpalatha, M. (2019). Prediction of Rainfall Using Intensified LSTM Based Recurrent Neural
Network with Weighted Linear Units. Atmosphere, 10(11), 668. https://doi.org/10.3390/atmos10110668
Prasetya, E. P., & Djamal, E. C. (2019). Rainfall Forecasting for the Natural Disasters Preparation Using
Recurrent Neural Networks. 2019 International Conference on Electrical Engineering and Informatics (ICEEI),
52–57. https://doi.org/10.1109/ICEEI47359.2019.8988838
RanjanNayak, D., Mahapatra, A., & Mishra, P. (2013). A Survey on Rainfall Prediction using Artificial Neural
Rumelhart, D. E., Hinton, G. E., & Williams, R. J. (1986). Learning representations by back-propagating errors.
Nature, 323, 533–536. https://doi.org/10.1038/323533a0
Sumi, S. M., Zaman, M. F., & Hirose, H. (2012). A rainfall forecasting method using machine learning models
and its application to the Fukuoka city case. International Journal of Applied Mathematics and Computer
Science, 22(4), 841–854. https://doi.org/10.2478/v10006-012-0062-1
Vos, N. J. de, & Rientjes, T. H. M. (2005). Constraints of artificial neural networks for rainfall-runoff modelling:
Trade-offs in hydrological state representation and model evaluation. Hydrology and earth system sciences, 9(1–