When Smart Groups Fail
Brigid Barron
Stanford University School of Education
In this study I investigated how collaborative interactions influence problem-solving outcomes. Conversations of twelve 6th-grade triads were analyzed utilizing quantita-tive and qualitaquantita-tive methods. Neither prior achievement of group members nor the generation of correct ideas for solution could account for between-triad differences in problem-solving outcomes. Instead, both characteristics of proposals and partner responsiveness were important correlates of the uptake and documentation of correct ideas by the group. Less successful groups ignored or rejected correct proposals, whereas more successful groups discussed or accepted them. Conversations in less successful groups were relatively incoherent as measured by the extent that proposals for solutions in these groups were connected with preceding discussions. Perfor-mance differences observed in triads extended to subsequent problem-solving ses-sions during which all students solved the same kinds of problems independently. These findings suggest that the quality of interaction had implications for learning. Case study descriptions illustrate the interweaving of social and cognitive factors in-volved in establishing a joint problem-solving space. A dual-space model of what collaboration requires of participants is described to clarify how the content of the problem and the relational context are interdependent aspects of the collaborative sit-uation. How participants manage these interacting spaces is critical to the outcome of their work and helps account for variability in collaborative outcomes. Directions for future research that may help teachers, students, and designers of educational envi-ronments learn to see and foster productive interactional practices are proposed.
The properties of groups of minds in interaction with each other, or the properties of the interaction between individual minds and artifacts in the world, are frequently at the heart of intelligent human performance (Hutchins, 1993, p. 62).
Collaborative intellectual activity can be a fertile context for learning and discov-ery, and we have much to learn about how to foster it. Historical and first-person
Correspondence and requests for reprints should be sent to Brigid Barron, Stanford University School of Education, 485 Lausen Mall, Stanford, CA 94305. E-mail: [email protected]
accounts of creative work provide evidence that intellectual intimacy takes a vari-ety of forms, including intense face-to-face exchanges, commentary that leads to revision of papers or other products, coproduction of designed or artistic artifacts, and membership in a community of scholars or practitioners who exchange ideas distally and structure opportunities for public sharing. These studies suggest that intense interaction between partners nurtures achievements when partners share interests, knowledge, personal history, and a commitment to the work (Csikszentmihalyi & Sawyer, 1995; John-Steiner, 2000). Recent ethnographic and experimental studies of scientific practice provide even more detailed evidence of the consequential ways in which social interactional processes contribute to the generation of theories, the design of experiments, and the sorting of evidence and warrants (Dunbar, 1997; Lemke, 1990; Okada & Simon, 1997).
Despite the potential of collaboration, groups are too frequently a source of ag-gravation for individual members, leading to wasted time and feelings of discour-agement (Salomon & Globerson, 1989). Most striking are accounts in which the av-erage prior knowledge of a group or dyad is equivalent, and the collaborative work assigned is the same, but the problem-solving and learning outcomes resulting from the members’ interactions differ significantly (Barron, 2000a; Hogan, Natasi, & Pressley, 2000; Webb, Zuniga, & Welner, 2001). These data suggest that there is much more to collective thinking than pooling knowledge and that although the ca-pacity for mutual, coregulated engagement emerges in infancy (Stern, 1977; Trevarthen & Aitken, 2001), its achievement is never guaranteed.
A close look at research on collaboration and learning suggests the need for a better understanding of how social and cognitive factors intertwine in the accom-plishment of collective thinking. Research on short-term collaboration among school-aged peers has compared group problem-solving outcomes to individual problem-solving outcomes and generally found that, on average, group work leads to better problem-solving and learning outcomes (Barron, 2000b; Johnson & John-son, 1981; R. J. Stevens & Slavin, 1995; Webb & Palinscar, 1996). However, less re-search attention has been directed toward the variance between groups. Rere-search on cognitive mediators of collaborative learning makes the important point that it is not simply the act of asking children to work in groups that is essential but rather the pos-sibility that certain kinds of learning processes can be activated (Cohen, 1994). These include opportunities to share original insights (Bos, 1937), resolve differing perspectives through argument (Amigues, 1988; Phelps & Damon, 1989), explain one’s thinking about a phenomenon (King, 1990; Webb, Troper, & Fall, 1995), pro-vide critiques (Bos, 1937), observe the strategies of others (Azmitia, 1988), and lis-ten to explanations (Coleman, 1998; Hatano & Inagaki, 1991; Webb, 1985). There is even some intriguing experimental evidence that collaborators can generate strate-gies and abstract problem representations that are extremely unlikely to be observed when individuals work alone, suggesting that there are unique affordances of joint thinking (Schwartz, 1995; Shirouzu, Miyake, & Masukawa, 2002).
A key agenda for research on collaborative learning involves understanding the emergence of these kinds of opportunities and the processes that disrupt their emergence. Hutchins (1993, 1995) argued that human intelligent action is produc-tively conceived as an accomplishment that arises from properties of interactions between people or between people and artifacts in the world. How a particular in-teraction unfolds depends on the efforts of the individuals involved, their under-standing of the activity, the material resources they have available, and implicit or explicit conventions for proceeding with joint work. A core implication of this view is that to understand the nature of productive collaboration, we need to articu-late how social goals and discourse practices interact with knowledge-building processes that lead to coconstruction of understanding. There is a need for better articulation of the characteristics of interactions that lead to differentially produc-tive joint efforts.
To make progress on this agenda, measurement approaches are needed that capture variation in conversational exchanges and allow for analyses that pre-serve the group as the primary unit of analysis. Quantitative studies of collabora-tion frequently focus on the measurement of variables defined at the level of the individual and their effect on collaborative outcomes. For example, there are nu-merous studies that focus on the relation of group composition to collaborative outcomes in which composition is defined with respect to gender, prior achieve-ment, personality, or other individual traits (Fuchs, Fuchs, Hamlett, & Karns, 1998; Hill, 1982). Process studies have also relied on individually measured be-havioral variables as a way to assess mechanisms of collaborative learning. In these studies variables such as the number of explanations given during collabo-rative activities are correlated with learning outcomes (e.g., Webb, 1989) and the primary unit of analyses is the individual. Studies of conversational patterns that preserve the group as the unit of analyses may provide new insights about how and why some conversations are more generative than others for collective work and the emergence of learning opportunities.
The research in this article is concerned with advancing the understanding of how microinteractional processes between collaborators influence collective achievements and what individuals learn from their interactions. The analysis was initially motivated by an experiment on collaborative learning that found average benefits for sixth-grade triads over individuals asked to solve a mathematical and planning problem, but also revealed variability in group performance despite ran-dom assignment of high-achieving students to same-gender triads (Barron, 2000b). Subsequent case study comparative research (Barron, 2000a) suggested that to explain differences in collective accomplishment it would be important to develop constructs that reflect differences at the interactional level—that is, con-structs that reflect between-person phenomena. In this article I extend the analyses to 12 groups and share three main general observations about collaborative ven-tures that might advance our understanding of how and why variability in
collabo-rative outcomes can occur, even when the knowledge or insights that individual members generate does not differ between groups. The evidence for these general-izations is provided later, but the main ideas in brief are as follows:
1. The management of attention is a fundamental aspect of interactional work during collaborative problem solving. Joint attention at solution-critical moments is crucial for the establishment of a joint problem space (Roschelle, 1992; Teasley & Roschelle, 1993) in order for there to be synergy of efforts and achievement of intersubjectivity. Challenges to the creation of joint problem-solving spaces emerge as individual participants are simultaneously managing their own efforts to understand pieces of the problem and trying to understand what others are doing. An important accomplishment is the coordination of attention so that joint engage-ment can proceed. The data in this article suggest that the achieveengage-ment of joint at-tention was consequential for problem solving and learning.
2. Both speakers and listeners have consequential roles to play in establishing joint attention. Joint attention has primarily been studied during early development as it is first observed between 9 and 15 months (Adamson & Bakeman, 1991). Studies of infant–mother interaction provide interesting insights about the subtle ways in which partners help regulate the attention of the other and highlight how both partners are active contributors to the process. Studies of adult discourse also point to the highly skilled nature of multiparty talk (Goffman, 1981). The observa-tions of elementary school participants in this article make clear the barriers that some participants faced having their ideas heard and how this was particularly challenging if partners were self-focused. Some participants were successful in gaining attention even under less than ideal conditions if they were persistent in their efforts. The examples in this article highlight how speakers and listeners are engaged in a dynamic, interdependent process that can be influenced by a variety of attention regulating strategies.
3. Relational aspects of the interpersonal context are needed to explain be-tween-triad differences in the effective coordination of a joint problem-solving space. A close look at the interaction of some of the more challenged triads in this sample indicates that an analysis that only takes into account the cognitive aspects of the establishment of a “joint problem space” (Teasley & Roschelle, 1993, p. 229) will be inadequate for understanding variability in collaborative accomplishment. Collaboration might productively be thought of as involving a dual-problem space that participants must simultaneously attend to and develop acontent space(consisting of the problem to be solved) and arelational space
(consisting of the interactional challenges and opportunities). The content space and relational space are negotiated simultaneously and can compete for limited attention. Information made available in the space from the self and from others’ activities must be integrated. One needs to be able to monitor and evaluate one’s own epistemic process while tracking and evaluating others’ epistemic processes
(e.g., Can I see how my partners are thinking, and do I agree with their reason-ing?). The relational context is similarly complex and can be loaded with issues of identity related to both the self and one’s partners. For example, if I am more compelled by the thinking of a partner than by my own, can I subjugate my as-sertiveness in the process and have enough ego strength to support another? Conversely, if I am more compelled and convinced by my own thinking can I as-sert it strongly even if it means shifting the focus from another and perhaps risk-ing offense? And, what if I do attempt to share insight and it is ignored or mis-understood, then how should this be interpreted and what should be done? Identity issues can emerge in other forms, for example, if I have no idea what you are talking about or what direction the problem solving should take, am I willing to express confusion or uncertainty with respect to ideas on the table? Coordinated mutual engagement (Bakeman & Adamson, 1984) can be chal-lenged by issues that can arise in both of these spaces, and its accomplishment is both an interpersonal- and content-related process. The less successful groups in this data set exhibited relational issues that challenged mutual engagement and prevented the group from capitalizing on the insights of members.
In this article I present analyses that address three questions:
1. What interactional processes are associated with better group problem solving? 2. How does the quality group problem solving relate to individual learning
as indicated by subsequent independent performance on the same and a re-lated problem?
3. What social and cognitive factors contribute to the emergence of more and less productive interactional patterns?
Following a brief literature review, both cross-case quantitative analyses and idiographic case studies are presented that address these questions. These ap-proaches correspond roughly to what Jerome Bruner (1986, pp. 12–13) called the “paradigmatic” and the “narrative” modes of knowing. First, results from quantitative analyses of the conversations of all 12 groups will be shared. Mea-sures were developed to reflect phenomena observed in the earlier cases studied (see Barron, 2000a) and to appraise the conjectures just listed. These are ana-lyzed by statistically comparing their frequency in more and less successful groups’ conversations. In addition, the learning outcomes of members of more and less successful triads are compared. In a later section these phenomena are exemplified in the context of actual conversations of four groups who differed in their success level. An idiographic approach is used to illustrate how social and cognitive events unfold over time within a particular group of children. These qualitative accounts are used to further illustrate the interweaving of social and cognitive factors in the regulation of collaborative work and concretize the
afore-mentioned ideas. Narrative description is used to provide what Geertz (1973) called “thick description” (p. 7). Features of interaction such as gestures, intona-tion, facial expressions, eye gaze, and body language are all communicative acts and thus play a critical role in the analysis.
RESEARCH THAT HIGHLIGHTS THE NEED TO UNDERSTAND COLLABORATIVE VARIABILITY
Case study research provides detailed portraits of collaborative interactions that are missing in studies that look for patterns across many groups. Clark (1996, p. 3) used the term “ensembles” to capture the interdependencies of partners in conver-sation. By focusing on the group or ensemble, researchers can describe interac-tions that capture the dynamic interplay in meaning making over time in discourse between participants, what they understand, the material resources they use, the types of contributions that they make, and how they are taken up or not in a given discourse. This kind of research highlights the complexity of learning together and can identify key processes. For example, the key notion of a joint problem-space was generated from a careful case study analysis (Roschelle, 1992; Teasley & Roschelle, 1993). A joint problem-space was defined as a shared conceptual struc-ture developed in the course of collaborative work. In a study of two girls using a computer simulation designed to provide a dynamic view of velocity and accelera-tion, Roschelle argued that the creation of a joint problem-solving space was ac-complished through repeated cycles of displaying, confirming, and repairing un-derstandings. As the conversation progressed, the students expected increasingly explicit evidence that they understood one another. Although Roschelle’s analyses focused mostly on the cognitive aspects of creating a joint problem-space, other studies suggest that to deeply understand the nature of productive collaboration, attention must be paid to the ecology of relations that develops within interactions that allow group members to access and functionally express knowledge and other cognitive resources.
A recent article by Engle and Conant (2002) contributes to this research by ana-lyzing the productive disciplinary engagement of a group of elementary school students. The students become involved in a sustained debate about the proper bio-logical classification of Orcas as whales or dolphins. Driven by contradictory claims offered by various experts and adopted by opposing group members, this controversy remained alive for students over several weeks and reemerged in their discussions on eight occasions. Students’ passionate engagement was reflected in intensive emotional displays, persistence in having their ideas heard, additional re-search, and continued attention over weeks. A key aspect of their discourse that al-lowed for productive learning conversations rather than devolving into argumenta-tive shouting matches was the appropriation of scholarly moves such as the use of
various kinds of evidence to justify their claims. In addition, the analysis of talk made it clear that although at times students spoke over one another and competed for floor time, they held themselves accountable to the contributions that others made. This was indicated by the proportions of turns in which students associated particular group members with controversy-relevant claims or evidence. Engle and Conant called this process “positioning” (pp. 480–483). This group work took place in a research-based experimental classroom designed as part of A. L. Brown and Campione’s (1996) Community of Learners Project. The arrangements for collaboration were theoretically driven, and the analyses pointed to four conditions that made the debate possible:
1. Making the subject matter problematic.
2. Giving students authority to address such problems. 3. Holding students accountable to disciplinary norms. 4. Providing relevant research resources.
Other case studies foreground more disappointing interactions that emerge de-spite the best of intentions to offer reform-based activities. For example, in a recent article Sfard and Kieran (2001) used a single case to question the claim that mathe-matics learning is best done in interaction. They described episodes from a dyad participating in a 30-hr-long algebra sequence designed to support students’ alge-braic thinking. Two episodes of problem solving characterized by ineffectual com-munication were analyzed, showing a discrepancy between the two boys’ effort and willingness to work to understand one another. One boy continually tried to engage the other but was unsuccessful. These disparities led to less than ideal con-ditions for learning. In the end, the authors were cautious: “The road to mutual un-derstanding is so winding and full of pitfalls that success in communication looks like a miracle” (p. 70).
Within-study, between-group variability in problem-solving outcomes have also been reported (Forman & Cazden, 1985; Resnick, Salmon, Zeitz, Wathen, & Holowchak, 1993). For example, the level of reasoning expressed in conversation in the context of an instructional unit designed to support the development of stu-dents’ knowledge of the nature of matter was described by Hogan, Natasi, and Pressley (2000). Knowledge-building dialogue was coded as one of three major patterns: consensual, responsive, or elaborative. They noted that, despite having an identical task, one of their four groups had a great deal of difficulty sustaining knowledge-building conversations on their own. The most successful group had high rates of affirming, agreeing, and accepting remarks. These kinds of responses served to prolong the discussion of ideas and led to higher levels of reasoning. Why one group had more trouble was unclear; however, their difficulties resulted in more teacher intervention, suggesting that this outcome was visible to her.
QUANTIFYING MARKERS OF MUTUAL ENGAGEMENT
Case study analyses like those just reviewed provide detailed accounts of dialogue and crucial portraits of interaction. They provide theoretical insight and identify phenomena that need to be studied more broadly. Due to the nature of evidence, case studies are not well suited for making broad claims about the usefulness of collaboration for initial problem solving or learning and cannot help estimate the frequency of processes that result in variability in outcomes. The studies just re-viewed provide little sense of how representative the group interactions were rela-tive to the overall population of groups in the classrooms. Frequently, case studies provide neither data on learning outcomes nor quantitative indicators of how much a group accomplished jointly relative to other groups or individuals. However, these studies do suggest ideas for the development of measures that reflect joint processes that can be quantified.
Quantification is useful as it can provide a way to (a) examine links between interactional processes and outcomes such as the quality of the group product and individual learning, (b) estimate the degree of between-group variability in a given population, and (c) advance our ability to specify important processes. Quantifica-tion of conversaQuantifica-tions also allows us to rule out simple explanaQuantifica-tions for variability in collaboration such as the possibility that no group member generated correct ideas. Coding with reliable schemes and subsequent quantification can also pro-vide convincing epro-vidence for researchers who are less confident in qualitative ana-lytic work (National Research Council, 2002). For these reasons, measures of in-teraction were developed that would reflect how participants were responding to one another. Two main measures were the kind of responses that were given to pro-posals for solution, and the connectedness of a proposal to the content of the imme-diately preceding conversations. These are described in the Methods section.
ANALYTICAL APPROACH
I developed an analytical approach that uses the level of group performance on a complex problem as a lens through which it becomes possible to identify associ-ated patterns of interaction that are more and less successful for joint work. I coded qualities of proposal and response sequences and compared them for more and less successful collaborative groups (cross-case examination). I focused on correct proposals for solution and addressed why in some groups correct proposals are taken up and documented whereas in other groups they are lost. The focus on cor-rect proposals emerged from a review of transcripts that made it apparent that they were frequently not picked up. To address issues of uptake, responses to ideas were studied as well as the connectedness of ideas to preceding topics. Next, the ability of students to solve the same problem and a transfer problem independently during
subsequent sessions was compared as a function of the level of their group’s per-formance. This analysis extends our ability to understand the consequences of the quality of interaction for individuals. Finally, I describe for individual groups how types of proposal and response sequences emerge across time. This latter analysis allows us to develop a detailed portrait of the social and attentional factors that contribute to more and less successful collaboration.
METHODS Design
Children were asked to solve a series of problems posed to the main character in a staged, 15-min video adventure, calledJourney to Cedar Creek, the first episode in the series The Adventures of Jasper (Cognition and Technology Group at Vanderbilt, 1992, 1997). After a first session in which the entire class viewed Jour-ney to Cedar Creek,in a second session triads in the class jointly solved a mathe-matics problem during a 1-hr session. In two subsequent sessions, students were asked to solve additional problems individually. To investigate learning outcomes for individuals, two types of follow-up problems were presented in these follow-up sessions: To assess mastery, the problem solved during the first session was re-administered and solved individually by all study participants; to assess transfer, a structurally identical problem with different numbers was administered and solved individually by all study participants. This research uses the level of triad perfor-mance as an analytic contrast to compare learning outcomes and interactional pat-terns that might help explain triad performance differences. This research design is summarized as follows:
Participants
Participants were forty-eight 6th-grade students who scored at or above the 75th percentile on a nationally standardized achievement test in mathematics; they were randomly assigned to three-person, same-gender groups. Same-gender triads were
Experimental Sessions
Configuration 1 2 3 4 5
Alone — — Solve JCC Solve transfer
Team — Solve JCC — —
Whole class View JCC Discuss solution
used to simplify data interpretations because prior research has documented differ-ential patterns of participation as a function of the team gender composition (Webb, 1984). The participants all attended math classes taught by the same teacher at a public magnet school. The school served academically talented youth, especially ethnic minority students, and it was located in the southeastern region of the United States. The 16 groups of participants were videotaped while solving a Jasper problem (CTGV, 1997). Due to technical failure, four groups could not be included in the analysis; thus, this study analyzed data from 12 of the 16 groups. Four of these triads consisted only of female students.
Materials
Journey to Cedar Creek video. InJourney to Cedar Creek(CTGV, 1997), the main character is a young man named Jasper Woodbury. Jasper takes a river trip to see an old cabin cruiser he is considering purchasing. Jasper decides to buy the boat and plans to take the boat home that day. However, he has several major concerns about the feasibility of this plan (e.g., whether he can arrive home before sunset because the lights do not work and whether he will have enough fuel). The task for students is to identify and resolve these concerns.
Journey to Cedar Creek storyboard. To facilitate problem solving, each participant was given a set of 18 still movie scenes prepared in a storyboard format that contained all of the relevant numerical information needed to solve the Jasper problem. Beneath each picture was a caption that described the scene and provided additional quantitative information. When used in a classroom setting,Journey to Cedar Creekwould not typically be accompanied by a storyboard. Instead stu-dents would access information by using a videodisk containing the video adven-ture. The storyboard reduces some of the challenge in identifying subproblems and quantitative information. However, for purposes of the experiment it was impor-tant to make sure that all students had access to the information.
Workbooks. For the purpose of assessing their planning and problem-solv-ing performance, students were asked to complete a workbook assignment that posed eight questions. Time limits were set for each page to ensure that students spent the same amount of time on each workbook portion. The adequacy of these times was determined through a pilot study. There were two general plan-ning questions, three subproblem planplan-ning questions, and three solution ques-tions that ask students for quantitative soluques-tions to subproblems. These prompts were used to ensure that all children would consider each subproblem even if they had not thought of the subproblem on their own. The analyses reported in this article are based on the first subproblem that focused on time and involved calculating the distance (D) traveled and travel time (TT) and then comparing
the TT to the available time (AvT). One problem was selected due to resource constraints for transcription and to provide a deeper analyses of one conceptu-ally distinct piece of the solution.
Transfer video. The transfer problem was presented in a 5-min video. The narrative and problem structure of the transfer problem were analogous toJourney to Cedar Creek. However, all of the quantities and character names were different. The decision making of the main character, a woman named Nancy, formed the ba-sis for the problem.
Transfer information sheet. To facilitate students’ problem solving, an in-formation sheet summarizing the story and the relevant numerical inin-formation was created.
Transfer workbooks. The types of questions in the transfer problem work-book were identical to those in theJourney to Cedar Creekworkbook. The time allotted for each type of question was also the same. Only the characters’ names were changed.
Procedures
All students participated in four sessions, taking place on consecutive days, and each lasted approximately 1 hr. In Session 1, students viewedJourney to Cedar Creek. In Session 2, students were asked to solve theJourney to Cedar Creek prob-lem with their partners. This is the only session in which the students worked to-gether. In Session 3, students were asked to solve the Journey to Cedar Creek
problem again, but all students solved the problem individually. In Session 4, stu-dents viewed the transfer video and solved the transfer problem. Again all stustu-dents completed the problem alone. After all the data was collected, a final session took place during which the solution was discussed by the class as a whole.
Session 1: Viewing the video. In the first session students viewedJourney to Cedar Creekas a group in their classroom. They were told the following:
You are about to see a 15 minute video of a river trip taken by a person named Jasper Woodbury to see a boat he might buy. As you watch the video, you’ll see that Jasper has to solve some problems in order to get the boat back home. Please pay attention to the problems Jasper has to solve. Tomorrow, you will be asked some questions about these problems.
After the video was over students participated in an exercise designed to en-courage easily interpretable written problem-solving protocols. This exercise
con-sisted of presenting a word problem and discussing how to write its solution so that someone else would understand what was done. In addition, students solved a problem on their own and practiced showing their work. The mathematical content and subject matter of the problems were unrelated to the types of problems con-tained in the Jasper problem.
Session 2: First attempt to solve Journey to Cedar Creek. The experi-menter explained the format of the storyboard by telling students that the pictures and captions contained all the information relevant to solving the problem. Each caption was read aloud. Following this introduction to the storyboard, triads were brought to an empty room where several small tables were arranged, separated by office dividers. Each team was seated at a table with a video camera placed at the head. An adult sat at the end of each table to monitor the operation of the video camera. Before entering, students were asked to listen to one another as they worked. Students were also told to take turns recording the group’s answers by al-ternating writers after each page. Students were told that they would be given a set amount of time on each page and that they were not to turn the pages until told. The experimenter read the question on each page aloud as they came to it.
Session 3: Mastery. All students solved the problem individually in their classroom. Each student received a storyboard and a workbook. Workbook ques-tions were read aloud, and students were told when to turn the page. The same amount of time was given for each page. In this session, only the experimenter and the teacher were in the room.
Session 4: Transfer problem. All students solved the problem individually in their classroom. Students first viewed a 5-min video that described the transfer problem. Each student received an information sheet that listed relevant informa-tion from the video. Workbook quesinforma-tions were analogous to those asked about
Journey to Cedar Creek. All students solved the problem individually in their classroom. Procedures for administration were identical to the mastery session.
Dependent Measures and Scoring Procedures
Students’ written solutions during the collaborative and independent prob-lem-solving sessions were scored. In addition, student conversations were tran-scribed and coded. The procedures for scoring written problem-solving solutions are described next.
Coding Written Solutions
Each triad was asked to generate a single quantitative solution to answer each of the three subproblems. The analyses reported here are based on the first subproblem in which students were asked to decide whether there was adequate time to deliver the boat home. To make this decision, students needed to determine the following:
1. The number of miles to be traveled on the return trip (D). 2. The length of time the return trip would take (TT).
3. The time that he would arrive back to his home dock (ArT) or the number of hours available for travel before the sunset (AvT).
Each calculation needed was given a score of 0, 1, or 2 points. Partial credit could be awarded if students used all of the correct numbers but carried out an incorrect operation or did the correct operation but used incorrect values. For each subproblem, the points earned were summed. This subproblem score was trans-formed into a percentage of the correct score by dividing the earned points by the total possible points.
Using the correct numbers was defined as using the correct values from the in-formation sheet or from previous calculations. Occasionally students wrote a num-ber incorrectly (e.g., wrote 132.4 instead of 132.6 for the mile markers on the river). These written errors were ignored in the scoring. Also, calculation errors occurred occasionally. Because conceptual understanding was the focus, these er-rors were also ignored in the scoring. In addition, if participants used a number in later calculation that was incorrect because of a calculation error, they were still scored as using the right number because they had used the right variable (e.g., if they made a calculation error on D and then used this number when calculating TT). To assess the reliability of the coding schemes, two coders independently coded 15% of the workbooks generated across the 3 days. Overall agreement ranged from 90% to 96% across schemes.
Coding Problem-Solving Conversations
Students’ problem-solving conversations were transcribed. The emphasis of the transcription was accuracy of content and sequence of turns rather than speaker in-tonation or other discourse properties. Transcripts were parsed into turns; each was defined as a segment of speaker-continuous speech. If an interruption stopped the speaker from speaking, then the turn was considered completed, even if the content of the turn was resumed later. If the student did not stop talking even though some-one else was speaking, then all of the content was considered to be part of that same turn. Backchannel responses, such as “yes,” “uhm,” and so on, were also
con-sidered as turns. Three coding schemes were developed to summarize distinct as-pects of the problem-solving dialogue, and they are discussed in the Results and Discussion section as they become relevant.
RESULTS AND DISCUSSION Overview of Analyses
The analyses are presented in six sections.
1. In the first section I statistically compare the written group performance of more and less successful triads.
2. After confirming that this difference is significant, I provide analyses that test whether more and less successful triads differed on other variables that might account for the performance differences. These include the average prior achieve-ment of partners, the number of turns taken by triads, the average difference be-tween partners in number of turns taken, and the number of correct proposals made in conversation. These analyses confirmed that neither preexisting achievement disparities nor a number of plausible interactional variables could explain the dif-ferences in group problem-solving outcomes.
3. Having demonstrated the need to look more deeply at the nature of interaction around solution proposals, I present a coding scheme that differentiates types of re-sponses to correct proposals to test the hypothesis that the group problem-solving outcomes might be related to the ways that partners respond to proposals.
4. Given that these analyses confirmed differences in the patterns of re-sponses to correct ideas, the hypothesis that the extent to which a proposal is closely related to the preceding discussion makes a difference in the kind of re-sponse it receives is tested.
5. In the next section I focus on the implications of differences in interactional processes and group outcomes for individual learning. Students’ individual perfor-mance on the same problem with different quantitative information and a transfer problem is compared as a function of whether they participated in a more or less successful triad.
6. In the final section I present four cases of interaction that exemplify in more detail the unfolding of interaction across time and that help provide a richer picture of how the social and cognitive aspects of interaction are intertwined.
Performance Differences Between More and Less Successful Triads
Of the 12 triads in the sample, 7 produced a written solution that was completely accurate. The remaining triads produced protocols that earned from 0% to 67%
correct. Using 50% correct as a criterion I classified the triads as more or less suc-cessful. Of the more successful triads, five consisted of boys and three consisted of girls. Of the less successful triads, three consisted of boys and one consisted of girls. As shown in Table 1, the mean percent correct for more successful triads and less successful triads were 96% and 29%, respectively. The significance of this dif-ference was confirmed by attest,t(2, 10) = –7.25,p< .001.
Reasons for Variability in
Collaborative Written Performance
There are several plausible explanations why groups might have varied in the suc-cess of their joint work despite the random assignment of individuals to groups. Al-ternative explanations were tested and are described in the following hypotheses:
Hypothesis 1: More successful groups had higher average math achieve-ment scores than less successful groups.
To examine this possibility the average mathematics achievement scores ob-tained through a standardized achievement test of more and less successful triads were compared. As shown in Table 1, the difference was not significant,t(2, 10) = –1.35,p< .21.
Hypothesis 2: More successful groups were more talkative than less suc-cessful groups.
TABLE 1
Comparison of More and Less Successful Triads on Problem Solving Scores, Prior Achievement, and Features of Dialogue
Variable Performance Level M SD t(2, 10)
Group problem solving score More successful .96 0.12 –7.25*
Less successful .29 .21
Prior math achievement More successful .91 1.5 –1.35
Less successful .89 4.24
Total number of turns More successful 128.00 69.00 –.13 Less successful 123.00 50.00
Mean turns per person More successful 43.00 22.97 –.14 Less successful 41.00 16.7
Correct proposals More successful 5.75 2.5 .78
Less successful 7.75 6.5 *p< .01.
It is possible that even though students had similar scores that there were other differences, such as the amount of speech production, that might have influenced problem solving. To test this possibility, a comparison was made of the total mean number of turns taken in more and less successful groups. As shown in Table 1, the difference in number of turns was not significant,t(2, 10) = –.13,p< .89. To look at this issue in another way, the average number of turns each participant took during the problem-solving conversation was compared. Once again, as shown in Table 1, the difference was not significant,t(2, 10) = –.14,p< .88.
Hypothesis 3: Groups differed in performance because no members of the group could generate the correct proposals in conversation.
A plausible explanation for difference in written performance is that no one in the group was able to generate the correct approach for finding the solution, or, if they were able to, they kept it to themselves rather than sharing it with their peers. To examine this hypothesis, the transcripts were examined for the articulation of correct proposals. Specifically, the transcripts were coded for the presence of solu-tions to the D, TT, AvT, and ArT variables. Both equasolu-tions and outcomes were coded. Sometimes a student would state the entire equation, for example, “Divide 24 miles by 8 miles per hour.” Other times a student would simply say, “Now you divide.” If the numerical information had been given previously, this type of contri-bution was counted as suggesting an equation. Sometimes students stated out-comes along with the equations, and sometimes they stated outout-comes but did not provide equations. Two coders independently coded student contributions. Interrater reliability for each category was above 90%.
The average number of correct proposals generated in conversation for more and less successful triads was then compared. Proposals were counted until they were documented in the workbook. As shown in Table 1, this difference was not significant,t(2, 10) = .78,p< .45. On average, less successful groups generated one more correct proposal than unsuccessful groups. If we look at the number of unique proposals generated, by excluding repetitions, a similar pattern emerges.
Interactional Differences in High- and Low-Scoring Triads
Given that differences in the performance of groups could not be accounted for by a variety of plausible variables, I moved to a deeper level of analysis that looked for more subtle variation in interactional processes. Interactions among students can be quantified in many ways. Here the analyses were guided by the question of why correct proposals were never documented in the workbooks. To address this ques-tion, a coding scheme was developed to capture the responses of peers to the cor-rect proposals generated. Three categories of responses were used: accept, discuss, and reject or ignore. Accept responses included agreeing with the speaker or
porting the proposal, proposing a next step, documenting the proposal, or assisting with documenting the proposal. Discuss responses included any response that would facilitate further discussion of the proposal. Thus, questioning a proposal, challenging it with new information or a different mathematical operation, and re-questing time so that a previous task (usually documentation of a previous pro-posal) could be completed and then the discussion started were all responses that would fit in this category. Reject or ignore responses included reactions that did not promote further discussion of the proposal. Thus, providing no verbal re-sponse, ignoring a proposal or shrugging it off, and rejecting it were all part of this category. For consistency with the notion of no-verbal response, just observing, even attentively, and documenting previous proposals without commenting on cur-rent proposals were also responses placed in this category. Overall reliability be-tween two coders on these items was 85.4%. Occurrence reliability for accept, dis-cuss, and reject or ignore responses were 78.3%, 73.3%, and 76.5%, respectively. Examples of responses and the coding criteria are presented in Table 2.
Hypothesis 4: More and less successful groups differed in how they re-sponded to correct proposals.
Do successful and unsuccessful groups differ in their pattern of responses to correct proposals? To address this question the proportion of each response type observed for more and less successful groups was calculated. In the first analysis the responses of both partners were included. This yielded a total of 92 responses to 46 proposals for the more successful groups and a total of 62 responses to 31 proposals for less successful teams. These data are shown in Table 3.
There were three times as many accept responses, twice as many discuss re-sponses, and less than half as many reject or ignore responses in more successful groups. Chi-square analyses confirmed that the pattern of response types to correct proposals differed for more and less successful groups across each of these re-sponse types,χ2(2,N= 154) = 30.79,p≤.01.
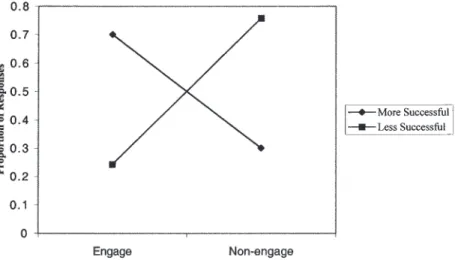
These results suggest that there is a significant difference between more and less successful groups in the way that partners respond to correct proposals. Previ-ous research has pointed to the importance of reciprocal engagement of ideas for progress (Phelps & Damon, 1989). In the current coding scheme, I distinguished between acceptance and clarification responses. However, a request for clarifica-tion is in fact a form of engagement of the ideas. Thus, the accept response and the discuss response categories were collapsed into one category called engaged re-sponse and contrasted with the reject or ignore rere-sponse category, which is called the nonengaged response category. This makes even more salient the difference between more and less successful groups in the quality of the responses. As shown in Figure 1, in more successful groups, two thirds of the responses to correct pro-posals engage the ideas by accepting them or making a bid to have them discussed
324
TABLE 2
Coding Criteria for Responses to Correct Proposals
Category Definition Examples
Accept Any response that indicates agreement with the content of the proposal. These include simple verbal acceptances, agreement with an elaboration of the answer by providing relevant warrants, a new proposal, or a new question that needs to be addressed. Also included are responses that take the form of documenting the proposal in the workbook.
“Yeah, okay.” “Yeah, because that is the distance between the mile markers.” “So, now we need to figure out how long it will take him.” “24 miles, that means he can make it home before sunset.”
Discuss Responses that acknowledges proposals but does not accept them outright or reject them without rational. This includes responses that question the accuracy of a proposal or its warrants. Also included are responses that provide an alternative solution and instances when a student acknowledges the proposal by asking for more time due to other ongoing activity. Restatements that signal evaluation are also coded in this category.
“How did you get that?” “Why are you
multiplying?” “What did you say?” “Just a minute." “Let me think about that.” “But how fast does the boat go?” “It will take three hours?”
Reject or ignore (nonengage)
Responses that reject the proposal without a rational are coded in this category as are instances when there is a lack of a relevant verbal response within six turns and no nonverbal signals that students are listening (e.g., documentation or eye contact without turning away).
“We’re not doing that.” “That’s stupid, you’re wrong." “I know what I’m doing.”
TABLE 3
Proportion of Types of Responses to Correct Proposals in More and Less Successful Groups
Type of Response
Accept Discuss Ignore–Reject
More successful teams .48 .22 .3
Less successful teams .15 .09 .76
Note. Portions are based on 92 responses to correct proposals in more suc-cessful teams and 62 responses to correct proposals in less sucsuc-cessful teams.
or clarified. In contrast, in less successful groups only one third of the responses engage the ideas in one of these ways. Note that the proportions are nearly in-verted, with successful groups producing a fairly high rate of engaged responses, whereas unsuccessful groups produce a fairly high rate of nonengaged responses. Chi-square analyses confirmed that successful groups made significantly more en-gaged responses than unsuccessful groups,χ2(1,N= 154) = 30.52,p≤.001. Thus,
the analyses suggests that the groups did differ significantly and in the direction that one would expect.
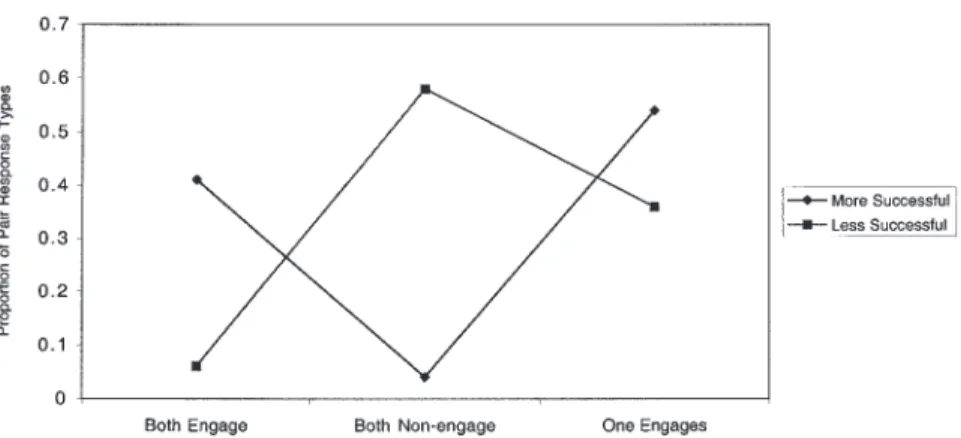
In addition to looking at individual responses to correct proposals, response pairs were examined. It is important to realize that when people work in groups, of-ten one person’s response is taken to be the group’s response, especially if the other group members remain silent. Thus, to determine whether responses to correct proposals were different as a function of group success level if one looks at whether at least one partner engages the group, response pairs were examined. Maintaining the distinction between engaged and nonengaged responses, three types of response pairs are possible. These include engage and engage, engage and nonengage, and nonengage and nonengage. The proportions of each response-pair type are presented in Figure 2. Chi-square analysis indicated that successful groups and unsuccessful groups differed in their production of pair types,χ2(2,N
= 77) = 30.23,p≤.001. Thus, these results suggest that one characteristic of the in-teractions of unsuccessful groups includes a lack of responsiveness by both the other partners. Again, it is interesting to note the magnitude of the difference be-tween more and less successful groups. As shown in Figure 2, the proportion of nonengage response pairs observed in less successful groups was close to 10 times
FIGURE 1 Proportion of responses that engage correct proposals in more and less suc-cessful teams.
greater than the proportion produced by more successful groups. In more success-ful groups, this occurred rarely. In less successsuccess-ful groups, this occurred more than half of the time a correct proposal was made.
Proposal Characteristics
The fact that in a high proportion of cases the partners did not respond suggested the need to also look at characteristics of the proposal in relation to the immedi-ately preceding activity of the two partners. Specifically, given the case analyses reported in Barron (2000a), a reasonable hypothesis was that participants’ atten-tion was not coordinated during problem solving and individuals were working in parallel. To examine how conceptually related the proposal was to the preceding conversation, a coding scheme was developed that differentiated proposals that were more and less connected to the preceding conversational topic.1
Each correct solution proposal was coded for its relatedness to a group’s previ-ous interaction. Originally, this code consisted of three categories: directly, some-what, and distally related. However, due to challenging issues of achieving interrater reliability, the system was simplified to include only two categories—di-rectly and not-dicategories—di-rectly related. To code proposals for relatedness, the dicategories—di-rectly pre-ceding conversational turns were first coded for the problem space they addressed. Problem space consisted of four categories defined by the subproblems the groups needed to solve in order to arrive at a decision about leaving before sunset. These categories consisted of D, TT, ArT, and AvT. Thus, if participants were discussing how long it would take the boat to travel back to the dock, they would be discussing
326 BARRON
FIGURE 2 Proportion of paired peer response types in more and less successful triads.
1I thank David Sears for his work on this aspect of the analyses. It was the basis for his first-year re-search project in the School of Education at Stanford University.
TT (and working in the TT problem space). ArT refers to when Jasper would get back to his dock, and AvT refers to how much time Jasper had until sunset.
If a proposal matched the problem space the group had been working in just prior to the proposal, then it was coded as directly related. For example, if a team member said, “we need to find out how many miles he has to travel,” and then an-other student proposed that, “we need to subtract the mile markers,” then the pro-posal would be coded as directly related because the propro-posal addressed the prob-lem the first speaker articulated. If the proposal did not match, then it was coded as not-directly related. For example, if a student said, “we need to know how many hours until the sun sets,” and his or her partner immediately proposed that, “we can find out how long it will take him to get home if we divide the 24 miles by 8 miles an hour,” then the proposal would be coded as unrelated because what was pro-posed would not address the problem introduced by the prior speaker.
In a few cases, the prior problem space was undefined because the group was jumping from one problem space to another or individuals were focusing on differ-ent problem spaces. These were coded as unclear. Occasionally, participants also moved from one solution directly to the next solution. For instance, if a participant said, “Jasper has to travel 24 miles (D) which at 8 miles per hour is three hours (TT),” then the statement would be broken into two correct proposals (D and TT), and the preceding problem space for the second proposal would be coded as a tran-sition. (The problem space preceding the first proposal would be defined in the usual manner as just described.) Transition points and unclear points were coded for relatedness by seeing whether the speaker had at least one group member’s at-tention (if speaking to the group) or a single group member’s atat-tention (if address-ing that particular individual). Obtainaddress-ing attention was defined as lookaddress-ing at the speaker or writing what he or she said. If the speaker had attention during the tran-sition or unclear point, then his or her proposal was coded as directly related, other-wise it was coded as not-directly related.
The coding procedure involved identifying correct solution proposals on tran-scripts of the 12 groups and coding the relatedness of the proposal to the immedi-ately preceding problem space. Coding stopped for each type of correct solution proposal (e.g., D or TT) after participants in the group agreed on an answer and be-gan documenting it in their workbook. Interrater reliability on this coding system was 89%. The coded data were used to address Hypothesis 5.
Hypothesis 5: Do successful groups propose ideas that are coordinated with the content of the preceding discussion and are these more likely to be accepted?
Relatedness of proposals. The proportion of proposals that were directly related for more and less successful groups is shown in Table 4.
Chi-square analyses confirmed that more successful groups produced a higher proportion of directly related proposals than less successful groups,χ2(1, N= 77) = 31.12, p≤.001. As shown in Table 4, unsuccessful groups produce a much higher proportion of not-directly related proposals than successful groups, suggesting that their group cohesiveness as indicated by turns connected topi-cally is lower than those of successful groups. More than half of the proposals produced by less successful groups were not directly related to the preceding conversation. In contrast, virtually all of the proposals produced by the more successful groups were directly related.
Do responses to proposals differ according to how they are produced? As shown in Table 5, the means indicate that directly related proposals were accepted at a much higher rate than not-directly related proposals, and they were rejected or not verbally addressed at a much lower rate.
Do successful and unsuccessful groups differ in how they respond to directly re-lated versus not-directly rere-lated proposals? The results indicated that less than half the time unsuccessful groups respond to directly related proposals by engaging
328 BARRON
TABLE 4
Relatedness of Correct Proposals to Proceeding Conversation in More and Less
Successful Groups
Relatedness Direct Indirect
More successful teams 0.98 0.02
Less successful teams 0.4 0.58
Note. Proportions are based on 46 proposals in more successful groups and 31 proposals in less successful groups.
TABLE 5
Responses to Related and Indirectly Related Correct Proposals by More and Less Successful Groups
Type of Response
Accept Discuss Ignore/Reject
Related
More successful teams .49 .2 .31
Less successful teams .31 .15 .54
Indirectly related
More successful teams 0.0 1.0 0.0
them. In contrast, successful groups engaged both directly related and non-directly related proposals most of the time. For not-directly related proposals, however, they tend to reject or not verbally respond to them at a very high rate.
What Is the Relation Between
Group Performance and Individual Transfer?
It seems likely that triads that both generated and documented correct solution proce-dures may have provided better learning opportunities for students. To address the question of whether the effect of collaboration would extend to individual prob-lem-solving sessions, all students were asked to solve theJourney to Cedar Creek
problem a second time. In the third session, students were asked to solve the near-transfer problem. The near-transfer problem was administered to evaluate whether students’ learning extended to an analogous problem with different numbers rather than being tied to superficial features such as which numbers their team used on a particular page. The questions posed about the transfer problem and the dependent measures derived from answers were otherwise identical to the original problem.
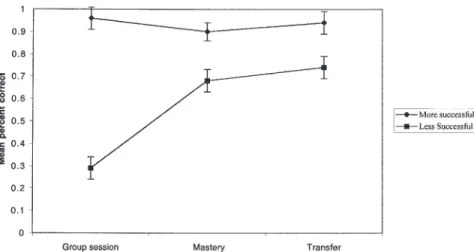
During the first problem-solving session, students in teams produced only one problem-solving protocol and hence received a single score. Because there is only one score for all three group members, completing a repeated measures analysis would be inappropriate due to the lack of independence between the scores. Thus, the first set of analyses reported compares performance on the same problem and on a near-transfer problem as a function of whether the student was originally in a more or less successful group. These analyses examine whether initially solving the problem in a high-scoring group had no effect, a positive effect, or a negative effect on individual performance as compared to a low-scoring group. Due to the nature of the design, direct statistical comparisons between students’ initial perfor-mance and mastery and transfer perforperfor-mance were not made. However, for com-parative purposes, performance scores for all three sessions, as a function of condi-tion and problem-solving measure, are presented in Figure 3.
Independentttests revealed that students in successful groups performed signifi-cantly better than their peers in unsuccessful groups on both the mastery test,t(31) = –3.53,p< .01, and the transfer test,t(31) = –2.34,p< .03. Although the mean score for the students in the more successful groups decreased slightly from the group session to the mastery session (–5.6%), the transfer score was virtually the same as the group score (–1.5%) suggesting they benefitted from their high-quality collaborative interactions.
The pattern was quite different for students in the less successful groups. Recall that their group score had to be 50% or below to qualify as an unsuccessful group. On the mastery test, however, their mean was up to 68.1%; and on the transfer test, their mean increased to 73.7%. Note that the mean scores for the first attempt at the problem are lower than those obtained by students who were randomly assigned to the individual condition in the original experiment (see Barron, 2000b). The
aver-age score for the 48 individuals on the sunset problem in the original experiment was .68 (SD= .33). However, the mastery and transfer scores for students in less successful groups are similar to those of students in the individual condition. The average score was .71 (SD= .33) in the mastery session and was .77 (SD= .31) in the transfer session. These findings could be interpreted as suggesting that if you are in a problematic group, you might as well be working alone; if it is your only chance at performing, then you are actually better off working alone. Despite this finding, note that poor collaboration did not harm learning when compared to con-ditions of working alone.
Summary of Quantitative Findings
The quantitative analyses established that groups that differed in their level of joint success did not differ on a number of variables that might plausibly account for the observed difference. These variables included prior achievement, the number of turns, or the number of times correct proposals were brought into the group. What differed between more and less successful groups was how peers responded to ideas. More successful groups responded to correct proposals by engaging them in further discussion or accepting and documenting them. In contrast, less successful groups had a high probability of responding to ideas with silence or by rejecting them without rationale. Further analyses suggested that the conversations in less successful groups were not as aligned topically as those in more successful groups. Frequently when a peer generated a correct proposal, the conversation that was oc-curring just previously was not closely related to the proposal. A reasonable
hy-330 BARRON
FIGURE 3 Solution scores of more and less successful teams for each problem-solving session.
pothesis is that this would make it harder for peers to recognize the significance of the proposal. However, almost half of the correct proposals were directly related and most were still not accepted or taken up in the conversation. To understand in more detail the various reasons why the correct proposals were not taken up, I pro-vide some example cases in the next section. The data on learning outcomes sug-gest that understanding in detail the nature of more and less successful interactions is important for individual learning as well as for joint performance.
Case Analyses That Preserve Interactional Properties of Joint Work
Although the previously discussed quantitative analyses provide convincing evi-dence of the interdepenevi-dence of partners in joint problem-solving work, they do not offer accounts that might provide theoretical insight into the deeper reasons that more and less productive interactions arise. To understand why these interactional patterns emerged in the quantitative findings, a contextualized analy-sis that allows for a fuller utilization of the available information to make interpre-tations about what was happening (Bateson, 1972; Erickson, 1977; Kendon, 1982; Levinson, 1983) when proposals were ignored, rejected, questioned, or accepted is needed. Thus, although the quantitative analyses help identify how groups fail and the consequences of this failure, the qualitative analyses constitute a localized ac-count of why groups fail.
Maintaining the group as the unit of analysis focuses attention on the emergent patterns of interaction and allows for the identification of individual conversational moves that can shift patterns. Interactions are temporally ordered in histories that accumulate in effect but are also subject to disruption and changes in trajectory if there is sufficient energy and persistence to gaining floor or being understood. These phenomena are critical to our understanding of the nature of collaborative exchange and to the prospect of helping teachers recognize and foster productive learning interactions.
Video records of interactions make possible the incorporation of multiple kinds of data into the analyses. An important property of language in interaction is its flexibility and generativeness. Silence, repetition of ideas, eye gaze, gestures, physical synchrony, laughter, pauses, interruptions, and overlaps in turn taking do not have single meanings but have a productive ambiguity; thus, depending on the context, they can serve to signal different things to participants. Such behavioral displays all become available through video interaction analysis for making sense of how interaction unfolds over time and for drawing out the relational and social aspects of collaborative problem solving.
In the following section, I provide synopses of the interactions of four triads, two more successful and two less successful. These cases were selected to provide examples of the three main generalizations offered earlier in this article:
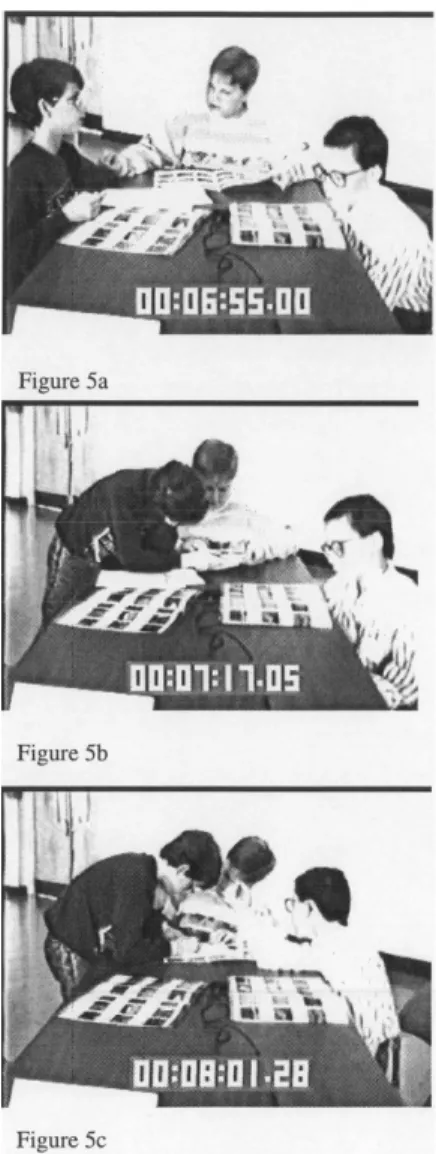
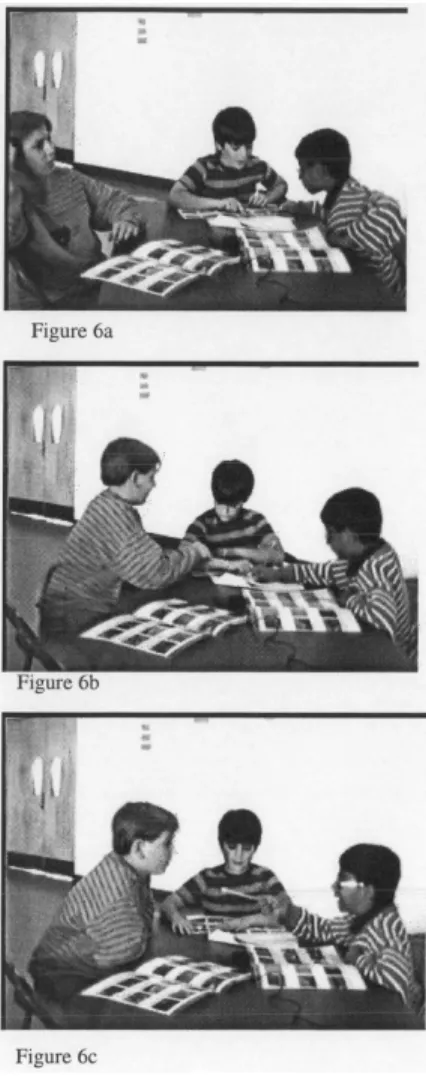
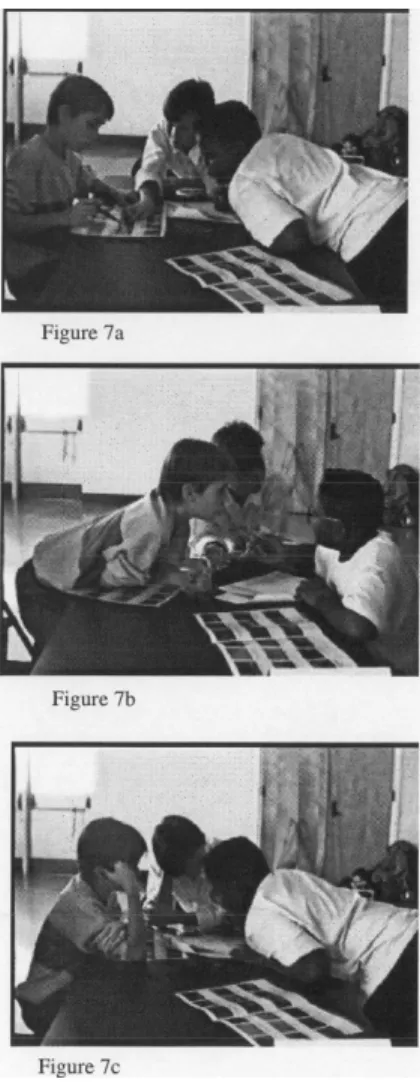
1. The management of attention in collaborative groups is a fundamental piece of interactional work. The groups differed in the extent to which joint attention was achieved and, consequently, whether an understanding of the problem was shared. In all groups, strategies for recruiting and maintaining joint attention were de-ployed. These included nonverbal strategies like pointing, tapping one another on the arm or shoulder, and moving to share visual perspective on the workbook. Par-ticipants also offered metacommunicative comments about the need to keep pace with one another and, at times, sharp commands to listen. These attempts were not always successful and less so in the lower scoring groups.
2. Both speakers and listeners had consequential roles to play in establishing and maintaining attention. Getting and keeping the floor (Goffman, 1981) was a chal-lenge for some students, and the task was made more difficult when partners were highly self-focused. Mitigated proposals were quite ineffective when potential re-sponders were otherwise occupied. However, persistence coupled with increasing strength of presentation paid off for some individuals in challenging conversational contexts. These shifts highlight the dynamic nature of problem-solving conversa-tions and draw attention to the importance of understanding students’ strategies, or lack of them, for repairing communications when they become problematic.
3. Relational aspects of the interpersonal context are needed to explain be-tween-triad differences in effective coordination of a joint problem space. In some of these groups, problematic relational issues did arise, often when one or more members did not display a strong intent to collaborate or what has been called an “intersubjective attitude” (Crook, 1996, p. 116). Such intent can be expressed behaviorally by how participants orient to others and by how willing they are to en-gage in coregulation of the interaction (Fogel, 1993), their attention to partners’ contributions, and the sharing of ownership over the work. A willingness to coregulate the interaction was missing in some of the less successful triads. In-stead, exchanges were oriented toward dominating the problem solving and may have stemmed from a need to protect one’s identity as a competent problem solver. The unwillingness to negotiate a shared space interfered with processes of distrib-uted reasoning and resulted in failures to solve the problem.
Cases 1 and 2 are drawn from the less successful subsample. In Case 1 the pri-mary theme is one of a struggle between two members about who gets to generate the solution. Barron (2000a) analyzed this case in detail, so I summarize it here. In Case 2 the establishment of a joint space is problematic due to the combination of a self-focused partner and a hesitant contributor who, nonetheless, has something important to offer. Case 3 offers an example of a triad who confronted some of the same issues of establishing a joint space but who had members that demanded the joint attention be preserved (or recruited others to agree to this point) and hence avoided breakdown. Case 4 offers an example of a well-coordinated triad whose interactions were not atypical in the more successful triads.
The Problem and Alternative Solution Paths
For the reader to follow the dialog, the relevant quantitative information is pro-vided here. The problem posed to the students was to make a decision about whether Jasper had enough time to make it home in his new boat before the sun-set as the boat had no running lights. To make this decision, students needed to determine the number of miles to be traveled on the return trip (D), the length of time the return trip would take (TT), and the time that he would arrive back to his home dock (ArT) or the number of hours available for travel before the sun-set (AvT). As mentioned previously, students were given a storyboard with 18 stills from the movie that helped them to remember relevant scenes and quantita-tive information. To determine D, students needed to subtract the mile markers associated with each dock. The starting dock was located at mile marker 156.6 and the destination dock was located at mile marker 132.6, so the total D they needed to travel was 24 miles. TT could be calculated in one of two ways. Rate was provided as 8 miles per hr and as 7.5 min per mile. If students use the for-mer, then they divided 24 miles by 8 to arrive at 3 hr. If they used the latter, then they multiplied 7.5 by 24 to arrive at 180 min, which then needed to be trans-lated into hour units. Finally, students needed to calculate ArT by adding TT to departure time and then comparing ArT to sunset time. Departure time was 2:35 p.m. Adding 3 hr yielded an ArT of 5:35 p.m., which was earlier than the 7:52 p.m. sunset time. Alternatively they could compare TT to AvT. AvT could be calculated by subtracting sunset time and departure time, yielding 5 hr and 17 min of AvT, which was more than the 3 hr needed to get there.
As will become apparent, some students focused not just on time but started to think about fuel capacity and whether he would have enough fuel to arrive home. This problem is one of the problems they needed to resolve and was asked next in the workbook. It is conceptually related (if not enough fuel, then time to get fuel may extend the TT) but is not the focus from the standpoint of the question posed in the workbook.
CASE EXAMPLE 1: COMPETING TO KNOW
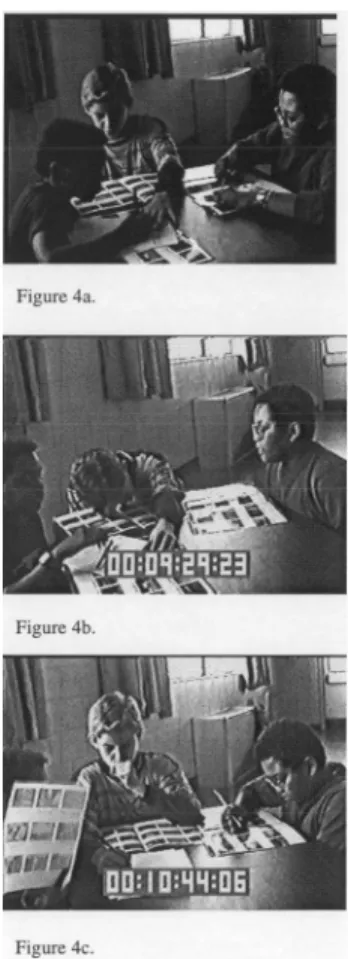
A salient aspect of this group’s interaction was the competitive nature of the ex-changes. The still image in Figure 4A was taken from a sequence of interaction that co-occurred with the episode of dialogue presented here:
Example Excerpt 1: Two solution paths, competitive talk, and claims of competence. 81. Brian: I know, okay, it’s 2:35, okay, so we need to say umm umm times
82. Chris: See if it’s 24 miles (he points at frame # 2) eight miles per hour (points at frame # 14) and it’s 20, 24 miles it would be. (Chris glances back and forth from his storyboard to Brian’s face as he speaks.)
83. Brian: Now, just write this down (to Alan). I know what I’m doing. 84. Chris: No, I do (softly with slight smile while looking down
at his storyboard).
85. Brian: 2:35, 3:35, 4:35.
86. Chris: See if he has 24 miles and the boat goes at eight miles per … eight miles per hour and there’s 24 miles.
87. Brian: I know what I’m doing. 88. Alan: We gotta label.
334 BARRON