U.S. Commodity Futures Trading U.S. Securities & Exchange Commission
Commission 100 F Street, NE
Three Lafayette Centre Washington, D.C. 20549
1155 21st Street, NW (202) 551-5500
Washington, D.C. 20581 www.sec.gov
(202) 418-5000
www.cftc.gov
PreliminaryFindingsRegarding
theMarketEventsofMay6,2010
ReportoftheStaffsoftheCFTCandSECtotheJointAdvisoryCommitteeon
EmergingRegulatoryIssues
May 18, 2010
This is a report of preliminary findings by the staffs of the U.S. Commodity Futures Trading Commission and the U.S. Securities and Exchange Commission. The
Commissions have expressed no view regarding the preliminary analysis or conclusions contained herein.
TableofContents
I. INTRODUCTION ...1
II. EXECUTIVE SUMMARY ...2
III. GENERAL MARKET CONTEXT ...11
IV. PRELIMINARY FINDINGS ...17
A. Securities Markets ... 17
1. Broader Market Drop and Recovery... 17
2. Securities that Suffered Declines Disproportionate to the Broader Market ... 29
B. Futures Markets... 59
1. Background... 59
2. Role of Liquidity in Markets... 63
3. Analysis of Large Traders... 66
4. Preliminary Findings... 69
C. Clearance and Settlement... 69
1. Securities Markets... 69
2. Futures Markets ... 70
V. NEXT STEPS...72
A. Areas for Further Analysis ... 72
1. Securities Markets... 72
2. Futures Markets ... 74
3. Coordinated Analysis... 74
B. Potential Regulatory Responses... 75
1. Securities Markets... 75
2. Futures Markets ... 79 APPENDIX A OVERVIEW OF THE SECURITIES MARKET STRUCTURE ...A1 APPENDIX B OVERVIEW OF THE FUTURES MARKET STRUCTURE ...B1 APPENDIX C CROSS-MARKET CIRCUIT BREAKERS...C-1 APPENDIX D FUTURES MARKET INFORMATION...D-1
I. INTRODUCTION
The Commodity Futures Trading Commission (“CFTC”) and the Securities and Exchange Commission (“SEC” and collectively, the “Commissions”) have established a Joint CFTC-SEC Advisory Committee on Emerging Regulatory Issues (the
“Committee”). The establishment of the Committee was one of 20 recommendations included in the agencies’ joint harmonization report issued last year.1
The first item on the agenda of the Committee will be to conduct a review of the market events of May 6 and to make recommendations related to market structure and liquidity issues that may have contributed to the volatility experienced on that day, as well as disparate trading conventions and rules across various markets.
This report to the Committee reflects the preliminary findings of the
Commissions’ respective staffs resulting from their ongoing review of the events of May 6. The report is intended to brief the Committee regarding the May 6 events and to provide certain context regarding the current structure of the equity and futures markets and the regulatory framework for those markets.
This report includes: (a) an executive summary; (b) an overview providing general market context with respect to the events of May 6; (c) preliminary findings with respect to those events; and (d) areas for further analysis and initial next steps. In
addition, this report contains several appendices providing relevant background regarding the market structure of the securities and futures markets.
It is important to emphasize that the review of the events of May 6 is in its preliminary stages and is ongoing. The reconstruction of even a few hours of trading during an extremely active trading day in markets as broad and complex as ours— involving thousands of products, millions of trades and hundreds of millions of data points—is an enormous undertaking. Although trading now occurs in microseconds, the framework and processes for creating, formatting, and collecting data across various types of market participants, products and trading venues is neither standardized nor fully automated. Once collected, this data must be carefully validated and analyzed. Such further data and analysis may substantially alter the preliminary findings presented in this report. The staffs of the Commissions therefore expect to supplement this report with further additional findings and analyses.
Joint Report of the SEC and the CFTC on Harmonization of Regulation, October 16, 2009.
II. EXECUTIVE SUMMARY
On May 6, 2010, the financial markets experienced a brief but severe drop in prices, falling more than 5% in a matter of minutes, only to recover a short time later. Since that day, the staffs of the Securities and Exchange Commission and the Commodity Futures Trading Commission have been collecting and reviewing massive amounts of information in order to understand the events and to recommend appropriate measures. SECURITIES MARKETS
Preliminary Findings
May 6 started with unsettling political and economic news from overseas concerning the European debt crisis that led to growing uncertainty in the financial markets. Increased uncertainty during the day is corroborated by various market data: high volatility; a flight to quality among investors; and the increase in premiums for buying protection against default by the Greek government. This led to a significant, but not extraordinary, down day in early trading for the securities and futures markets.
Beginning shortly after 2:30 p.m.,2 however, this overall decline in the financial markets suddenly accelerated. Within a matter of a few minutes, there was an additional decline of more than five percent in both the equity and futures markets. This rapid decline was followed by a similarly rapid recovery. This extreme volatility in the markets suggests the occurrence of a temporary breakdown in the supply of liquidity across the markets.
The decline and rebound of prices in major market indexes and individual securities on May 6 was unprecedented in its speed and scope. The whipsawing prices resulted in investors selling at losses during the decline and undermined confidence in the markets. Although evidence concerning the behavior of the financial markets on May 6, 2010 continues to be collected and reviewed, a preliminary picture is beginning to emerge.
At this point, we are focusing on the following working hypotheses and findings– (1) possible linkage between the precipitous decline in the prices of stock
index products such as index ETFs and the E-mini S&P 500 futures, on the one hand, and simultaneous and subsequent waves of selling in individual securities, on the other, and the extent to which activity in one market may have led the others;
(2) a generalized severe mismatch in liquidity, as evinced by sharply lower trading prices and possibly exacerbated by the withdrawal of liquidity by
All times in this report are EDT.
electronic market makers and the use of market orders, including automated stop-loss market orders designed to protect gains in recent market advances;
(3) the extent to which the liquidity mismatch may have been exacerbated by disparate trading conventions among various exchanges, whereby trading was slowed in one venue, while continuing as normal in another;
(4) the need to examine the use of “stub quotes”, which are designed to technically meet a requirement to provide a “two sided quote” but are at such low or high prices that they are not intended to be executed;
(5) the use of market orders, stop loss market orders and stop loss limit orders that, when coupled with sharp declines in prices, for both equity and futures markets, might have contributed to market instability and a temporary breakdown in orderly trading; and
(6) the impact on Exchange Traded Funds (ETFs), which suffered a disproportionate number of broken trades relative to other securities. We have found no evidence that these events were triggered by “fat finger” errors, computer hacking, or terrorist activity, although we cannot completely rule out these possibilities.
Key Avenues for Further Investigation
Much work is needed to determine all of the causes of the market disruption on May 6. At this stage, however, there are a number of key themes that we are
investigating.
Futures and Cash Market Linkages. The first relates to the linkages between trading in equity index products, including stock index futures and the equity markets. About 250 executing firms processed transactions for thousands of accounts during the hour 2:00 p.m. – 3:00 p.m. in the E-Mini S&P 500 futures contract. Of these accounts, CFTC staff has more closely focused their examination to date on the top ten largest longs and top ten shorts. The vast majority of these traders traded on both sides of the market, meaning they both bought and sold during that period. One of these accounts was using the E-Mini S&P 500 contract to hedge and only entered orders to sell. That trader entered the market at around 2:32 and finished trading by around 2:51. The trader had a short futures position that represented on average nine percent of the volume traded during that period. The trader sold on the way down and continued to do so even as the price level recovered. This trader and others have executed hedging strategies of similar size previously.3
Statement of Gary Gensler, Chairman, Commodity Futures Trading Commission, Before the House of Representatives Committee on Financial Services, Subcommittee on Capital Markets, Insurance, and Government Sponsored Enterprises, May 11, 2010, at 8. Except as specifically
Data from the CME order book indicates that, although trading volume in E-mini S&P 500 futures was very high on May 6, there were many more sell orders than there were buy orders from 2:30 p.m. to 2:45 p.m. The data also indicate that the bid ask spread widened significantly at or about 2:45 p.m. and that certain active traders partially withdrew from the market. Considerable selling pressure at this vulnerable period in time may have contributed to declining prices in the E-Mini S&P 500 – and other equivalent products such as the SPY (an ETF that tracks the S&P 500).
All of these markets are closely linked by a complex web of traders and trading strategies. The precipitous decline in price in one market on May 6 may have influenced a sustained series of selling in other financial markets. The rapid rebound in price in one market could similarly have been linked to a rebound in price in another.
Implications for the Equity Markets. The great majority of securities
experienced declines that are generally consistent with the decline in value of the large indexes. Some were less than the approximately 5% decline in the E-mini S&P 500 during that period, and some were greater. Approximately 86% of securities, however, reached lows for the day that were less than 10% away from the 2:40 p.m. price.
The other 14% of securities suffered greater declines than the broader market, with some trading all the way down to one penny. The experience of these securities exposed potential weaknesses in the structure of the securities markets that must be addressed.
One hypothesis as to why the prices of some securities declined by abnormally large amounts on May 6 is that they were affected by disparate practices among securities exchanges. In the U.S. securities market structure, many different trading venues,
including multiple exchanges, alternative trading systems and broker-dealers all trade the same stocks simultaneously. Disparate practices potentially could have hampered
linkages among these trading venues and led to fragmented trading in some securities. Two types of disparate practices on May 6 relate to the NYSE’s liquidity replenishment points (“LRPs”) and the self-help remedy in Regulation NMS. These and other practices merit significant ongoing review:
● LRPs and Similar Practices. The NYSE’s trading system incorporates LRPs
that are intended to dampen volatility. When an LRP is triggered, trading on the NYSE will “go slow” and pause for a time to allow additional liquidity to enter the market. Some have suggested that LRPs actually exacerbated, rather than dampened, price volatility on May 6 by causing a net loss of liquidity, as orders were routed to other trading venues for immediate execution rather than waiting on the LRP mechanism. If this occurred, it potentially could have caused some NYSE securities to decline further than the broad market decline. However, others believe that the LRP mechanism indeed dampened authorized, Section 8 of the Commodity Exchange Act generally forbids disclosure of additional information regarding such traders.
volatility by rebuilding additional buy side liquidity that soaked up some of the excess selling interest in these securities on May 6. LRPs and other types of exchange procedures for handling or executing orders will be closely examined to determine whether they inappropriately impede liquidity.
● Self-Help Remedy. Another disparate exchange practice potentially relevant to the thinning of liquidity is the self-help remedy. Two exchanges declared self-help against NYSE Arca in the minutes prior to 2:40 p.m. Exchanges are entitled to exercise the self-help remedy when another exchange repeatedly fails to provide a response to incoming orders within one second. A
declaration of self-help frees the declaring exchanges from their obligation to route orders to the affected exchange. Some have suggested the exercise of self-help led to a net loss of liquidity as the declaring exchanges stopped routing orders to NYSE Arca.
● Stop Loss Market Orders. An additional hypothesis as to why some securities
suffered more severe declines than the broader market on May 6 is that they were particularly affected by stop loss market orders. These orders have stop prices that, for sell orders, are lower than current prices. When the stop price is reached, such orders turn into market orders to sell. In fast-falling market conditions, stop loss market orders could potentially trigger a chain reaction of automated selling if they are in place in significant quantity for a particular stock. We are investigating whether such a chain reaction led to abnormally large declines for some stocks on May 6.
• Short Sales and Stub Quotes. We also are examining the use of short sales
and stub quotes on May 6. Our analysis thus far of broken trades has found that short sales accounted for approximately 70 % of executions against stub quotes between 2:45 p.m. and 2:50 p.m., and approximately 90 % of
executions against stub quotes between 2:50 p.m. and 2:55 p.m. Notably, short sale executions against stub quotes would be subject to the alternative uptick rule (Rule 201) adopted by the SEC in February 2010, with a
compliance date in November 2010.
In addition, we will evaluate the use of stub quotes by market makers. As noted above, stub quotes are not intended to be executed and effectively indicate that the market maker has pulled out of the market. Their presence at the bottom and top of order books on May 6 may have led to a very large number of broken trades. We will examine the extent to which market makers used stub quotes to nominally meet their market making obligations on May 6.
Exchange-Traded Funds. Of the U.S.-listed securities with declines of 60% or more away from the 2:40 p.m. transaction prices, which resulted in their trades being cancelled by the exchanges, approximately 70% were ETFs. This suggests that ETFs as a class were affected more than any other category of securities.
Based on our analysis to date, we are focused on a number of issues that may have contributed to the ETFs’ experience, including:
• Because ETFs generally track securities market indices, the extraordinary
price declines in certain individual securities likely contributed to the ETF price declines. For the most part, the severe ETF price declines followed, in time, the sharp decline in the broad markets. ETFs that track bond indices generally did not experience severe price declines. We therefore are
considering the linkages between ETF price declines and the declines in the equity market.
• The role of market makers and authorized participants in ETFs, and whether
an inability to hedge their ETF positions during periods of severe volatility may have contributed to a lack of liquidity in ETF shares.
• The use of ETFs by institutional investors as a way to quickly acquire (or
eliminate) broad market exposures and whether this investment strategy led to substantial selling pressure on ETFs as the market began to decline
significantly.
• The impact of ETF stop loss market orders, particularly from retail investors,
on the overall ETF market price declines.
• Given that NYSE Arca is the primary listing exchange for almost all ETFs,
whether the declaration of “self-help” against NYSE Arca by other exchanges may have impacted NYSE Arca-listed stocks generally and ETFs in
particular. The loss of access to NYSE Arca’s liquidity pool may have had a greater impact on market liquidity and trading for ETFs.
FUTURES MARKETS Preliminary Findings
Economic evidence from the futures markets is also consistent with the conclusion that a liquidity drain likely played a role in the dramatic and sudden movements in the price of stock index futures.
As noted above, preliminary data indicates that, although trading volume in E-mini S&P 500 futures was very high on May 6, there were many more sell orders than there were buy orders from 2:30 p.m. to 2:45 p.m. The data also indicate that the bid ask spread widened significantly at or about 2:45 p.m. and that certain active traders partially withdrew from the market.
Starting at 2:45:28 p.m., CME’s Globex stop logic functionality initiated a brief pause in trading in the E-mini S&P 500 futures. This functionality is initiated when the
last transaction price would have triggered a series of stop loss orders that, if executed, would have resulted in a cascade in prices outside a predetermined ‘no bust’ range (6 points in either direction in the case of the E-mini). The purpose of this functionality is to prevent sudden, cascading declines (or increases) in price caused by order book
imbalances.
The stop logic functionality has been activated previously for a variety of instruments. In the case of the E-mini S&P 500 futures, the stop logic functionality has been triggered a number of times in the past few years, including several times during the financial crisis in the Fall of 2008, when market data indicates similar conditions as those seen on May 6.
On May 6, activation of the stop logic functionality initiated a five second pause in trading on the E-mini S&P 500 futures contract. The price of the E-mini S&P 500 futures rebounded after the five second pause imposed by the stop logic functionality.
Staff analysis of market performance measures is consistent with the conclusion that a very temporary, but serious liquidity shortage occurred across the securities and futures markets.
NEXT STEPS Securities Markets
SEC staff will continue our ongoing investigation of the nature of the overall market liquidity dislocation and the impact on individual stocks. Where appropriate we are moving quickly to prevent a recurrence of the harm that investors suffered on May 6.
• We anticipate that the self-regulatory organizations (exchanges and FINRA) will
propose circuit breakers for individual stocks that are designed to address
temporary liquidity dislocation. Specifically, a pause in trading should provide an opportunity for all available sources of liquidity (both manual and automated) to be mobilized to meet sudden surges in demand for liquidity.
• The procedures for breaking trades that occur at off-market prices should be
improved to provide investors greater consistency, transparency and predictability.
• We are also continuing to review a range of other policy options, including
addressing the use of stub quotes, reviewing the obligations of professional liquidity providers and evaluating the use of various order types (market orders, stop loss orders).
Futures Markets
CFTC staff will continue its analysis into the events of May 6. Specifically, CFTC staff is carefully reviewing the activity of the largest traders in stock index futures.
CFTC staff will also continue its analysis, already begun by our Office of Chief Economist, of liquidity provision in futures markets, with a particular focus on electronic trading. The subjects to be reviewed here include high frequency and algorithmic
trading, automatic execution innovations on trading platforms, market access issues, and co-location.
CFTC staff is considering a proposed rulemaking with respect to exchange co-location and proximity hosting services. The purpose of the proposed rule would be to ensure that all otherwise qualified and eligible market participants that seek co-location or proximity hosting services offered by futures exchanges have equal access to such services without barriers that exclude access, or that bar otherwise qualified third-party vendors from providing co-location and/or proximity hosting services. Another purpose of the proposal would be to ensure that futures exchanges that offer co-location or proximity hosting services disclose publically the latencies for each available connectivity option, so that participants can make informed decisions.
CFTC staff will also be considering possible rules to enhance the CFTC’s surveillance capabilities. These measures include automation of the statement of reporting traders in the large trader reporting system and obtaining account ownership and control information in the exchange trade registers.4 These initiatives would increase the timeliness and efficiency of account identification, an essential step in data analysis. Joint Actions
• Staff also intends to pursue a joint study to examine the linkages between
correlated assets in the equities (single stocks, mutual funds and ETFs), options and futures markets. The study could partly focus on examining cross-market linkages by analyzing trading in stock index products such as equity index futures, ETFs, equity index options, and equity index OTC derivatives using, to the extent practicable, market data, special call information, and order book data.
• Existing cross-market circuit breaker provisions should be re-examined to ensure
they continue to be effective in today’s fast paced electronic trading environment. Although the coordinated circuit breakers between futures and equities were not triggered, the events of May 6 reinforce the importance of having communication links between futures and equity markets so that there is meaningful and
appropriate coordination of trading pauses and halts.
17 CFR 18.04.
PROCESS OF ANALYSIS
Over the last ten days, the SEC and the CFTC have collected and analyzed a wide range of data from many different sources in order to prepare this preliminary report. Specifically:
• The SEC has sourced and analyzed price, time, and volume data on over 19
billion shares executed on May 6, and quote data representing the best bid and best offer for over 7,800 securities, for each exchange, for each millisecond during the trading day. Our goal is to gather data necessary to create a complete order book showing snap-shots of the full displayable depth on a particular market and audit trail data containing detailed information on all orders submitted.
o Analysis of the complete order book is necessary to examine how changes
in the provision of liquidity below the best bid, and above the best offer, led to rapid changes in execution prices, with some trades hitting high and low “stub quotes.”
o Analysis of order audit trail data is necessary to examine what types of
orders were driving these price swings (e.g., market, limit, etc).
o The audit trail contains information on introducing brokers but does not
include details regarding the trading activity of specific market
participants. Currently, such data is only available directly from broker-dealers through “blue sheet” requests. Furthermore, even in this data participants are identified only in the way that they are known to the broker-dealer, as there are currently no uniform standards5
o The order book and order audit trail are maintained at exchanges, FINRA,
broker-dealers and other market centers. In some cases this information must be collected by the SROs, and then must be compiled and organized by the SEC. Every exchange has established its own requirements for what constitutes an audit trail, including what items are captured, how they are named, and the structure of the data file.
• The SEC has sourced and analyzed aggregate data on the volume and type of
liquidity, provided and taken, by the largest liquidity providers and takers on various exchanges.
• The SEC has worked extensively with the relevant securities exchanges and
FINRA to assess the circumstances of the market events on May 6. In addition, the SEC is analyzing detailed data for all NYSE LRPs occurring on May 6th, as well as over the last 5 months.
• CFTC staff has analyzed transaction and order book data on stock index futures,
including the E-Mini S&P 500 futures contract.
For example, the same market participant may be known to different broker-dealers by different names making the aggregation of orders for a single participant very difficult. For further details, see the SEC’s recent proposal for the Large Trader Reporting System.
• CFTC staff has been reviewing information from a special call on over 40 large
traders for their trading activity in the E-mini S&P 500 and Russell 2000 futures contracts on May 6, 2010. A special call is a CFTC directive to a trader holding a reportable position to furnish any pertinent information concerning the trader’s positions, transactions, or activities.
• CFTC staff also has been reviewing information from a special call to swap
dealers about their activity in over-the-counter broad-based security index derivatives markets on May 6, 2010. In addition, staff has been engaged in a detailed review of trader activity on May 6 through a comprehensive examination of trade-register data. To date, staff has received over 25 gigabytes of data in over 307,000 files, with more data expected.
Both the CFTC and the SEC have had extensive conversations with a wide variety of market participants (investors, hedge funds, exchange traded funds, dealers, high frequency traders, etc.) to better understand their trading activities throughout May 6, and to gather anecdotal evidence from which common themes and/or trends can be identified to inform further areas of investigation.
III. GENERAL MARKET CONTEXT
This section provides general market context for the trading activity on May 6. Throughout the day on Thursday, May 6, many financial news outlets were reporting on political and economic events that were creating uncertainty in the financial markets. This increased uncertainty during that day is evidenced by patterns observable in financial market data. There is evidence of increasing volatility throughout the day, a “flight to quality”6 (as seen in the rise in the price of gold and decline in U.S. Treasury yields), an increase in the price of premiums on credit default swaps to protect against the risk of default on European sovereign debt, and downward pressure on the Euro in global currency markets. All major broad-based equity indices and equity index futures spent much of the morning and early afternoon in negative territory (see chart below). For example, between 9:30 a.m. and 2:00 p.m., the Dow Jones Industrial Average (DJIA) declined 161 points to 10,712 (-1.5%), the S&P 500 Index declined 33 points to 1,145 (-2.9%), and the E-mini S&P 500 Index June futures declined 15 points to 1,143 (-1.3%).
Figure1:SelectEquityIndicesandEquityIndexFutures,May6,2010
Source:Bloomberg
Flight to Quality is a term used to describe the movement of capital into asset classes that are perceived to be less risky during times of financial uncertainty.
Indicators of Market Uncertainty
Market Volatility
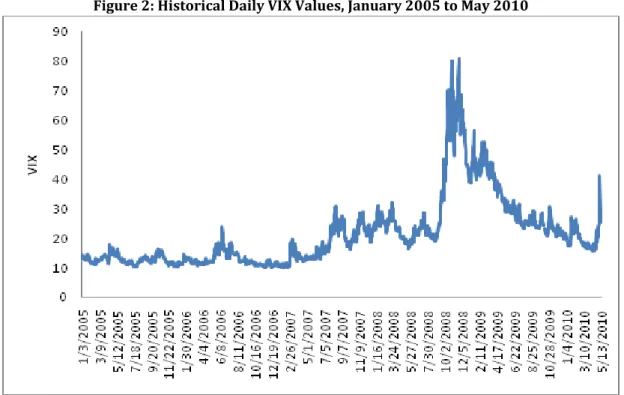
A general indicator of market uncertainty is the Chicago Board Options Exchange SPX Volatility Index (“VIX”). The VIX is a measure of the expected volatility of the S&P 500 index, based on options prices, and is sometimes colloquially referred to as the “fear index.” The VIX provides a picture of the expected range of S&P 500 index returns in the next 30 days. Higher values of the VIX imply a greater range of returns, both positive and negative. Thus, increases in the VIX signal increased uncertainty about possible stock returns.
As seen in Figure 2, in 2010 the VIX prior to May 6 has averaged 19.58, a level that indicates much lower expected market volatility when compared to the VIX averages of 2008 (32.69) and 2009 (31.48). The elevated VIX levels from 2008 and 2009 were associated with a broader financial market crisis. Since then, the average level of the VIX has returned to levels that are consistent with the pre-2008 period. For example, in April the VIX averaged 17.42. For the month of May through May 14 the VIX has averaged28.33.
Figure2:HistoricalDailyVIXValues,January2005toMay2010
Source:Bloomberg
On May 6, the VIX opened at 25.88. This represents a 15.5% increase from when the trading week began on Monday, May 3 at 22.41. After staying level for most of the day, the VIX began to rise around 1:30 p.m. At 2:00 p.m. the VIX had increased 2.72 points or 10.5% from its opening level, signaling increasing expected volatility in the
S&P 500 Index. Over the next half-hour, the VIX steadily increased an additional 3.11 points to 31.71, up 22.5% from the open. A nearly continuous rise in the VIX signals higher levels of expected market risk and uncertainty going forward. The increase in the VIX then accelerated and the index reached 40.26 by 2:46 p.m. Had markets closed at the 2:46 p.m. level of 40.26, it would have represented a 61.6% increase from the
previous day’s close and would represent the fourth largest single-day increase in market volatility. Ultimately, the VIX closed at 32.80, a 31.7% increase from the previous day’s close.7
Figure3:CBOESPXVolatilityIndexIntradayLevels
Source: Bloomberg Flight to Quality
Gold and U.S. Treasuries are assets that have historically been in high demand during periods of market uncertainty. On May 6, the COMEX nearby gold futures contract rose steadily from approximately $1,180 to $1,210 per troy ounce from the market open to its close at 1:30 p.m. Additionally, the ten-year Treasury yield fell from 3.58% on May 5 to an intraday low of 3.26% before settling at 3.41% (see Figure 4).
The three highest single-day increases in the VIX are 10/19/87 (312.95%), 10/13/89 (68.30%), and 2/27/07 (64.22%).
Figure4:TenYearU.S.TreasuryNoteYield
Source:Bloomberg Credit Default Swaps
The credit derivatives markets indicated increased uncertainty over the ability of the government of Greece to service its debt. Spreads on CDS protecting against the default of debt securities issued by Greece widened on May 6 to 937.9 basis points, up from 844.2 basis points the previous day.8 This essentially meant that the price of premiums to protect against a default by Greece had increased. This widening coincided with the European Central Bank’s press conference, beginning at 8:30a.m., in which the Bank did not address the possibility of purchasing Greek government bonds. Figure 5 shows CDS spreads on Greek sovereign debt over the past five years.
A CDS spread widening means that it will cost more for a company to insure against default, because the market sees default as more likely than it previously did. In other words, someone who wants to buy protection on a risk of default of a debt has to pay a higher premium.
Figure5:CreditDefaultSpreadsonGreekSovereignDebt
Source:Bloomberg Euro Declines Against the Dollar and Yen
In addition, global currency markets were indicating concern over the financial stability of the European Union. Shortly after 1:00 p.m., the Euro began a sharp decline against both the U.S. Dollar and the Japanese Yen (see Figure 6).
Figure6:EuroDollarandEuroYenExchangeRatesonMay6,2010
Source:Bloomberg Events During the Afternoon of May 6
By approximately 2:45 p.m. over 200 securities had fallen 50% or more from their 2:00 p.m. levels. Between 2:45 p.m. and 2:47p.m., the DJIA, S&P 500, and
NASDAQ100 all reached daily lows. During this same period, all 30 DJIA components reached their intraday minima, representing a range from -4% to -36% from their opening levels. The DJIA bottomed at 9,872.57, the S&P 500 at 1,065.79, and the NASDAQ100 at 1,752.31. The E-mini S&P 500 index futures contract bottomed at 1,056.
After bottoming, equity and equity index futures markets began to rebound. At 2:50 p.m. the DJIA was trading at 10,232 and the E-mini S&P 500 was trading at 1,096. The E-mini S&P 500 climbed further to 1,118 by 2:53 p.m. The DJIA closed at
10,520.32, down 347.68 points, or 3.2%, from the prior day’s close. The E-mini S&P 500 settled at 1,122.5, down 41.5 points, or 3.6%, from the prior day’s settlement.
IV. PRELIMINARY FINDINGS A. Securities Markets
The market events of May 6, 2010 included a surge in trading in the stock markets, with total trading volume on that day of 19.4 billion shares, approximately 2.2 times the average daily trading volume in the 4th quarter of 2009. The trading volume in NYSE-listed stocks across all trading venues on May 6 represented the second highest daily volume on record, while May 6 volume in NASDAQ-listed stocks across all trading venues was the highest on record.
The severe price decline and recovery that occurred during a period of
approximately 20 minutes on the afternoon of May 6 can usefully be described in terms of two broad but related themes: (1) a precipitous drop in value of more than 5% followed immediately by a rapid recovery, both of which occurred consistently across various broad market indices and products; and (2) extreme price fluctuations – mostly losses – that occurred for certain individual securities, followed relatively promptly by reversions to price levels consistent with the broader market. These two themes are discussed below.
1. Broader Market Drop and Recovery
On May 6, a wide variety of broad market indices and products displayed similar behavior – a severe price decline immediately followed by a rapid recovery during a 20-minute period. This phenomenon is illustrated by the following price chart of the DJIA, the S&P 500 Index, and the E-mini S&P 500 futures (Figure 7).
Until approximately 2:40 p.m., the figure reflects a significant, but not
extraordinary, down day that was influenced by multiple negative economic factors, as noted in the previous section. At approximately 2:40 p.m., however, prices declined with extraordinary velocity. Each of the indices fell in excess of 5% within 5 minutes, and then immediately began a recovery that exceeded 5% within 10 minutes.
Most individual stocks declined by amounts that were generally consistent with the broader market decline. Approximately 86% of U.S.-listed securities reached lows for the day that were less than 10% away from the 2:40 p.m. price (a useful benchmark for the market price before the rapid market decline and recovery). The remaining 14% of U.S.-listed securities reached lows that exceeded 10% (these securities are discussed in greater detail in section IV.A.2 below).
Figure8: DistributionofMay6DailyLows9
0 10 0 20 0 30 0 40 0 50 0 60 0
-100 %
-95% -90% -85% -80% -75% -70% -65% -60% -55% -50% -45% -40% -35% -30% -25% -20% -15% -10% -5% 0%
Return from May 5 Close to May 6 Low
Nu
m
b
er
o
f I
s
su
es
Market Cap over $5 Billion
Market Cap between $500 Million and $5 Billion Market Cap between $10 and $500 Million
Sources: Thomson Financial Datastream and NYSE Trades and Quotes.
This figure depicts the distribution of returns from the close on May 5 to the lowest transaction price on May 6. The securities included are equity securities (common and preferred) of corporate issuers, exchange-traded products, closed-end funds, and ADRs, traded on major U.S. exchanges, and having in each case, as of the May 5 close, a share price of more than $3.00 and a market capitalization of at least $10 million.
Figure 8 illustrates in more detail the behavior of these two groups of individual securities. It shows that, for the day, there is a concentration of daily lows at a point near 7% below the May 5 close, on the right-hand side of the graph. The distribution of lows for individual securities around this point is consistent with a day where the ETF that tracks the S&P 500 Index transacted 8.5% below the previous day’s close. The figure notably also shows that some securities exhibited substantially more pronounced daily lows than the decline in the broad market would imply. In particular, approximately 200 securities traded, at their lows, almost 100% below their previous day’s values, as represented by the spike at the left-hand side of the graph. The incidence of extreme daily lows for large capitalization stocks (depicted on the graph in yellow) appears to be lower than for smaller capitalization stocks (depicted in the graph in purple).
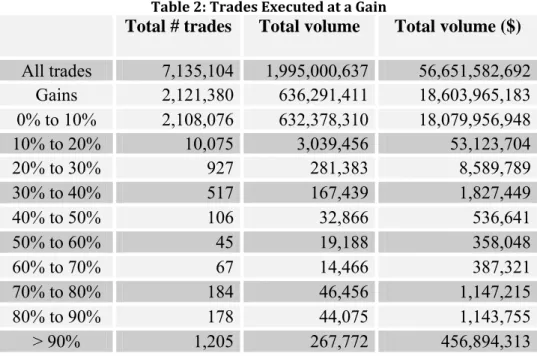
An examination of individual trades during the 2:40 p.m. - 3:00 p.m. period reveals a similar pattern. Table 1 and Table 2 below report the total number of trades, the total share volume and total dollar volume for trades executed between 2:40 p.m. and 3:00 p.m., for losses and gains, respectively. The losses/gains are computed as the
difference between the trade price and the 2:40 p.m. price, divided by the 2:40 p.m. price, for each stock. The data do not include out-of-sequence trades.10 Table 1 indicates that most investors that sold during this period transacted at prices that were within -10% away from the 2:40 p.m. price. Approximately 4.9 million, or 98%, of the trades that were executed during this period at prices less than the 2:40 p.m. price were within -10% of the 2:40 p.m. price. Approximately 102,000 trades were executed during the decline and recovery at prices that were -10% or more away from the 2:40 p.m. price; these trades are discussed in section IV.A.2 below. We see a similar pattern in Dow stocks. Four out of 30 (about 13%) had returns that were less (more negative) than -10%. Table 3 indicates the lowest trade price executed for each of the Dow Jones Industrial Average component stocks and the return computed against the stock’s 2:40 p.m. trade price. Of these stocks, four, Proctor& Gamble (PG), 3M (MMM), Hewlett-Packard (HPQ), and General Electric (GE), traded at a loss of over 10%, relative to the 2:40 p.m. price.
An “out-of-sequence” trade occurs when the TAQ data identifies the posted trade time as incorrect. In this case, the actual time at which the trade was placed is unknown.
Table1:TradesExecutedataLoss
Total # Total volume Total volume ($) trades
All trades 7,135,104 1,995,000,637 56,651,582,692
Losses
0% to -10% 4,912,125 1,324,448,213 37,383,122,363
-10% to -20% 63,890 22,171,745 522,444,343
-20% to 30% 12,923 4,077,881 85,328,519
-30% to -40% 6,112 2,317,245 30,461,333
-40% to -50% 2,519 767,393 9,641,261
-50% to -60% 1,682 472,624 8,334,944
-60% to -70% 1,056 370,920 4,328,898
-70% to -80% 798 292,061 2,245,851
-80% to -90% 1,109 237,259 1,152,480
-90% to -100% 11,510 3,553,885 557,516
5,013,724 1,358,709,226 38,047,617,508
Table2:TradesExecutedataGain
Total # trades Total volume Total volume ($)
All trades 7,135,104 1,995,000,637 56,651,582,692
Gains 2,121,380 636,291,411 18,603,965,183
0% to 10% 2,108,076 632,378,310 18,079,956,948
10% to 20% 10,075 3,039,456 53,123,704
20% to 30% 927 281,383 8,589,789
30% to 40% 517 167,439 1,827,449
40% to 50% 106 32,866 536,641
60% to 70% 67 14,466 387,321
80% to 90% 178 44,075 1,143,755
50% to 60% 45 19,188 358,048
70% to 80% 184 46,456 1,147,215
Table3:MaximumTradeLossforDow30Stocks
Company Return Low Price Time
The Proctor& Gamble Company -36.14% $39.37 2:47:15 PM
3M Company -18.39% $67.98 2:46:06 PM
Hewlett-Packard Company -11.81% $41.94 2:46:13 PM
General Electric Company -10.23% $15.00 2:46:11 PM
Merck & Company Incorporated -9.23% $30.70 2:46:11 PM
Exxon Mobil Corporation -8.74% $58.46 2:46:52 PM
E.I. Du Pont De Nemours -8.13% $33.66 2:46:29 PM
Cisco Systems Incorporated -7.52% $23.23 2:45:33 PM
The Walt Disney Company -7.49% $31.00 2:45:45 PM
United Technologies Corporation -7.42% $65.17 2:46:38 PM
International Business Machines Corporation -7.20% $116.00 2:46:33 PM
Chevron Corporation -7.18% $71.50 2:47:03 PM
Intel Corporation -6.09% $19.90 2:47:30 PM
The Boeing Company -5.89% $62.00 2:45:42 PM
Verizon Communications -5.73% $26.49 2:45:48 PM
Johnson & Johnson -5.70% $60.03 2:46:10 PM
Kraft Foods Incorporated -5.21% $27.49 2:47:59 PM
Home Depot Incorporated -5.06% $32.07 2:45:57 PM
Pfizer Incorporated -4.64% $15.85 2:46:06 PM
Caterpillar Incorporated -4.50% $58.00 2:45:33 PM
American Express Company -4.47% $40.16 2:45:52 PM
Alcoa Incorporated -4.34% $11.25 2:47:35 PM
Microsoft Corporation -4.16% $27.91 2:46:39 PM
AT&T Incorporated -3.88% $24.04 2:46:04 PM
Wal-Mart Stores Incorporated -3.74% $51.53 2:45:29 PM
Bank of America Corporation -3.55% $15.50 2:46:36 PM
The Coca Cola Company -3.47% $51.21 2:47:23 PM
McDonalds Corporation -3.43% $67.49 2:47:53 PM
JP Morgan Chase & Company -2.51% $39.29 2:45:45 PM
The Travelers Companies Incorporated -2.31% $48.53 2:45:46 PM Both aspects of the 20-minute phenomenon—the effects on the broad market and the even more extreme effects on a minority of securities—warrant serious analysis, given the potential harm to investor confidence and the realized losses of investors. Although the state of our fact-gathering makes any analysis at this time too preliminary to draw firm conclusions—or even many tentative ones—about how and why the events of May 6 occurred, the facts we have and the analysis we have completed thus far do offer a few clues to the origins of the May 6 event.
We are in the process of obtaining and reviewing the order book and the data necessary to reconstruct the order audit trail for the various equity exchanges and electronic communications networks (“ECNs”) in the hope of being able to determine whether order book liquidity substantially thinned immediately prior to 2:40 p.m. For example, based on some preliminary data, there may be reason to believe that there may have been a thinning of order book liquidity at one significant exchange at around 2:00 p.m.
The temporary nature of the decline in prices in the broader market may be indicative of a failure in liquidity. As we will show, many individual securities exhibited more extreme temporary price movements than the broad market, consistent with a broader set of liquidity failures. The discussion that follows focuses on a key issue on May 6 – the interaction between liquidity demand and supply. A temporary price dislocation could be caused by an unusually high demand for liquidity, by an unusually weak supply of liquidity, or by some combination of these factors. Our preliminary analysis indicates that both of these factors may be at play. In this section, we focus on questions that bear on this central issue.
NYSE’s trading system incorporates LRPs that are intended to dampen volatility in a given stock by temporarily converting from an automated market to a manual auction market when a price movement of a sufficient size is reached. In such case, trading on the NYSE will “go slow” and pause for a time period to allow an opportunity for additional liquidity to enter the market. During an LRP, the NYSE will display a
quotation that is not immediately accessible and can be bypassed, but is not required to be bypassed, by other trading venues and order routers.
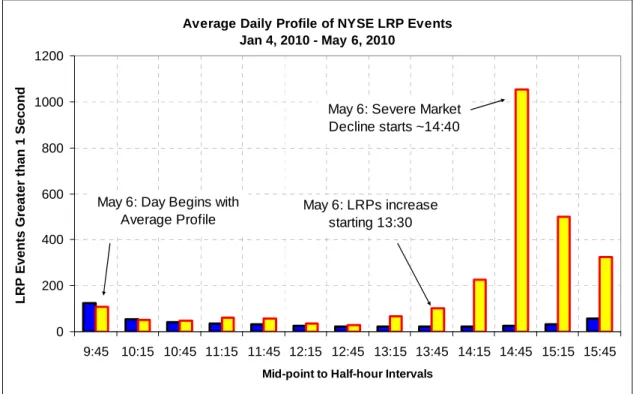
Figure 9 compares the May 6 LRP profile on the NYSE with the average profile of such events during 2010. The figure indicates the number of securities that triggered an LRP event lasting more than 1 second during any given 30-minute period. The blue blocks, reported first in the series, represent the average number of securities meeting this criterion from January 4, 2010 through May 6, 2010. The yellow blocks, reported second in the series, represent the LRP events on May 6, 2010 itself.
Figure 9 shows a substantial increase in the number of securities with LRPs on the NYSE starting in the period from 1:00 p.m. to 1:30 p.m. and rising to more than 200 in the period from 2:00 p.m. to 2:30 p.m. Between 2:30 and 3:00 pm, the level rose to approximately 1,000. This significant rise in LRPs could be indicative of a thinning of order book liquidity at the NYSE.
Figure9: AverageDailyProfileofNYSELRPEvents
Average Daily Profile of NYSE LRP Events Jan 4, 2010 - May 6, 2010
0 200 400 600 800 1000 1200
9:45 10:15 10:45 11:15 11:45 12:15 12:45 13:15 13:45 14:15 14:45 15:15 15:45 Mid-point to Half-hour Intervals
L
R
P
Eve
nts Grea
te
r
than
1
S
eco
nd
May 6: LRPs increase starting 13:30 May 6: Severe Market Decline starts ~14:40
May 6: Day Begins with Average Profile
Source: NYSE
Finally, Figure 10 shows a scatter plot of the time and percentage decline for all securities that realized their daily low measured from May 5 close to their May 6 low during the period between 2:00 p.m. and 3:00 p.m. Each point on the plot represents one stock, the time of day it executed a trade at its lowest trade price of the day, and the return from the previous night’s close to that trade price. It shows a steady increase in the number of securities with daily lows throughout the hour.
14:
00:0
0 14:
05:0
0
14:1
0:00
14:1
5:00
14:20
:00
14:25
:00
14:30
:00
14:
35:0
0 14:
40:0
0
14:4
5:00
14:5
0:00
14:5
5:00
Figure 10:Timing of Daily Lows, May 6, 2:00pm to 3:00pm11
Re
tu
rn
(
%
)
20.00%
0.00%
-20.00%
-40.00%
-60.00%
-80.00%
-100.00%
-120.00%
Source: Thomson Financial Datastream and NYSE Trades and Quote
11
Figure 10 depicts the timing of daily lows during the one-hour period from 2:00 p.m. to 3:00 p.m. on May 6. Each point represents the return from the May 5 close to the lowest transaction price on May 6, plotted against the time at which the transaction occurred. Daily lows not occurring during this one-hour interval are not depicted. The figure includes all equity securities (common and preferred) of corporate issuers, exchange-traded products, closed-end funds, and ADRs, traded on major U.S. exchanges, with a share price of more than $3.00 and a market capitalization of at least $10 million as of the May 5 close.
Figure11: TimingofDailyHighs,May6,2:00p.m.to3:00p.m.12
-50. 00% 0. 00% 50. 00% 1 00. 00% 1 50. 00% 2 00. 00% 2 50. 00% 3 00. 00%
14:00 :00 14:05 :00 14:10 :00 14:15 :00 14:2 0:00 14:25 :00 14:3 0:00 14:3 5:00 14:40 :00 14:4 5:00 14:50 :00 14:55 :00 Re tu rn ( % )
Sources: Thomson Financial Datastream and NYSE Trades and Quote.
While a large number of securities experienced extreme low trades during the 2:00 p.m. to 3:00 p.m. interval, a smaller but still significant number of securities experienced extreme highs. Figure 11 indicates positive returns on May 6, excluding a few stocks for scaling reasons. The figure shows that a significant number of securities experienced daily highs more than 25% higher than their close on May 5. These extreme highs were concentrated after 2:44 p.m. Unlike the lows depicted in Figure 10, which began to occur in the early part of the hour, there appear to be no extreme highs occurring prior to 2:44 p.m.
Another factor potentially relevant to the thinning of liquidity is the declaration of self-help by NASDAQ against NYSE Arca at 2:37 p.m., and by NASDAQ OMX BX against NYSE Arca at 2:38 p.m. We have not yet evaluated the basis for the exercise of
Figure 11 depicts the timing of daily highs during the one-hour period from 2:00 p.m. to 3:00 p.m. on May 6. Each point represents the return from the May 5 close to the highest transaction price on May 6, plotted against the time at which the transaction occurred. Daily highs not occurring during this one-hour interval are not depicted. The figure includes all equity securities (common and preferred) of corporate issuers, exchange-traded products, closed-end funds, and ADRs, traded on major U.S. exchanges, with a share price of more than $3.00 and a market capitalization of at least $10 million as of the May 5 close. For scaling purposes, Figure 11 excludes returns to daily highs on a few equity securities of corporate issuers.
self-help against NYSE Arca. Under Regulation NMS, exchanges are entitled to exercise self-help when another exchange repeatedly fails to provide a response to incoming orders within one second. The direct effect of a declaration of self-help is that the declaring exchanges will no longer route orders to the affected exchange. We are not aware, however, that any broker-dealer or any other exchange declared self-help against NYSE Arca prior to the time the broad market indexes reached their daily lows.13
Consequently, the broker-dealers and other exchanges that wished to access NYSE Arca quotes would have been likely to route orders directly to NYSE Arca (and therefore would not have been affected by a self-help declaration), rather than trying to access those quotes indirectly through NASDAQ or NASDAQ OMX BX. Accordingly, we are evaluating the extent to which the declaration of self-help by the two exchanges against NYSE Arca prior to 2:40 p.m. could have caused a significant thinning of available liquidity.
Another interesting question remains as to whether electronic liquidity providers pulled back during the relevant timeframe. At approximately 2:40 p.m. on May 6, prices declined rapidly across many trading venues and products. The activities of electronic liquidity providers are important subjects for analysis. These proprietary trading firms have come to be the dominant type of liquidity provider in the U.S. equity markets. Consequently, we are analyzing their activities on May 6. As noted above, we are in the process of obtaining and reviewing the order book data of exchanges and ECNs. We have, in the meantime, obtained other data from the exchanges concerning the activity of their top ten liquidity providing firms from 2:00 p.m. to 3:00 p.m. We continue to analyze these data to assess the activity of these liquidity providing firms. Some initial findings based on these data are set forth in Figure 12 and Figure 13below.14
13 Two other exchanges – BATS and NSX – exercised self-help against NYSE Arca after this time.
14 All of the equity exchanges provided data on their liquidity providers. Each exchange was
requested to identify and provide data on the top ten overall liquidity providers (“Top Ten Providers”) on the exchange on May 6. For each of the Top Ten Providers, the exchange was requested to provide (1) the number of trades and share volume of liquidity provided on the exchange from 2:00 p.m. to 3:00 p.m., broken down in 30 second intervals, for all securities traded on the exchange in the aggregate; and (2) the number of trades and share volume of liquidity removed on the exchange from 2:00 p.m. to 3:00 p.m., broken down in 30 second intervals, for all securities traded on the exchange in the aggregate.
Figure12:LiquidityProvided/TakenbyTop10LiquidityProvidersAcrossAllEquityMarkets 2:00p.m. 3:00p.m.May6,201015
0 10,000,000 20,000,000 30,000,000 40,000,000 50,000,000 60,000,000 14: 00: 00 14: 05: 00 14: 10: 00 14: 15: 00 14: 20: 00 14: 25: 00 14: 30: 00 14: 35: 00 14: 40: 00 14: 45: 00 14: 50: 00 14: 55: 00 15: 00: 00
30-Second Period Ending
Vol u m e P rov id e d or Taken
Provided Taken
Source: All data was provided by the exchanges
The aggregate number of shares taken and provided by each of the top ten liquidity providers for each exchange reported in 30-second intervals.
Figure13:PercentofLiquidityProvided/TakenbyTop10LiquidityProvidersagainstTotal VolumeAcrossallEquityMarkets2:00p.m.–3:00p.m.May6,201016
0% 10% 20% 30% 40% 50% 60% 70% 80% 90% 100% 14: 00: 00 14: 05: 00 14: 10: 00 14: 15: 00 14: 20: 00 14: 25: 00 14: 30: 00 14: 35: 00 14: 40: 00 14: 45: 00 14: 50: 00 14: 55: 00 15: 00: 00
30-Second Period Ending
% Pr ov id ed or Taken 0 10 20 30 40 50 60 70 80 90 100 T o ta l V o lu m e (M M )
%-Provided %-Taken Total Volume
Sources: Liquidity data provided by the exchanges; total volume from NYSE Trades and Quotes. Figure 12 shows the share volume of aggregate liquidity provided and removed for all stocks by the top 10 firms for all of the exchanges between 2:00 p.m. and 2:59 p.m. Figure 13 shows the percentage of liquidity provided and removed against the total volume across all equity markets. Figure 12 and Figure 13 could indicate that,
collectively, these particular firms appear to have remained net liquidity providers throughout this period and that they increased their liquidity provision, both in terms of share volume and percentage of total volume, when total volume increased at
approximately 2:40 p.m. We note, however, that the underlying data provided by the exchanges as the source for these figures are also consistent with significant variations in the activities of different liquidity providers during this period. In addition, it should be noted that Figure 12 and Figure 13 represent only the number and percentage of shares of liquidity, and not the prices of the transactions which, of course, are important to a complete understanding of liquidity provider behavior. Anecdotal evidence, moreover, indicates that at least some large electronic liquidity providers and other liquidity providers did withdraw from the market during this time. We continue to analyze the conduct of these and other primary liquidity providing firms.
The percent provided and taken and provided by each of the top ten liquidity providers for each exchange reported in 30-second intervals.
2. Securities that Suffered Declines Disproportionate to the Broader Market
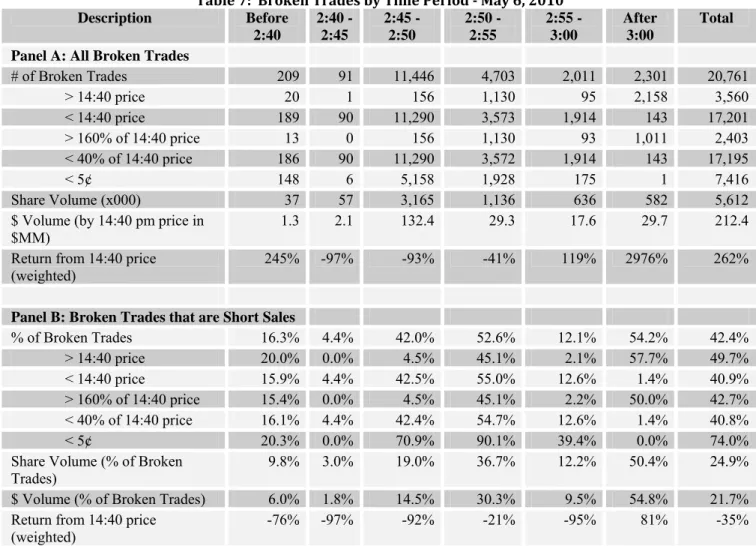
As noted above, the great majority of individual securities traded at prices that were consistent with the broader market decline during the day, while approximately 14% of U.S.-listed securities reached lows for the day that were more than 10% away from the 2:40 p.m. price. Table 1 and Figure 8 above show that a similar proportion of trades in securities hit lows for the day that were more than 10% from the previous day’s close.17 This section discusses the individual securities that suffered declines that are out of proportion to the broader market. We first focus on broken trades, including ETFs in particular. The actual dollar volume of these broken trades was of course small, due to artificially low share prices involved, but the shares involved in those trades would have been valued at $212.4 million, at their 2:40 p.m. benchmark price. (See Table 7 below). We then address securities that otherwise experienced unusually severe declines without reaching the threshold for broken trades.
a) Securities with Broken Trades
The securities exchanges and FINRA have adopted “clearly erroneous execution rules” that are designed to permit them to cancel trades that in their determination were clearly entered into in error.18 On May 6, under these rules, the SROs broke trades that were effected from 2:40 p.m. to 3:00 p.m. at prices 60%19 away from the last trade at or before 2:40 p.m. Table 4 below provides certain information regarding the securities in which trades were broken.20
A total of 7,878 securities were traded during this period. Trades were broken in 326 individual securities, consisting of those that experienced a very severe price move of 60% or greater from the 2:40 p.m.21 No trades were broken in any of the stocks that comprise the DJIA. Trades were broken in only 12 stocks that are included in the S&P 500 Index and in only 30 stocks included in the smaller capitalization Russell 2000
17 We use 10% as an estimated cutoff for stocks that declined by amounts consistent with the overall
market decline because, on any given day with a significant decline in prices, some stocks will decline less and some will decline more. On May 6, for example, 11 DJIA stocks declined by less than 5% from the 2:40 p.m. price, and 26 DJIA stocks declined by less than 10% from the 2:40 p.m. price. (Table 3)
18 See description of clearly erroneous rules in Appendix A.
19 Following the wide-scale disruption of May 6, 2010, the exchanges and FINRA settled on the
relatively high 60% standard for breaking trades. We understand a substantially lower standard – 10%-20% – typically is selected for the more common discrete erroneous trade events involving one or a few securities. The SEC is working with the exchanges and FINRA to establish more transparent and objective standards for breaking erroneous trades.
20 The term “broken trades” for these purposes means all trades identified as broken trades by the
exchanges and FINRA for May 6, 2010.
21 From April 1, 2010 to May 5, 2010, the average number of broken trades (excluding FINRA
Index. Trades were broken in 227 of the 838 ETFs, however. These ETFs represent 69.6% of all securities with broken trades.
Table4:DistributionofSecuritiesandSecuritieswithBrokenTrades
Market Broken
Total % Total %
Securities 7,878 100.0% 326 100.0%
Primary Listing on NYSE 3,277 41.6% 56 17.2%
Primary Listing on NASDAQ 2,946 37.4% 42 12.9%
Primary Listing on ARCA 1,088 13.8% 225 69.0%
Primary Listing on Amex 567 7.2% 3 0.9%
Component of DJIA 30 0.4% 0 0.0%
500 6.3% 12 3.7% Component of S&P 500
Component of Russell 2000 2,000 25.4% 30 9.2%
838 10.6% 227 69.6 Exchange-Traded Fund
The distribution of all stocks and stocks that had broken trades on May 6, 2010 by primary listing exchange, inclusion in key stock indices and the number of Exchange Traded Funds
Sources: NYSE, NYSEAmex, NYSE Arca, NASDAQ, BATS, CBOE Stock Exchange, ISE, NASDAQBX, National Stock Exchange, Chicago Stock Exchange and FINRA.
The 99 securities22 with broken trades that are not ETFs include securities of a wide variety of issuers, both large and small (including 10 exchange-traded products, or ETPs, that are not ETFs) and there may be a variety of explanations for their aberrant behavior. We continue to investigate the trading in these securities on May 6 to
determine whether there is a common cause or causes for the trading anomalies, such as a particular susceptibility to liquidity withdrawal or an unusually large number of stop loss market orders.
Tables 5 and 6 below provide certain information regarding the distribution of trades that were broken, both by trading venue and by time period. These tables show that 20,761 trades were broken on May 6, with 12,306 (59.3%) broken by NASDAQ, 4,903 (23.6%) broken by NYSE Arca, 1,816 (8.7%) broken in the OTC market, and 1,094 (5.3%) broken by BATS. No trades were broken by NYSE.
Table 5 and Table 6 show the distribution of securities in which broken trades occurred by markets.23
22 The total of 326 securities with broken trades is comprised of 227 ETFs, 10 ETPs that are not
ETFs and 89 stocks.
23 The number of broken ADF/TRF trades counts only trades that were not rejected by ACT and that
Table5: NumberofTradesExecutingonEachMarket
2:20- 2:40- Number of
2:40p.m. 3:00p.m. Broken
Trades
Total Trades 5,721,383 7,318,675 20,761
286.68 282.03 270.33 Average Trade Size
On NYSE 667,368 1,039,233 0
On Amex 4,154 6,965 4
On NASDAQ 1,482,761 2,052,647 12,306
On ARCA 886,899 1,110,765 4,903
On BATS 988,252 1,177,318 1,094
On CBOE 2,902 4,743 138
On NASDAQ-BX 271,119 401,549 63
On ISE 87,313 171,978 403
On National 35,386 58,085 27
On Chicago 5,845 10,748
On ADF/TRF 1,287,489 1,101,252 1,816
Sources: NYSE, NSYEAmex, NYSEARCA, NASDAQ, BATS, CBOE Stock Exchange, ISE, NASDAQBX, National Stock Exchange, Chicago Stock Exchange and FINRA
Table6: PercentageofTradesExecutingonEachMarket
2:20-2:40p.m.
2:40-3:00p.m.
Percentage of Broken
Trades
Total Trades 5,721,383 7,318,675 20,761
Average Trade Size 286.68 282.03 270.33
On NYSE 11.70% 14.60% 0.00%
On Amex 0.10% 0.10% 0.00%
On ARCA 15.50% 15.60% 23.60%
On NASDAQ 25.90% 28.80% 59.30%
On BATS 17.30% 16.50% 5.30%
On CBOE 0.10% 0.10% 0.70%
On ISE 1.50% 2.40% 1.90%
On NASDAQ-BX 4.70% 5.60% 0.30%
On National 0.60% 0.80% 0.10%
On Chicago 0.10% 0.20% 0.00%
On ADF/TRF 22.50% 15.40% 8.70%
Sources: NYSE, NSYEAmex, NYSEARCA, NASDAQ, BATS, CBOE Stock Exchange, ISE, NASDAQBX, National Stock Exchange, Chicago Stock Exchange and FINRA
We continue to analyze the distribution of broken trades across markets to determine whether differences in market structure may have had an impact. Because NYSE pauses or slows trading in volatile periods when a LRP is triggered, this likely explains why NYSE had no broken trades on May 6. Some have suggested that LRPs exacerbated price volatility on May 6 by causing a net loss of liquidity as orders were routed to other trading venues for immediate execution rather than wait on the LRP mechanism. If accurate, this potentially could cause some NYSE securities to decline further than the broad market decline. Others believe that the LRP mechanism served to attract additional liquidity that helped soak up some the excess selling interest in these securities on May 6. In any event, nearly 83% of the securities with broken trades do not trade on NYSE, as NYSE trades only NYSE-listed stocks, and thus could not have been directly affected by NYSE LRPs. A determination of the extent to which the use of LRPs by NYSE contributed to the volatility on May 6 requires further study.
Also worth noting is the relatively low number of broken trades on BATS, relative to its share of trading volume. Although more study is required, one explanation for this could be that BATS does not refresh “stub quotes.” The SEC staff is reviewing the extent to which the use of stub quotes contributed to the volatility on May 6, and is considering possible policy responses.