Investigating the Differential Effects of
Formative and Summative Assessment on EFL
Learners’ End-of-term Achievement
Amir Mahshanian University of Isfahan, Iran
Reihane Shoghi University of Isfahan, Iran
Mohammad Bahrami University of Isfahan, Iran
Abstract—In this study, an attempt has been made to highlight the importance of summative assessment in conjunction with teacher-based (formative) assessment on the learning. 107 advanced EFL learners in 3 classes were selected and grouped based on the type of assessment they received. Participants in this study were given tests for two main reasons. First, a general test of proficiency was administered in order to place the learners in different proficiency levels. Second, in an attempt to compare learners’ improvement based on different types of assessment within a 4-month learning period, an achievement test of the course was given two times, as pre and post-tests. The data obtained through learners’ scores on achievement tests were analyzed and then compared using ANOVA, ANCOVA and t-test. In light of the results of this study, it can be argued that a combination of formative and summative assessments can lead to higher achievements of EFL learners than either formative or summative assessment separately.
Index Terms—formative assessment, summative assessment, EFL learners, end-of-term achievement
I. INTRODUCTION
Within the context of education, in general, three forms of evaluation play significant roles, the application of which would be different for different skills and in different contexts – for example, writing evaluation includes both scoring the task and commenting on it (Mahshanian et al., 2017). As Frunza (2013) points out, however, these forms of evaluation, namely an initial evaluation, a formative evaluation and a summative one are used for a particular purpose along the process of education. The initial evaluation is carried out at the beginning, the formative one parallel to the process of teaching and learning, and the summative one after the process has been completed, to confirm the achievement of the learners. Frunza (2013), based on Dick and Carey (1996) defines formative evaluation as “the process used by designers in order to obtain information that can be utilized to revise the instruction, to make it more efficient and more productive” (p.453). Also, Assessment Reform Group (2002), sees formative assessment as assessment for learning which should be part of effective planning of teaching and learning. It also puts forward the notion of assessment of learning (summative assessment) which “is carried out at the end of a unit or year or key stage or when a pupil is leaving the school to make judgments about pupils’ performance in relation to national standards” (Leung & Mohan, 2004, p.337)
In the past few decades, Gattullo (2000), Leung and Mohan (2004), and Frunza (2013), among others, worked on the effectiveness of formative assessment in ESL context. Despite its related ESL context, Gattullo’s (2000) study was basically on the assessment of children. Leung and Mohan’s (2004) study, which was both on adults and children in an ESL context, doubted the idea that concepts of summative assessment would be of import or, in effect, of interest in the pedagogic and evaluative work being done. In this respect, in Frunza ’s study (2013), also, in favor of formative assessment, such a great deal of attention has been paid to advantages of assessment for learning that one can figure out that the paper was an attempt to advocate what has already been discussed in literature for formative assessment. Proponents of formative assessment speak of this type of assessment as “good” or else they name it assessment “for”
learning in such a manner that one could question if summative assessment is “bad” or “against” learning (Taras 2005), the notion which is under question in the present study.
More recently, Harris (2007), Taras (2008), Ghiatău et al. (2011), Havnes et al. (2012) added to the literature to support the importance and predominance of formative over summative assessment. In Ghiatău et al.’s (2011) study, as in Harris (2007), Taras (2008) and Hanves et.al. (2012), results are based on the data collected through a questionnaire filled by pupils in which learners’ attitude toward the type of assessment was investigated. Data in this study was not based on quantitative data collected from the results of performance of the learners on achievement tests. It is worth mentioning that learners’ attitude toward a strategy does not account for its usefulness and practicality. Many times, learners’ attitudes toward learning are not reliable for pedagogical contexts but rather are for the sake of learners’ ease. In broad terms, reflection of learners’ attitude with respect to the predominance one type of assessment over another could not account for its usefulness in EFL context (Brookhart, 2001).
In another recent study, Tridane et al. (2015) highlights the effect of formative assessment on the learning and the unreliability of the mark for the summative assessment. Results of this study were according to the data which was collected rather qualitatively based on the questionnaire filled by the learners. This could adversely affect the reliability of a qualitative study. The other issue which causes the present study to be in sharp contrast with that of Tridane et al. (2015) is that their study was the case of content learning where the use of mother tongue was at work, not learning a second or foreign language. This is, further, evident in another recent study by Box et.al (2015) whose results offered differences among teachers’ personal assessment and several different factors that constrained or facilitated the use of formative assessment in their instruction.
To sum up, among researchers, very few, have worked on the importance of summative assessment or the interaction of the two main types of assessment for language learning. The general thrust of much recent discussion on assessment has not been detached enough, so that one can argue that researchers in recent years, in favor of formative assessment, have paid much less attention to the significant role of summative assessment in language learning. The present study adds to the literature the importance and usefulness of formative assessment when being used as a complement to a standardized summative assessment. It, as opposed to many studies (Gattullo, 2000; Leung & Mohan, 2004; Covic & Jones, 2008; Frunza, 2013; Tridane et al, 2015; and Box et.al, 2015, to name but a few), makes an attempt to stress the practicality of summative assessment, highlighting that using formative assessment as the only way to evaluate learners’ achievement cannot easily be put into practice in an EFL context as much as it can in others.
II. METHOD
The current study was an attempt to compare summative and formative assessment and investigate the effects of each one on advanced learners’ performance in end- of- term achievement tests. In technical terms, the following research questions were intended to be addressed:
1. Does the use of formative assessment as the only evaluation method contribute to the improvement of learners’ end- of- term achievement?
2. Does the use of summative assessment as the only evaluation method contribute to the improvement of learners’ end- of- term achievement?
3. Does the interaction of both formative and summative assessments contribute to the improvement of learners’ end- of- term achievement?
It should, also, be noted that “end-of-term achievement” is operationally defined as the learners’ performance in an achievement test containing listening, reading, grammar and vocabulary items of the course book, which has been administered after a four-month period of instruction.
A. Design
Due to Iranian institutes enrollment policies allowing only for intact classes, the study enjoyed a quasi-experimental pre-test, post-test design.
B. Participants
TABLE I.
EVALUATION METHODS IN 12CLASSES
C. Instruments
1. Instructional materials
Passages Series 1 and 2 (Richards 2013, third edition) were the text books used in this study. In every unit of these books there are 7 sections including those of grammar, vocabulary, speaking, listening, writing and reading, respectively. Each of the 12 units of the Passages Series has a central topic and has two lessons (A and B) each of which contains some sections which are parallel to the purpose of the whole unit. In lesson A, there is a section under the title of ‘Starting Point’ in which the new grammar in a variety of real world settings is presented. Following this, vocabulary and speaking sections are presented. Next, there is a section on grammar which is explored in context and builds on previously met structures and is followed by a ‘speaking’ section. The other sections are ‘listening’, ‘writing’ and ‘reading’ in turn.
2. Testing material
The tests and quizzes of the series itself which were designed based on the topics presented in the course-books, were used for measuring purposes in this study. Also, a placement test of homogeneity (developed by Lesley, Hansen, and Zukowski, 2008, for Passages Series) was employed. This test contained sections on listening, reading, vocabulary and grammar and was administered twice during the study (as the pretest and post-test). Midterm exams of Passages Series were also used after each six units. The number of items for listening, vocabulary, grammar, and reading were in turn 8, 10,16, and 11 respectively. In addition, 12 quizzes (developed by Lesley, Hansen, and Zukowski, 2008, for Passages Series) were administered after each two units including 5 items in listening, 8 in vocabulary, 10 in grammar, and 5 in reading.The reliability of the tests and the quizzes was calculated using KR-21 formula and were estimated at over 65% was for all of the 12 quizzes, and over 70% for different sections of the test.
D. Procedure
Before beginning the course, the participants took the placement test of Passages Series (Lesley et al., 2008). Based on the results, high scorers in the first administration were excluded from the study. This test was administered at the end of the course to compare the performance of the learners before and after the treatment. Also, to make sure that the instructors were fully aware of the objectives of the course a few briefing sessions were held to familiarize them with assessment methods in this study. The rubrics employed for informing the instructors were developed according to the guidelines taken from Assessment Reform Group (2002). The instructors being prepared for the treatment sessions, were required to instruct three groups of learners (namely, summative group, formative group, and interaction group) according to the rubrics developed by the researchers.
E. Formative Group
Based on the rubrics by Assessment Reform Group (2002), in formative classes, instructors helped learners take part in assessing their learning (i.e., self/peer-assessment). Also, the instructor’s descriptive and comprehensive feedback and elicitation of information about learners’ learning were important in formative group. There was no test at the end of the term (except for the post-test which they were unaware of) and there were no written or verbal reports for a third party. Also, instructors were asked to be flexible to learners’ errors and to provide learners with feedback (e.g. explicit correction, recast, clarification request, metalinguistic clues, elicitation, repletion, etc.).
F. Summative Group
In the summative group, based on the rubrics developed by Assessment Reform Group (2002), the instructors were requested to assess learners by giving mid-term and final tests for Passages Series (developed by Lesley, Hansen, and Zukowski, 2008). The instructors were also asked not to give any elaborative feedback, and their feedback was confined to yes/no and true/ false. They had to present the director of the institution with results as scores/grades in report cards.
G. Interaction Group
The same mid-term and final tests in the summative group were administered in the interaction group coupled with quizzes and all the rubrics practiced in formative group.
H. Control Group
The instructor of the control group taught the learners without using any preplanned kind of assessment, nor did they take any kind of briefing and/or training sessions. They were simply following the procedure of the course which was imposed by the institution and were requested to report their performance to the researchers for every session of the class.
Classes Groups Number of Learners
1 Summative group 27
2 Formative group 26
3 Interaction group 27
III. RESULTS
A. Summative Group (SG)
1. Pretest
An important issue in comparing learners’ scores in control group and the summative one is to make sure that learners in both groups perform the same on the pretest. Given that the three evaluation methods in this study were applied to EFL learners by different instructors, a simple way to deal with the issue of same performance on the pretest is to examine the variance between the mean of scores in control group (CG) and the summative group (SG). In so doing, an independent sample t-test was run to investigate the extent to which learners’ scores in CG, and SG vary. Table 1, below, presents the descriptive statistics for the summative group.
TABLE I.
SUMMATIVE GROUP PRE-TEST STATISTICS
Group N Mean Std. Deviation Std. Error Mean
Pre-test.SG Case 27 30.0741 2.11089 .40624
Control 27 30.0741 2.03670 .39196
In table 2 below, results based on independent sample test is depicted to show the equivalence of the pretest scores taken by learners in two groups, namely summative and, control groups. As table 2 clearly shows, the significance is estimated at +1.000 which implies that the difference between the two groups is not significant. In other words, learners in the summative group, and the control group performed almost the same on the pretest. It should be borne in mind that before comparing the groups, a Leven’s test was run to check to the equality of variances.
TABLE II
INDEPENDENT SAMPLES TEST (PRETEST SG)
t-test for Equality of Means
Sig. (2-tailed) Mean Difference Std. Error Difference
Pre-test.SG
Equal variances assumed 1.000 .00000 .56451
Equal variances not assumed 1.000 .00000 .56451
2. Post Test
The mean and SD were computed for the three groups, namely the summative group, formative group, and the control group. In table 3, the mean and SD for summative group are compared to those of the control group. As is shown in table 3, the number of learners in two groups were the same (N=27), the mean of scores, however, in the summative group (M=40.66) is higher than that of the control group (M=37.07). This mean difference implies that learners in summative group outperformed the control group.
TABLE III.
SG POST-TEST DESCRIPTIVE STATISTICS
Group Mean Std. Deviation N
Case 40.6667 8.10982 27
Control 37.0741 2.97329 27
Total 38.8704 6.31574 54
In an attempt to control for other variables, and to make sure that the results of the post-test were based on the treatment, the treatment lasted almost four months. This would imply that in all groups, the treatments were considered a normal procedure of the class. As a result, one could argue that by the time the post test was administered, learners probably forgot the results of the pretest, and we can ascertain that the results of the post test is not based on other variables, but on evaluation methods. Thus, an ANCOVA was used to show the effectiveness of the treatment in SG, and the results are shown in table 4 below.
TABLE IV.
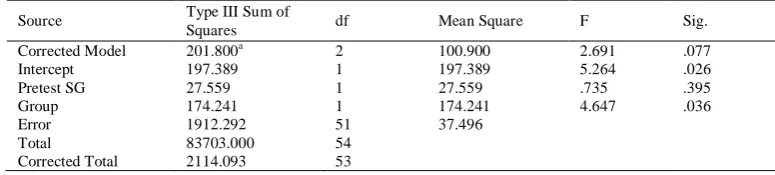
TESTS OF BETWEEN-SUBJECTS EFFECTS POSTTEST SG
Source Type III Sum of
Squares df Mean Square F Sig.
Corrected Model 201.800a 2 100.900 2.691 .077
Intercept 197.389 1 197.389 5.264 .026
Pretest SG 27.559 1 27.559 .735 .395
Group 174.241 1 174.241 4.647 .036
Error 1912.292 51 37.496
Total 83703.000 54
Corrected Total 2114.093 53
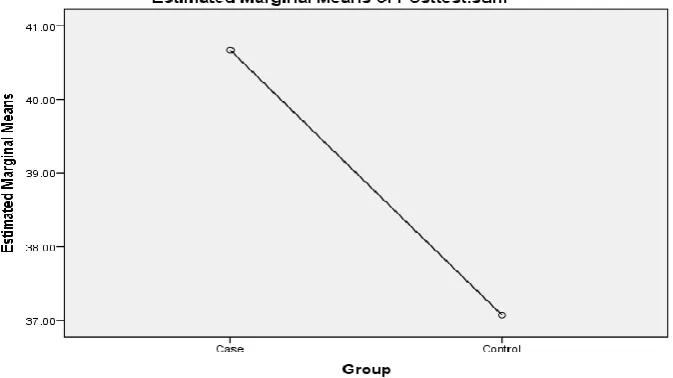
Additionally, the significance of the relationship between SG, and CG, was estimated at .036. This indicates that there is a significant relationship between SG and CG in that learners in SG, as a result of summative assessment outperformed the learners in CG. To depict the outperformance of the SG, figure 1 is presented as follows.
Fig. 1. Mean Difference in Formative and Control Group
B. Formative Group (FG)
1. Pretest
As for SG, to investigate the degree of sameness regarding learners’ performance on the pretest, the variance between the mean of scores in CG and FG was examined. Results of the independent sample t-test was to investigate the extent to which learners’ scores in CG and FG vary. Table 5 below, briefly, indicates descriptive statistics for the FG.
TABLE V. FGPRE-TEST STATISTICS
Group N Mean Std. Deviation Std. Error Mean
Pre-test FG Case 27 30.7407 2.24624 .43229
Control 27 30.0741 2.03670 .39196
In table 6 below, as in table 2 above, results based on independent sample test is shown to indicate the degree of sameness in pretest scores in FG, and CG. As can be seen, the significance of the relationship is estimated at 0.258, suggesting that the difference between the two groups is not significant, and that learners in FG, and CG performed almost the same on the pretest.
TABLE VI
INDEPENDENT SAMPLES TEST (PRETEST FG)
t-test for Equality of Means
Sig. (2-tailed) Mean Difference Std. Error Difference
Pretest FG Equal variances assumed .258 .66667 .58353
Equal variances not assumed .259 .66667 .58353
2. Post Test
As mentioned earlier, the mean and SD were computed for all groups. In table 7, the mean and SD for FG are compared to those of the CG. As is depicted, the number of learners in two groups were the same (N=27). The mean of scores, however, in FG (M=46.66) is higher than that of the CG (M=37.07) which implies that learners in FG outperformed the control group. This was also the case for SG, as discussed earlier. Later in this article, results based on the t-test in four groups are compared and discussed.
TABLE VII.
SG POST-TEST DESCRIPTIVE STATISTICS
Group Mean Std. Deviation N
Case 46.4444 15.21217 27
Control 37.0741 2.97329 27
As for SG, an ANCOVA was used to show the effectiveness of the treatment in FG (see table 8).
TABLE VIII.
TESTS OF BETWEEN-SUBJECTS EFFECTS POSTTEST FG
Source Type III Sum of
Squares df Mean Square F Sig.
Corrected Model 1627.128a 2 813.564 7.148 .002
Intercept .046 1 .046 .000 .984
Pretest. form 441.776 1 441.776 3.881 .054
Group 943.462 1 943.462 8.289 .006
Error 5804.742 51 113.818
Total 101599.000 54
Corrected Total 7431.870 53
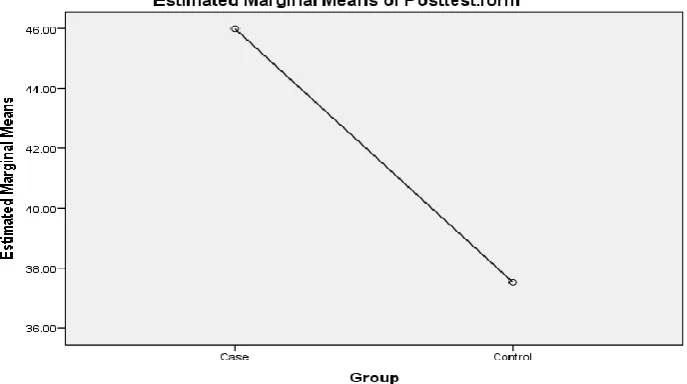
In table 8, P value in the pretest was estimated at (0.054) indicating that the administration of the pretest had no significant effect on the result of the post test, and that it worked independently from the post test. To put it differently, the result of the post test was based on the treatment in FG (i.e., summative assessment). It is worth adding that, the significance of the relationship between FG and CG was estimated at (0.006). This suggests that there is a significant relationship between SG and CG and that learners in FG outperformed those in CG. To highlight the outperformance of FG over CG, figure 2 is presented as follows. Later, the outperformance of learners in SG, and FG, will be compared to that of IG.
Fig. 2. Mean Difference in Summative and Control Group
C. Interaction Group (IG)
1. Pretest
As for the SG, and FG, the variance between the mean of scores in CG and IG was examined and taken into account. Results of the independent sample t-test were to show the degree to which learners’ scores in the control and IG vary. Table 9 presents the IG descriptive statistics.
TABLE IX. FGPRE-TEST STATISTICS
Group N Mean Std. Deviation Std. Error Mean
Pretest.int Case 27 29.7407 1.81007 .34835
Control 27 30.0741 2.03670 .39196
TABLE X.
INDEPENDENT SAMPLES TEST (PRETEST FG) t-test for Equality of Means
Sig. (2-tailed) Mean Difference Std. Error Difference
95% Confidence Interval of the Difference Lower
Pretest IG Equal variances assumed .528 -.33333 .52439 -1.38559
Equal variances not assumed .528 -.33333 .52439 -1.38594
2. Post Test
The mean and SD were computed for IG, as were for all the other groups. Table 11 presents the mean and SD for IG and CG. As is depicted, the number of learners in two groups were the same. Table 11 below is a brief representation of IG descriptive statistics. What is of significance in table 9 is that the mean in IG, is a lot higher that of CG. The mean difference between SG, and CG, and between FG, and CG are 3 and 9, respectively. This is despite the fact that the mean difference between IG, and CG is estimated at 27. This is a clear evidence to show that although learners in both SG, and FG outperformed the learners in control group, learners in IG not only outperform the control group, but they also outperformed learners in SG, and FG.
TABLE XI. IGPOST-TEST STATISTICS
Group Mean Std. Deviation N
Case 64.1852 10.25084 27
Control 37.0741 2.97329 27
Total 50.6296 15.59184 54
As for the SG, and FG an ANCOVA was used to show the effectiveness of the treatment in IG in table 12 below.
TABLE XII.
TESTS OF BETWEEN-SUBJECTS EFFECTS POSTTEST FG
Source Type III Sum of
Squares
df Mean Square F Sig.
Corrected Model 10014.190a 2 5007.095 88.964 .000
Intercept 224.351 1 224.351 3.986 .051
Pretest.int 91.524 1 91.524 1.626 .208
Group 9861.856 1 9861.856 175.221 .000
Error 2870.402 51 56.282
Total 151306.000 54
Corrected Total 12884.593 53
In table 12, P in the pretest was estimated at (0.208), which is above (0.05), and suggests that the result of the post test was based on the treatment (interaction of both summative and formative assessment) in IG. In addition, the significance of the relationship between IG and CG (sig=000) suggests that there is a significant relationship between IG and CG. In other words, learners in IG outperformed the learners in CG, as well as the learners in SG, and FG. This is depicted in figure 3 below.
3. A Comparison of SG and FG
A comparison of final reported scores for SG and FG, through a Post-Hoc-LSD test, indicated that there was no significant difference between the scores, although, with the P-value level set at .05, the differences in the scores were only marginally insignificant (M= 40.6 and 46.4 respectively; SD = 8.1 and 15.2 respectively; p = .07, two-tailed). The relative closeness of the scores across the two groups suggested that both summative and formative assessment resulted in better scores in the post tests. In short, results indicated that although the mean of scores in FG was higher than that of SG, it cannot be argued that learners in FG outperformed those in SG. The results of the Post-Hoc-LSD test is presented in table 13 below.
TABLE XIII.
POST-HOC-LSDTEST;COMPARING SG,FG, AND IG (I) Group (J) Group Mean Difference
(I-J)
Std. Error Sig. 95% Confidence Interval Lower Bound Upper Bound
Posttest FG Posttest.SG 5.77778 3.15156 .071 -.4965 12.0521
Posttest IG -17.74074* 3.15156 .000 -24.0150 -11.4665
Posttest SG Posttest FG -5.77778 3.15156 .071 -12.0521 .4965
Posttest IG -23.51852* 3.15156 .000 -29.7928 -17.2442
Posttest IG Posttest FG 17.74074* 3.15156 .000 11.4665 24.0150
Posttest.SG 23.51852* 3.15156 .000 17.2442 29.7928
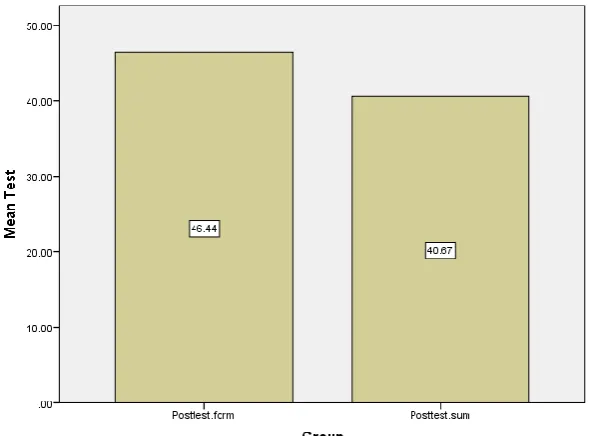
To provide additional information to describe the two sets of reported posttest scores in FG and SG, Figure 4 is presented below to show the relationship between the scores obtained by learners based on two assessment methods (i.e., formative and summative).
Figure 4. Comparing Mean of SG, and FG
4. Comparing SG, FG, and IG
As was earlier discussed, and based on results of Post-Hoc-LSD test, it can be argued that learners in all three groups (i.e., SG, FG, and IG) benefited from the assessment methods in that they outperformed the control group. In other words, all assessment methods were to an extent useful for the learners. This is despite the fact that there is a significant relationship between the mean of the groups which indicates that learners in IG outperformed those in SG, and FG. An ANOVA was used to show the significance of the relationship between the groups in table 14 below.
TABLE XIV.
ANOVA FOR COMPARING THE MEANS IN THREE GROUPS
Sum of Squares df Mean Square F Sig.
Between Groups 8111.136 2 4055.568 30.246 .000
Within Groups 10458.741 78 134.086
Total 18569.877 80
As illustrated in the table, the p-value is estimated at (0.000) which suggests that there is a significant relationship between the mean of scores in the three groups. Comparing the p-value in this table and that of table 12 above (sig=0.7, and sig= 0.000, for the relationship between SG, and FG, and the relationship between IG, and the other two groups, respectively) some remarks can be made as follows;
2- Summative assessment was as effective as formative evaluation method
3- The most effective method is an interaction of both summative and formative evaluation
To depict the effectiveness of assessment methods based on their means in posttests, figure 5, and 6 are presented below.
Figure 5. Mean Difference in Three Groups
Figure 6. Mean Difference in Three Groups
It should be noted that, in the interest of space, other phases of data analysis (e.g., ANOVA, descriptive statistics for all groups, 2-by-2 comparison of groups, and their plots, independent samples tests, Levene's test for equality of variances, and a report on results scores in pre-tests and post- tests, in all groups) were also provided in the appendices.
IV. DISCUSSION
The current study was carried out in order to find the effect of different assessment methods on learners’ final achievement over a four-month period and also to fill in the gaps of the previous studies conducted regarding this area of language teaching. As was pointed out earlier in this study, there has been a plethora of research relating to the evaluation methods with the focus on the benefits and in favor of formative assessment. However, it would not be sufficient to evaluate the language teaching and learning process only by a small sample of the learners and in a small scope. Undoubtedly, many other factors would affect this process.
2004; Covic & Jones, 2008; Frunza, 2013; Tridane et al, 2015; and Box et.al, 2015), assessment per se has a positive effect on learners’ final achievement. Another interesting fact was that summative assessment is as effective as formative assessment. In other words, when using each of these two methods as the only assessmnt method, they would have equal effects on learners’ end-of-term achievement. This is in contrast with some of the previous studies in which the role of summative assessment have been underestimated (e.g., Gattullo, 2000; Leung & Mohan 2004; Harris, 2007; Covic & Jones, 2008; Davison & Leung, 2009; Frunza, 2013; Black and William, 1998; Harris, 2007; Taras, 2008; Ghiatău et al., 2011; Havnes et al., 2012). The third and the most crucial finding of the present study is that a combination of formative and summative assessments led to higher achievement than either formative or summative assessment separately. Thus, assessment is part of learning and it should be taken into account for each EFL course.
One of the strengths of the current study was that it adjudicated two assessments through using quantitative analysis of data unlike many other recent studies (e.g. Harris, 2007; Taras, 2008; Ghiatău et.al, 2011 and Havnes et.al, 2012) .Too, this study did not take any biased views towards each assessment method unlike some others pointing out large claims regarding the predominance of formative over the summative method of evaluation (e.g. Gattullo, 2000; Leung and Mohan, 2004; Harris, 2007; Covic & Jones, 2008; Davison & Leung, 2009). A third strength of the present study was that it enjoyed a vast number of participants (i.e., 107) and intact groups in advanced levels in an Iranian EFL setting in contrast to some of the previous studies (Gattullo, 2000; Leung & Mohan, 2004; and Frunza 2013) which worked on ESL contexts.
Confirming the ideas in the previous research studies (Gattullo, 2000; Leung & Mohan 2004; Harris, 2007; Covic & Jones, 2008; Davison & Leung, 2009; Frunza, 2013; Schloss et al., 1990; Wholey, 1996; Black and William, 1998; Harris, 2007; Taras, 2008; Ghiatău et al., 2011; Havnes et al., 2012; Brookhart, 2001; Tridane et al., 2015), the current research project highlighted the importance of assessment and its usefulness in learners’ performance. Also, the comparisons between summative and formative groups revealed that the mere use of assessment in EFL contexts regardless of the method has a significant effect on learners’ end-of-term performance.
Finally, the use of summative and formative assessments interactively, and its significant difference with either of these two methods divulged that not only is formative assessment necessary to be used in EFL contexts but also it should be used along with a standardized summative assessment. This combination of both methods can play a great role in the enhancement of learners’ mastery over language learning process.
A. Limitation
Although great attempts have been made to remove the barriers of the study, there has remained some limitations. First, in the achievement test, a test of writing and speaking proficiency was not included. Thus, basing learners’ end-of-term achievement on a final test, excluding a test of writing and speaking proficiency might introduce issues of invalidity to the results. Also, learners’ improvement from pretests to posttests with respect to each skill was not taken into account. In other words, the effect of each assessment method was not studied on different skills (e.g., the effect of summative/formative assessment on listening comprehension, reading comprehension, etc.). Furthermore, due to the relatively large number of learners (107), sessions (1200), and hours (1800), transcription of the procedure of all classes was too far from practical. This is despite the fact that all classes were observed and reported on, during the process of data collection.
B. Suggestions for Further Research
There are still grounds for further research regarding the importance of assessment and also on the difference between summative and formative assessments across different contexts and different age groups. One might be interested in duplicating the present study in other educational settings such as ESL, ESP, EAP, to name but a few. Further, the same study might result in the same or different findings in the case of intermediate or elementary EFL learners rather than advanced learners. The effect of learner or teachers’ gender in different evaluation methods on learners’ end- of- term achievement can be investigated as well.
V. CONCLUSION
The major contribution of this quantitative research project was on the impacts of formative and summative assessments, and the interaction of both, on advanced Iranian EFL learners’ performance on end-of-term achievement tests. As earlier discussed in the introduction, the present study did not have any biased views towards confirming or rejecting any evaluation criteria. The results of the data analysis revealed that focusing on a single assessment method and ignoring the effects of other methods cannot guarantee learners’ success in ultimate achievement. Notably, the results of this study are in line with the previous studies regarding the effectiveness of assessment methods and by no means does this study invalidate existing studies. Thus, taking extremist views of using pure summative or formative assessment, cannot assure learners improvement in their achievement.
current study. That is to say, a combination of formative and summative assessments led to higher achievement than either formative or summative assessment separately. To recapitulate, despite the fact that formative assessment is highly advocated in the literature, the current study argues that formative assessment is more profitable and helpful once used as a complement to summative assessment employing a standardized achievement test.
REFERENCES
[1] Assessment Reform Group (2002). Assessment for Learning: 10 principles research-based principles to guide classroom
practice, Assessment Reform Group, London, United Kingdom.
[2] Black, P and Wiliam, D. (1998). ‘Assessment and Classroom learning’, Education: Principles, Policy and Practice, 5, 7-74.
[3] Black, P and Wiliam, D. (1998). Inside the Black Box: Raising standards through classroom assessment, School of Education,
King’s College, London, United Kingdom.
[4] Box, C., Skoog, G. and Debbas, J.M. (2015). A Case Study of Teacher Personal Practice Assessment Theories and
Complexities of Implementing Formative Assessment. American Educational Research Journal, 20, 1-28
[5] Brookhart, S.M. (2001). Successful students' formative and summative uses of assessment information, Assessment in
Education: Principles, Policy and Practice, 8(2), 153-169
[6] Covic, T. and Jonse, M. (2008). Is the essay resubmission option a formative or a summative assessment and does it matter as
long as the grades improve? Assessment & Evaluation in Higher Education, 33, 75-85
[7] Davison, C., & Leung, C. (2009). Current Issues in English Language Teacher-Based Assessment. TESOL Quarterly, 43(3),
393 - 415.
[8] Dick, W., & Carey, L. (1996). The systematic design of instruction. 4th ed. New York, NY: Harper Collin College Publishers
[9] Frunza, V. (2013). Advantages and barriers of formative assessment in the teaching-learning activity. In: Proceeding of 4th
World Conference on Psychology, Counseling and Guidance. Ovidius University, Constanta, Romania.
[10] Gattulo, F. (2000).Formative assessment in ELT primary (elementary) classrooms: an Italian case study. Language Testing, 17,
278-288
[11] Ghiatău, R., Diac, G. and Curelaru, V. (2011). Interaction between summative and formative in higher education assessment:
students’ perception. Procedia Social and Behavioral Sciences, 11, 220–224
[12] Harris, L. (2007). Employing formative assessment in the classroom. Improving Schools, 10, 249-260
[13] Havnes, A., Smith, K. Dysthe, O. and Ludvigsen, K. (2012). Formative assessment and feedback: Making learning visible.
Studies in Educational Evaluation, 38, 21-27.
[14] Leung, C. and Mohan, B. (2004).Discourse contexts: assessment as discourse and assessment of Teacher formative assessment
and talk in classroom. Language Testing, 21, 335-359.
[15] Mahshanian, A., Ketabi, S., & Abbas, R. (2017). Raters’ Fatigue and Their Comments during Scoring Writing Essays: A Case
of Iranian EFL Learners. Indonesian Journal of Applied Linguistics, 302-314.
[16] Schloss, P.J., Smith, M.A. and Posluzsny, M. (1990). The impact of formative and summative assessment upon test
performance of special educational majors. Teacher Education and Special Education, 13(1), 3-8.
[17] Taras, M. (2005). Assessment: Summative and Formative-Some Theoretical Reflections. British Journal of educational Studies,
466-478.
[18] Taras, M. (2008). Summative and formative assessment, Perceptions and realities. Active Learning in Higher Education, 9(2),
172-192
[19] Tridane, M., Belaaouad, S., Benmokhtar, S., Gourja, B. and Radid, M. (2015). The impact of formative assessment on the
learning process and the unreliability of the mark for the summative evaluation. In: Proceeding of 7th World Conference on
Educational Sciences. Novotel Athens Convention Center, Athens, Greece.
[20] Wholey, J. (1996). Formative and summative evaluation: Related issues in performance measurement. Evaluation Practice,
17(2), 145-149
Reihane Shoghi, MA in TEFL and TA in applied linguistics at the Department of English Language and Literature of University of Isfahan, held a BA in English Literature in 2011 and an MA in TEFL in 2015 from University of Isfahan, Iran. Her research line is mainly concerned with syntax, first and second language acquisition, and language assessment, to name a few. She started her career as a foreign language instructor in 2010 and has been teaching different general and technical courses in language institutes and universities since then. Since 2018, Miss Shoghi has been working as a language teacher at Emcan Language Institute, Isfahan, Iran, and a TA in applied linguistics at University of Isfahan.