AUSTRALIAN JOURNAL OF BASIC AND
APPLIED SCIENCES
ISSN:1991-8178 EISSN: 2309-8414 Journal home page: www.ajbasweb.com
Open Access Journal
Published BY AENSI Publication
© 2017 AENSI Publisher All rights reserved
This work is licensed under the Creative Commons Attribution International License (CC BY). http://creativecommons.org/licenses/by/4.0/
To Cite This Article: Sohail Ayub and Vaibhav Sharma., Status And Impact Of Brewery Effluent On Ground Water Quality Of Adjoining Communities- A Case Study. Aust. J. Basic & Appl. Sci., 11(8): 28-33, 2017
Status And Impact Of Brewery Effluent On Ground Water Quality Of
Adjoining Communities- A Case Study
Sohail Ayub and Vaibhav Sharma
Department of Civil Engineering Aligarh Muslim University Aligarh AMU 202002, India.
Address For Correspondence:
Dr.SohailAyub, Associate Professor.Department of Civil Engineering Aligarh Muslim University Aligarh AMU 202002, India. Tel: +91571-2700920 ext. 1976. Fax No.+91571-2700220
Mobile :+919411802300; E-mail: [email protected],[email protected]
A R T I C L E I N F O A B S T R A C T Article history:
Received 18 February 2017 Accepted 15 May 2017
Available online 18 May 2017
Keywords:
Brewery wastewater, Physico-chemical analysis, ground water quality.
A field study was conducted at Atrauli suited 30 km from Aligarh for the communities residing near the distillery and brewery industry. To know the current status and impact of brewery wastewater discharge on ground water quality water samples were drawn from government and private hand pumps surrounding villages and at discharge point.The effluent concentration increases after the industry treated effluent mixes in river. The effluent from the industry contains high values of TDS, BOD and COD. However with time and distance the COD, BOD values starts decreases. In ground waterthe concentration of alkalinity, fluoride, total hardness and total dissolved solid in some of villages are observed beyond permissible limit.
INTRODUCTION
MATERIALS AND METHODS
Area of Present Study:
Atrauli is situated about 30 km from Aligarh district. It is situated at 27.18º N & 80.68º E. Atrauli has an average elevation of 136m. The water table in this area generally varies from 50ft to 180 ft. The WAVE DISTILLERY &BREWERY LTDindustry is situated in village of Admedpura of Atrauli tehsil in Aligarh district.
Sample Collection:
Thesamples were collected at different placesand brought to laboratory as per standard methods.All the samples were analyzed within 48 hours to avoid any changes in physio-chemical characteristic. The average boring level of government hand pumps is 130 to 140 feet whereas for personal hand pumps the average level is 50 to 60 feet.The samples wereundertaken in six different locations around the industry as given below.
1. Brewery waste water collected from effluent discharging in Kali Nadi.
2. Gwarah village having a population of 2000 to 2500 the number of hand pumps in this area are 24 in which 16 are government hand pumps while 8 are personal hand pumps
3. Kalai village having a population of 3500 to 4000 the number of hand pumps in this area are 40 in which 25are government hand pumps while 15 are personal hand pumps.
4. Charauli village having a population of 3500 to 4000 the number of hand pumps in this area are 35 in which 25 are government hand pumps while 8 are personal hand pumps.
5. Naroli village having a population of 1000 to 1500 person. The numbers of hand pumps in this area are 14 in which 10 are government hand pumps, while 4 are personal hand pumps.
6. Bhagwangadi village having population of 2500 to 3000 person. The numbers of hand pumps in this area are 20 in which 14 are government hand pumps.
7. Close to Distillery industry where government & personal handpumps are located, on both sides of road.
RESULTS AND DISCUSSION
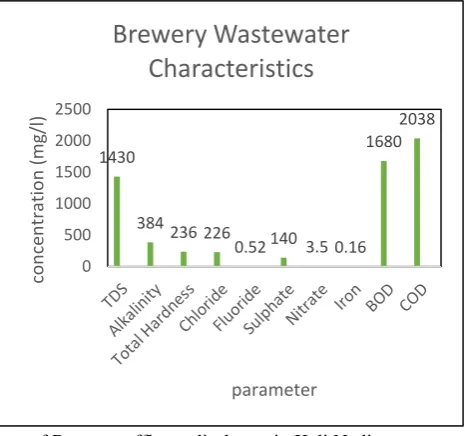
The experimental data obtained during the field investigations were depicted below. In Fig.1 the brewery effluent wastewater observed high values of TDS, BOD and COD. The BOD 1680 mg/l and COD was 2038 mg/l which is above the BIS standard.
Fig. 1: Water quality parameters of Brewery effluent discharge in Kali Nadi.
In Fig.2 all the water quality parameters of government and personal hand pumps are within the prescribed limit except the fluoride content 1.6 mg/l at personal hand pump.
1430
384236 226
0.52 140 3.5 0.16 1680
2038
0 500 1000 1500 2000 2500
con
ce
n
tra
tio
n
(mg
/l)
parameter
Fig. 2: Water quality of adjoining village GWARAH
All the water quality parameters of hand pumps at village Kalai are safe for drinking and cooking as shown in Fig.3.
Fig. 3: Water quality of adjoining village KALAI
The value of total dissolved solid in personal hand pump at village Charauli is observed slightly more than the prescribed limit as depicted in Fig.4. The other water quality parameters are acceptable as per BIS standards.
Fig. 4: Water quality of adjoining village CHARAULI 460
304
198
16 0.84 24 0.18 0.044 452
358
136
28
1.6 24 0.23 0.69
0 50 100 150 200 250 300 350 400 450 500 C o n ce n tr ati o n in ( mg /l ) PARAMETERS Government Hand Pumps Personal hand pumps 362 304 108
18 0.84 24 0.820.0792 394
304 252
38
0.84 24 1.2 0.12
0 50 100 150 200 250 300 350 400 450 C o n ce n tr ati o n in ( mg /l ) PARAMETERS Government hand pumps Personal hand pumps 342 310 160
22 0.5 32 2.6 0.092
502
304
120
28 0.87 24 1.2 0.21
It was observed in Fig. 5 that the hardness 384 mg/l is more than the acceptable limit in the personal hand pump at village Naroli. The other water quality parameters are safe for drinking and cooking.
Fig. 5: Water quality of adjoining village NAROLI
The total dissolved solids 780 mg/l, alkalinity 602 mg/l and fluoride 1.7 mg/l are above the prescribed limit in the personal hand pumps, while other parameters of government hand pumps are safe as shown in Fig.6. The main reason for more contamination of personal hand pumps are due to less height of boring level.
Fig. 6: Water quality of adjoining village BHAGWANGADI
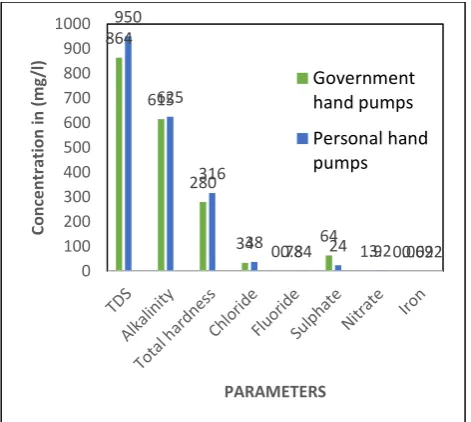
In Fig.7 the total dissolved solid and alkalinity values observed are above the prescribed limit for both the government and personal hand pump close to brewery effluent discharge.
354 308
108
16 0.81 24 0.1 0.0667
480
230 384
32
0.88 24 1.8 0.098
0 100 200 300 400 500 600
C
o
n
ce
n
tr
ati
o
n
in
(
mg
/l
)
PARAMETERS
Government hand pumps
Personal hand pumps
452
339
108
16 0.88 86 3.4 0.058
780
602
204
36 1.7 32 2.1 0.087
0 100 200 300 400 500 600 700 800 900
C
o
n
ce
n
tr
ati
o
n
in
(
mg
/l
)
PARAMETERS
Government hand pumps
Fig. 7: Water quality of close to industry.
Conclusion & Recommendation:
From the above study it may be concluded that:
1. The treated brewery & distillery industry effluent contains high values of TDS, COD and BOD. The maximum COD observed is 2038 mg/l while BOD is 1680 mg/l.
2. The alkalinity at Bhagwangadi village and close to industryin government & personal hand pump is found above the prescribed limit. The maximum alkalinity 625 mg/l is observed in ground water sample taken close to industry.
3. The fluoride concentration of personal hand pump at Gwarah village &Bhagwangadi village are found to be high.The maximum value 1.7 mg/l observed at Bhagwangaditherefore deflouridation of water should be carried out.
4. The total hardness 384 mg/lfound in personal hand pump at Naroli village &316 mg/l at close to the industry which is not in the permissible limit of BIS standard and therefore softening is done to remove hardness.
5. The TDS concentrations of personal hand pump at Charauli village and close to distillery industry are found to be higher than the permissible limit.
6. The other parameters in ground water such as turbidity, COD, BOD, color, odor, taste, chloride, sulphate, & nitrate are found to be in the permissible limit of BIS standard and therefore no pretreatment should be given.
7. The ground water of adjoining government hand pumps near the distillery industry is not affected and can be consumed for drinking purposes because the water from government hand pumps are taken at larger depth (130-140 feet) from the ground level. While the water of personal hand pumps is suitable only after giving pretreatment as it has no major pollution hazard only the fluoride, alkalinity, TDS & hardness content is slightly higher than permissible limits due to lower depth of water table. The treated factory effluent increases the BOD and COD concentration of the river stream. Therefore it is recommended that treated effluent of the factory must be properly checked before it is discharges the effluent into the river stream.
ACKNOWLEDGEMENTS
The author is grateful to Chairman Department of Civil Engineering AMU for carrying the research work.
REFERENCES
Ajmal, M and U.K. Ahsan, 2013. Effects of brewery effluent on agricultural soil and crop plants.Environ. Pollution series A, Ecol. Biol., 33(4): 341-351.
Ali, N., SohailAyub and J. Ahmad, 2015. A study on economic treatment of Distillery effluent.Int. journal of current research and review, 7(11): 8-12.
APHA, 1980. Standard methods for the examination of water and wastewater, 16th edition.American Public Health Association, Washington DC. pp: 81-96.
864
615
280
34 0.78 64 1.9 0.062
950
625
316
38 0.84 24 3.2 0.092
0 100 200 300 400 500 600 700 800 900 1000
C
o
n
ce
n
tr
ati
o
n
in
(
mg
/l
)
PARAMETERS
Government hand pumps
Avinash Shivajirao, P., 2012. Treatment of distillery waste water using membrane technologies.International Journal of Advanced Engineering Research and Studies, 1(3): 275-283.
Henry OkwudiliUdeh and Tsietsie Ephraim Kgatla, 2013. Role of magnesium ions on yeast performance during very high gravity fermentation.Journal of brewing and distilling, 4(2): 19-45.
Orhue, E.R., A.U. Osaigbovo and E. Dennis, 2005. Growth of Maize (Zea mays L.) and Changes in some chemical properties of an ultisol amended with brewery effluent. Afri. J. Biotech, 4(9): 973-978.
PattlolaAishwarya, LavudiSaida, K. Venkateswar Reddy and P. Ranjit, 2014. Impact of Brewery industry Effluents on soil enzyme activities.Int.J.Curr.Microbiol.App.Sci., 3(10): 686-692.
Prasanna, C., Tiwari, 2015. Annasaheb Warade. Technology for Waste management in Distillery.Journal of Environmental Science, Toxicology and Food Technology, 9: 105-108.
Senthilraja, K., P. Jothimani and G. Rajannan, 20133. Wastewater on growth and physiological changes in Maize, Sunflower and Sesame crops., l.1(1): 36-42.
Sohail Ayub and S. Usmani, 2014. Pollutants removal from distilleries and breweries spent wash- a case study of Aligarh UP.International journal of engineeringdevelopment and research, 2(1): 329-336.
Sohail Ayub and S. Usmani, 2014. Treatment of distilleries and breweries spent wash wastewater. International journal of research in engineering and technology, 3(2): 204-214.