Research Article
a
August
2017
Computer Science and Software Engineering
ISSN: 2277-128X (Volume-7, Issue-8)
Hubsm: A Novel Amino Acid Substitution Matrix for
Comparing Hub Proteins
Renganayaki G.*, Achuthsankar S. Nair
Department of Computational Biology and Bioinformatics, University of Kerala, Kerala, India
DOI: 10.23956/ijarcsse/V7I8/0147
Abstract - Sequence alignment algorithms and database search methods use BLOSUM and PAM substitution matrices constructed from general proteins. These de facto matrices are not optimal to align sequences accurately, for the proteins with markedly different compositional bias in the amino acid. In this work, a new amino acid substitution matrix is calculated for the disorder and low complexity rich region of Hub proteins, based on residue characteristics. Insights into the amino acid background frequencies and the substitution scores obtained from the Hubsm unveils the residue substitution patterns which differs from commonly used scoring matrices .When comparing the Hub protein sequences for detecting homologs, the use of this Hubsm matrix yields better results than PAM and BLOSUM matrices. Usage of Hubsm matrix can be optimal in database search and for the construction of more accurate sequence alignments of Hub proteins.
Keywords --- Sequence alignment, Scoring matrix, Hub protein, PAM matrix, Compositional bias
I. INTRODUCTION
Proteins are the key player in many biological processes such as signalling molecules, pathways and interaction networks. Many advanced studies have been carried out on protein-protein interaction networks (PPIN) enabled by high-through-put technology [1],[2]. In PPINs, most protein interact with small number of proteins, however, a few proteins (hubs) are involved in large number of interactions with many interaction partners. Previous studies confirm that hub proteins control and regulate protein interactions and are more essential for an organism's survival [3]. Disorder regions are a part of protein which remains flexible and unordered with no rigid structure[4],[5],[6]. Many studies confirmed that, disorder order regions of hub proteins play a key role in interacting with multiple partners and involved in cell signalling pathways [7],[8],[9]. Computational studies suggest that, the occurrence of disorder region is significantly higher in eukaryotic proteome when compared to prokaryotic proteome. [10],[11],[12]. This prevalence is due to the more complex signaling and regulatory pathways of eukaryotic proteome is heavily relied on disordered proteins. Disorder region of hub proteins exhibit low complexity amino acid compositions [13],[14] and internal repeats[15]. Zsuzsanna et al studied the protein disorder and the regions of low complexity in the interaction networks of eukaryotic proteome such as D. Melanogaster, C.elegans, S.cerevisiae and H.sapiens. The study suggests that the hub proteins tends to be larger and exhibit more frequent disorder and low complexity regions, significantly serving as a structural basis for the many fold interactions of hub proteins [16]. Also research brings out that hub proteins having more protein – protein interactions evolve at a very slow rate than the normal proteins. Kim et al revealed that the rate of mutation of hub is not only influenced by the number of its interacting partners, but also, by the amount of the protein surface involved in interaction with other proteins [17].
It has been shown in previous studies that the hub proteome is strongly biased towards certain amino acids. The large part of this bias is accounted by frequent peculiar low-complexity sequences, characterized by a redundant usage of few amino acids. Also these amino acids evolve at a different mutation rate [17]. Amino acids of disorder region lacks hydrophobic amino acid, contains more hydrophilic and charged residues [18] and, the low complexity region is enriched with cysteine and glutamine amino acids [19].
ISSN(E): 2277-128X, ISSN(P): 2277-6451, DOI: 10.23956/ijarcsse/V7I8/0147, pp. 212-218
II. MATERIALS AND METHODS A. Data set
Six model organisms H.sapiens, E.coli, S.cerevisiae, C.elegans, D. melanogaster and A.thaliana were selected for the present study, because of their rich interaction data. Protein-Protein interaction data for all the selected model organism were downloaded from InterPro database [27]. These data were further curated to identify the interaction partners for each protein and their corresponding sequences were obtained from Uniprot [28].
The degree of connectivity of proteins in the interaction data set had a maximum interaction of 854 for H. sapiens, 1022 for A. thaliana, 320 for C. elegans, 1161 for D. melanogaster, 793 for E. coli and 4449 for S. cerevisiae. Connectivity threshold should be determined to categorize a protein as a hub protein. According to previous studies, the connectivity thresholds of hub proteins are species specific [29],[30]. This connectivity fold change was obtained using the ratio of the connectivity value and average connectivity. For the model organism E. coli, a node with fold change greater than or equal to 2 have been used as the criterion to classify the protein as hub. Summary of protein interaction data of model organisms and fold cutoff used in this study is depicted in Table I.
Table I. Protein Protein Interactions Selected in This Study
Items E.coli C.elegans H.sapiens A.thaliana D.melanogaster S.cerevisiae
Proteins 5231 9714 10284 8498 13162 6535
Interactions 45527 40480 112754 47703 101011 255965
Average Connectivity 8.7033 4.16718 10.964 5.613 7.67444 39.1683
Fold cutoff to hubness >2 >1 >10 >1 >10 >10
B. Sequence features
Hub protein sequences of each model organisms were analyzed for three sequence features: disorder protein region, low complexity region and these regions containing a minimum length of 30 amino acids. Disopred available at http://bioinf.cs.ucl.ac.uk/disopred/ were used to identify the disorder regions [31]. DISOPRED is one of the top-ranking disorder prediction tools evaluated at the ‗Critical Assessment of Techniques for Protein Structure Prediction (CASP) conference [32]. SEG were used to identify the low complexity regions and it was downloaded from the ftp site
ftp://ftp.ncbi.nlm.nih.gov/pub/seg/ [19]. Domains which were rich with disorder regions and low complexity regions with
minimum length of 30 amino acids were further selected for the study.
C. Matrix constructions
The crucial step in the matrix generation is the selection of domains involved in identifying hub proteins. The alignment of the disorder and LCR rich domain were used to generate the scoring matrix using an implementation of method described by Dayhoff [33]. Sequence regions were aligned using Darwin workbench [35]. As a initial step, all possible amino acid transitions in each column of the alignment were counted and the basic mutation data matrix was obtained. After the mutation data matrix was completed, normalized frequency of amino acid(fi) and mutation
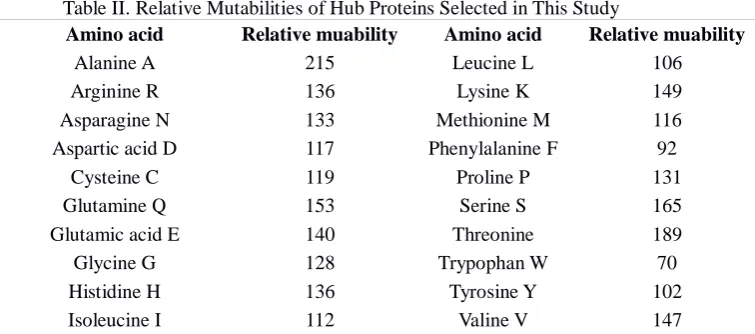
probability matrix (Mij) were computed. The relative mutabilities of the amino acids are shown in Table II. Logarithm of
odds ratio was obtained using the mutation probability matrix and amino acid frequency.
Oddsij = Mij/fj
Sij = log10(Odds ij )
The normalized frequency fj gives the probability that i will occur in the second sequence by chance.
Table II. Relative Mutabilities of Hub Proteins Selected in This Study
Amino acid Relative muability Amino acid Relative muability
Alanine A 215 Leucine L 106
Arginine R 136 Lysine K 149
Asparagine N 133 Methionine M 116
Aspartic acid D 117 Phenylalanine F 92
Cysteine C 119 Proline P 131
Glutamine Q 153 Serine S 165
Glutamic acid E 140 Threonine 189
Glycine G 128 Trypophan W 70
Histidine H 136 Tyrosine Y 102
Isoleucine I 112 Valine V 147
D. Database searching and Performance evaluation
ISSN(E): 2277-128X, ISSN(P): 2277-6451, DOI: 10.23956/ijarcsse/V7I8/0147, pp. 212-218
the matrix. These matrices were assessed using the similarity search studies, based on its ability to identify the hub proteins. Similarity search was carried out with a scoring parameter of gap existence = 11 and a gap extension = 1. Bayesian bootstrap method developed by Price et al [40],[41] were used to evaluate the statistical significance of the substitution matrices on SSEARCH results. This pairwise sequence comparison and evaluation method (PSCE) uses coverage vs. errors per query (CVE) as a means to evaluate the effectiveness of the substitution matrices.
III. RESULTS AND DISCUSSION A. Amino acid compositional bias in Hub and Non hub proteins
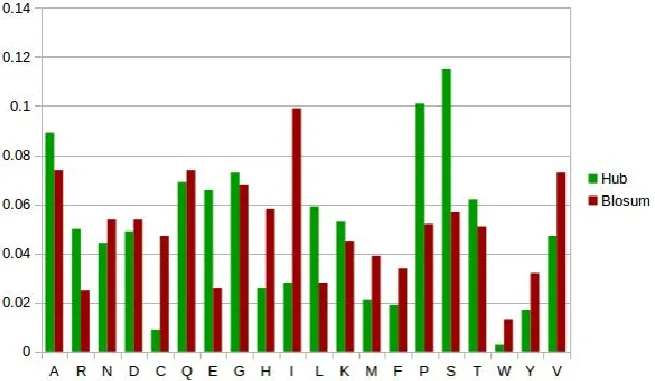
The amino acid composition of Hub proteins was compared with amino acid frequencies derived from non hub or general proteins. Fig. 1 shows the frequency distribution of normal and hub proteins. This allowed us to establish which amino acids were relatively over and under- represented between the hub and non hub proteins. Disorder regions of hub proteins contains very few hydrophobic amino acids. According to Williams et al [18] disordered regions of hub proteins have a propensity for amino acids alanine, arginine, glycine, glutamine, serine, proline, glutamic acid and lysine (A, R,G, Q, S, P, E and K). Similarly it disfavors the presence of amino acids such as Tryptophan, cysteine, phenylalanine, isoleucine, tyrosine, valine and Asparagine (W, C, F, I, Y, V, L and N).
Fig. 1 Amino acid composition of Hub protein and Normal protein
As expected, the fraction of hydrophobic residues in the low complexity and disorder rich regions of hub proteins are very low when compared to normal proteins. Serine is the most common residue followed by proline, alanine, and glycine. Nevertheless, there are differences in the amino acid composition of hub proteins with the notable exception of amino acids Aspartic acid, Glutamic acid and Methionine. These amino acids behave similarly and are consistent in both the proteins. Previous studies revealed that the low complexity regions are ―glutamine-rich‖ and ―glycine-proline-rich‖[19]. Fig. 1 clearly indicates the glycine, glutamine and proline abundancy in its amino acid composition.
Similarly the amino acid frequency of Hub proteins were also compared with frequencies derived from BLOSUM62. Differences in the compositional bias between Hub and BLOSUM62 amino acid frequency is similar to that of differences observed in normal proteins. Amino acids glycine and glutamine are consistent in Hub and BLOSUM62 data set. The accumulated percentage for the amino acids A, R,G, Q, S, P, E and K in the hub data set is (61.3%), in the normal data set is (45.8%) and in BLOSUM62 data set is (47.8%).
ISSN(E): 2277-128X, ISSN(P): 2277-6451, DOI: 10.23956/ijarcsse/V7I8/0147, pp. 212-218
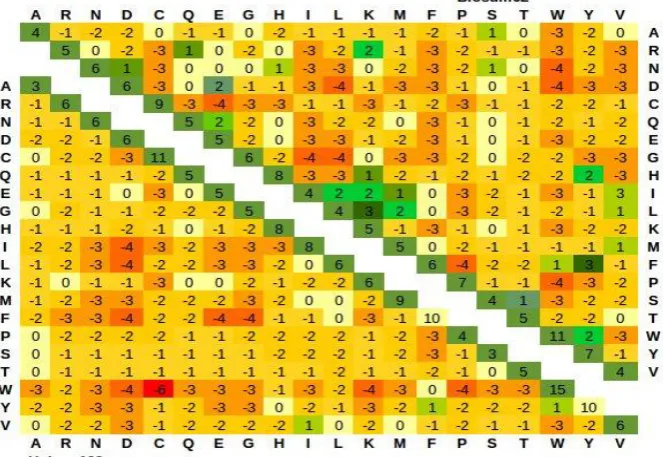
Fig. 3 Comparison of BLOSUM62 and Hubsm250 matrix. The BLOSUM62 matrix is given on the upper right, while `Hubsm250 matrix is given on the lower left. Positive substitution scores are coloured green, while negative scores are in
red. Deeper colours represent more positive/negative scores.
B. Hubsm: a substitution matrix for Hub proteins
Pairwise alignments of disorder and low complexity rich domains of different model organisms were used for the computation of amino acid substitution matrix. The matrix was constructed using the similar algorithm implemented for the computation of PAM series of matrices [33]. Unlike PAM matrices, which were built using closely related sequences, the present study involves hub proteins of different model organisms. Investigating the elements of the substitution matrix in Fig. 3 and Fig. 4 the mutability of each amino acid residue were studied. As reported earlier, the computed amino acid substitution matrix coincides with the favorable amino acids proposed by Williams et al [18]. Substitution of amino acids by disfavorable residue to a preferred residue yields a large negative score in the substitution matrix. This indicates that the conserved disorder and low complexity rich regions of hub proteins did not prefer an unfavorable amino acid to break the constancy. Hubsm250 and Hubsm100 matrices were compared with BLOSUM62 in Figure 3, 4. There are notable differences between the matrices. Furthermore, amino acid pairs have more negative score in Hub matrix, when compared to BLOSUM matrix. Substitution between tryptophan and cysteine is tolerable in BLOSUM62 where as in Hub matrix series it yields a high negative score indicating it as a unfavorable substitution.
Fig 4. Comparison of BLOSUM62 and Hub matrix. The BLOSUM62 matrix is given on the upper right, while Hubsm 100 matrix is given on the lower left. Positive substitution scores are coloured green, while negative scores are red.
ISSN(E): 2277-128X, ISSN(P): 2277-6451, DOI: 10.23956/ijarcsse/V7I8/0147, pp. 212-218
Favorable amino acid pairs such as AR, AP, AS, SP, SQ, SE have tolerable scores and are slightly improved when compared to BLOSUM62 matrix. Similarly unfavorable amino acid pairs such as AW, CW, EF, GF have larger negative scores in hub series matrix than the BLOSUM matrix. The lower score signifies that, these amino acid pairs are strongly forbidden in the substitution of amino acid.
C. Performance in searching
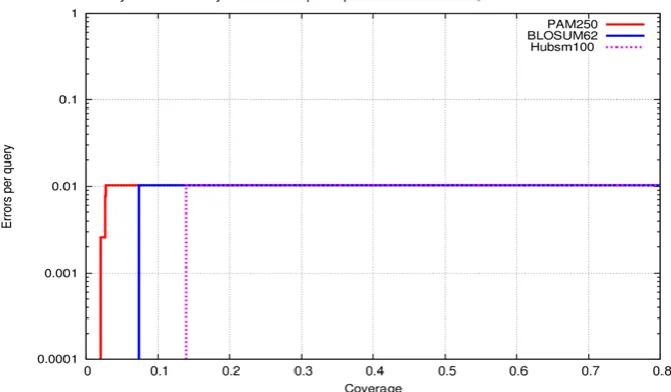
To evaluate the ability and performance of the computed substitution matrix, the study focused on whether the sequence alignments with Hubsm100 and Hubsm250 performs better than BLOSUM62 and PAM250 for hub sequences. An unique test set of more than 350 hub sequences with Astral based id were constructed and homologous search was performed. Using the SSEARCH, all against all sequence alignment was performed on the test set. SSEARCH results on the test set using Hubsm matrix were compared with other matrices.
Fig 5. CVE plot showing the performance difference between the BLOSUM62, PAM250 and Hubsm250matrices.
Fig 6. CVE plot showing the performance difference between the BLOSUM62, PAM250 and Hub100matrices.
ISSN(E): 2277-128X, ISSN(P): 2277-6451, DOI: 10.23956/ijarcsse/V7I8/0147, pp. 212-218
IV. CONCLUSION
It has been well established that compositional bias in the amino acid can influence the sequence alignment thus affecting the accuracy of homologous searches. It is evident by the over representation of glycine and cysteine rich classes of low complexity region and favorable amino acid of disorder region. There are remarkable differences between the current approach and of Dayhoff method which accounts for the better performance of Hubsm matrices. The crucial steps in the matrix generation are the selected domain involved in identifying hub proteins. The newly computed Hubsm matrices are better suited to study and compare hub proteins improving the classification and accuracy of evolutionary study for members of hub protein family. Using the Hubsm100 matrix in the homologous search, more homologs are identified with reduced number of false positive hits. The present study confirms the usage of newly computed Hubsm matrix improves the accuracy of sequence alignment and homologous based search in hub proteins.
ACKNOWLEDGMENT
This work has been supported by State Inter University Centre of Excellence in Bioinformatics (SIUCEB), AiCADD aned DBT-BIF.
REFERENCES
[1] Philip M Kim , Andrea Sboner, Yu Xia and Mark Gerstein. ―The role of disorder in interaction networks: a structural analysis‖. Molecular systems biology 2008, 4 (1), 17.
[2] Barabasi AL, Oltvai ZN. ―Network biology: understanding the cell‘s functional organization‖. Nat Rev Genet 2004, 5: 101–113.
[3] Jeong, H.; Mason, S. P.; Barabasi, A. L.; Oltvai, Z. N. ―Lethality and centrality in protein networks‖. Nature 2001, 411, 41-42.
[4] Dunker AK, Cortese MS, Romero P, Iakoucheva LM, Uversky VN. ―Flexible nets. The roles of intrinsic disorder in protein interaction networks‖. FEBS J 2005 272: 5129–5148.
[5] Wright PE, Dyson HJ. ―Intrinsically unstructured proteins: re-assessing the protein structure-function paradigm‖. J Mol Biol 1999, 293:321–331.
[6] Xie H, Vucetic S, Iakoucheva LM, Oldfield CJ, Dunker AK, Uversky VN, Obradovic Z. ―Functional anthology of intrinsic disorder. 1. Biological processes and functions of proteins with long disordered regions‖. J Proteome Res, 2007, 6: 1882–1898.
[7] Iakoucheva LM, Radivojac P, Brown CJ, O‘Connor TR, Sikes JG, Obradovic Z, Dunker AK. ―The importance of intrinsic disorder for protein phosphorylation. Nucleic Acids Res 2004, 32: 1037–1049.
[8] Beltrao P, Serrano L. ―Comparative genomics and disorder prediction identify biologically relevant SH3 protein interactions‖.PLoS Comput Biol 2005, 1: e26.
[9] Fuxreiter M, Tompa P, Simon I. ―Local structural disorder imparts plasticity on linear motifs‖. Bioinformatics 2007, 23: 950–956.
[10] Chad Haynes, Christopher J Oldfield, Fei Ji, Niels Klitgord, Michael E Cusick, Predrag Radivojac, Vladimir N
Uversky, Marc Vidal, Lilia M Iakoucheva. ―Intrinsic Disorder Is a Common Feature of Hub Proteins from Four Eukaryotic Interactomes‖. PLoS Computational Biology 2006, 2(8): e100.
[11] Dunker AK, Obradovic Z, Romero P, Garner EC, Brown CJ. ―Intrinsic protein disorder in complete genomes‖.
Genome Inform (2000), 11: 161–171.
[12] Ward JJ, Sodhi JS, McGuffin LJ, Buxton BF, Jones DT. ―Prediction and functional analysis of native disorder in
proteins from the three kingdoms of life‖. J Mol Biol 2004,337: 635–645.
[13] Wootton, J. C.; Federhen, S. ―Statistics of local complexity in amino acid sequences and sequence databases‖.
Comput. Chem. (Oxford) 1993, 17, 149-163.
[14] Wootton, J. C. ―Sequences with ―unusual‖ amino acid compositions‖. Curr. Opin. Struct. Biol. 1994, 4, 413-421.
[15] Tompa, P. ―Intrinsically unstructured proteins evolve by repeat expansion‖. Bioessays 2003, 25, 847-855.
[16] Zsuzsanna Dosztanyi, Jake Chen, A. Keith Dunker, Istva n Simon, and Peter Tompa. ―Disorder and Sequence
Repeats in Hub Proteins and Their Implications for Network Evolution‖.J. Proteome Res., 2006, 5,2985-2995.
[17] Kim PM, Lu L, Xia Y, Gerstein M. ―Relating 3D structures to protein networks provides evolutionary insight.
Science 2006, 314:1938–1941.
[18] Williams RM, Obradovi Z, Mathura V, Braun W, Garner EC, Young J, Takayama S, Brown CJ, Dunker AK.
―The protein non-folding problem: amino acid determinants of intrinsic order and disorder‖. Pac Symp Biocomput. 2001, 6, 89-100.
[19] Wootton, J. C.; Federhen, S. ―Statistics of local complexity in amino acid sequences and sequence databases‖.
Comput. Chem. (Oxford) 1993, 17, 149-163.
[20] William R. Pearson. ―Selecting the Right Similarity-Scoring Matrix‖. Curr Protoc Bioinformatics. 2013; 43:
3.5.1–3.5.9.
[21] Altschul SF, Wootton JC, Gertz EM, Agarwala R, Morgulis A, et al. ―Protein Database Searches Using
Compositionally Adjusted Substitution Matrices‖. FEBS J, 2005, 272: 5101–5109.
[22] Yu YK, Altschul SF. ―The construction of amino acid substitution matrices for the comparison of proteins with
non-standard compositions‖. Bioinformatics. 2005;21(7):902–11.
[23] Ng PC, Henikoff JG, Henikoff S. ―PHAT: a transmembrane-specific substitution matrix. Predicted hydrophobic
ISSN(E): 2277-128X, ISSN(P): 2277-6451, DOI: 10.23956/ijarcsse/V7I8/0147, pp. 212-218
[24] Sutormin RA, Rakhmaninova AB, Gelfand MS. ―BATMAS30: amino acid substitution matrix for alignment of
bacterial transporters‖. Proteins.2003;51(1):85–95.
[25] Predrag Radivojac, Zoran Obradovic, Celeste J. Brown and A. Keith Dunker. ―Improving sequence alignments
for intrinsically disordered proteins‖. Proceedings of Pacific Symposium on Biocomputing, 2002, 589-600.
[26] Rios S, Fernandez MF, Caltabiano G, Campillo M, Pardo L, Gonzalez A. ―GPCRtm: An amino acid substitution
matrix for the transmembrane region of class A G Protein-Coupled Receptors‖. BMC Bioinformatics, 2015,16:206. pmid:26134144.
[27] Finn, RD; Attwood, TK; Babbitt, PC; Bateman, A; Bork, P; Bridge, AJ; Chang, HY; Dosztányi, Z; El-Gebali, S;
Fraser, M; Gough, J; Haft, D; Holliday, GL; Huang, H; Huang, X; Letunic, I; Lopez, R; Lu, S; Marchler-Bauer, A; Mi, H; Mistry, J; Natale, DA; Necci, M; Nuka, G; Orengo, CA; Park, Y; Pesseat, S; Piovesan, D; Potter, SC; Rawlings, ND; Redaschi, N; Richardson, L; Rivoire, C; Sangrador-Vegas, A; Sigrist, C; Sillitoe, I; Smithers, B; Squizzato, S; Sutton, G; Thanki, N; Thomas, PD; Tosatto, SC; Wu, CH; Xenarios, I; Yeh, LS; Young, SY; Mitchell, AL. "InterPro in 2017-beyond protein family and domain annotations." Nucleic Acids Res 2017, 45 (D1): D190-D199.
[28] UniProt, Consortium. "UniProt: a hub for protein information". Nucleic acids research. 2015' 43 (Database
issue): D204–12.
[29] Kyaw Tun, Raghuraj Keshava Rao, Lakshminarayanan Samavedham, Hiroshi Tanaka and Pawan K. Dhar. Rich
can get poor: conversion of hub to non-hub proteins Syst Synth Biol (2008) 2:75–82.
[30] Aswathi Balakrishnan Latha, Achuthsankar Sukumaran Nair, Athmaja Sivasankaran, and Pawan Kumar Dhar.
―Identification of hub proteins from sequence‖. Bioinformation, 2011; 7(4): 163–168.
[31] Ward, J.J., McGuffin, L. J., Bryson K., Buxton, B. F. & Jones, D.T. ―The DISOPRED server for the prediction
of protein disorder‖. Bioinformatics, 2004, 20, 2138-2139.
[32] Moult J, Fidelis K, Kryshtafovych A, Rost B, Hubbard T, Tramontano A. ―Critical assessment of methods of
protein structure prediction—Round VII‖. Proteins Struct Funct Bioinform 2007, 69 (S8):3–9.
[33] Dayhoff MO, Schwartz RM, Orcutt BC. ―A model of evolutionary change in proteins‖. Atlas of protein
sequence and structure, 1978;5(3):345–51.
[34] Henikoff S, Henikoff JG. ―Amino acid substitution matrices from protein blocks‖. Proc Natl Acad Sci U S A,
1992;89(22):10915–9.
[35] Gonnet GH, Cohen MA, Benner SA. ―Exhaustive matching of the entire protein sequence database‖. Science,
1992;256(5062):1443–5.
[36] Chandonia JM, Walker NS, Lo Conte L, Koehl P, Levitt M, Brenner SE. ―ASTRAL compendium
enhancements‖. Nucleic Acids Research, 2002, 30;260-263.
[37] Brenner SE, Koehl P, Levitt M. ―The ASTRAL compendium for sequence and structure analysis‖. Nucleic
Acids Research. 2000, 28;254-256.
[38] Smith, Temple F. & Waterman, Michael S. ―Identification of Common Molecular Subsequences‖. Journal of
Molecular Biology, 1981, 147:195–197.
[39] Pearson WR. ―Searching protein sequence libraries: comparison of the sensitivity and selectivity of the
Smith-Waterman and FASTA algorithms‖. Genomics, 1991, 11[3]:635–50.
[40] Green RE, Brenner SE. ―Bootstrapping and normalization for enhanced evaluations of pairwise sequence
comparison‖. Proc IEEE, 2002, 90[12]:1834–1847.
[41] Price GA, Crooks GE, Green RE, Brenner SE. ―Statistical evaluation of pairwise protein sequence comparison
with the Bayesian bootstrap‖. Bioinformatics, 2005, 21[20]:3824–831.
[42] Romero, P.; Obradovic, Z.; Li, X.; Garner, E. C.; Brown, C. J.;Dunker, A. K. ―Sequence complexity of