CONTINUING CARE THROUGH TELE-COUNSELLING IN ALCOHOL DE-ADDICTION PROGRAM–A RANDOMIZED CONTROLLED STUDY
Submitted
BY
DR.PRANESH .R. R. MBBS
Dissertation submitted to
THE TAMILNADU DR.M.G.R. MEDICAL UNIVERSITY, CHENNAI, In partial fulfilment of the requirements for the degree of
DOCTOR OF MEDICINE IN PSYCHIARY 2014
Under the guidance of Dr. G. RAGHUTHAMAN
Professor & Head
DEPARTMENT OF PSYCHIATRY,
DECLARATION BY THE CANDIDATE
I hereby declare that this dissertation entitled “Continuing care through tele-counselling in alcohol de-addiction program–A randomized controlled study”is a
bonafide and genuine research work carried by me under the guidance of Dr. G.Raghuthaman, Prof and Head, Department of Psychiatry, PSGIMS & R,
Coimbatore.
PLACE: COIMBATORE DR.PRANESH.R.R
CERTIFICATE BY THE GUIDE
This is to certify that this dissertation entitled“Continuing care through tele -counselling in alcohol de-addiction program–A randomized controlled study
” is a bonafide work done by
Dr.Pranesh.R.R.
in partial fulfilment of the requirement for the degree of M.D (PSYCHIATRY)PLACE: COIMBATORE DR.G. RAGHUTHAMAN M.D
DATE: PROFESSOR & HEAD
DEPARTMENT OF PSYCHIATRY
ENDORSEMENT BY THE HOD/PRINCIPAL OF THE INSTITUTION
This is to certify that this dissertation“Continuing care through tele-counseling in alcohol de-addiction program– A randomized controlled study”is a bonafide research work done
by Dr.PRANESH.R.R under the guidance of Dr. G. RAGHUTHAMAN, Professor & Head, Department of Psychiatry, PSGIMS&R, Coimbatore.
Dr. RAMALINGAM M.D DR. G. RAGHUTHAMAN M.D
Principal, Prof. and Head.
PSGIMS&R, Department of Psychiatry, Coimbatore. PSGIMS&R, Coimbatore
DATE:
ACKNOWLEDGEMENT
At the outset, I thank God for giving me the strength to perform all my
duties.
It is indeed a great pleasure to recall the people who have helped me in
the completion of my dissertation. Naming all the people who have helped me
in achieving this goal would be impossible, yet I attempt to thank a selected
few who have helped me in diverse ways.
I acknowledge and express my humble gratitude and sincere thanks to my
beloved teacher and guideDr. G. Raghuthaman,M.D (Psychiatry), Professor &
HOD, Department of Psychiatry, PSGIMS&R, Coimbatore for his valuable
suggestion, guidance, great care and attention to details, that he has so
willingly shown in the preparation of this dissertation.
I owe a great deal of respect and gratitude to all my Professors,
Associate Professors and Assistant Professors, Department of Psychiatry,
PSGIMS&R, Coimbatore for their whole hearted support for completion of this
dissertation.
I am immensely indebted to my parents who have inculcated the proper
habits and characters in me.
My sincere thanks to all my post graduate colleagues and my friends for
their whole- hearted support.
Finally, I thank my patients who formed the backbone of this study,
without them this study would have not been possible.
PLACE: Dr.PRANESH.R.R
INDEX
S No.
Table of Contents
Page Number
1.
Abstract
16
2.
Introduction
18
3.
Rationale for the
study
21
4.
Review of Literature
22
5.
Aims and objectives
31
6.
Methodology
32
7.
Results
40
8.
Discussion
43
9.
Limitations
104
10.
Conclusion
106
11.
Bibliography
107
LIST OF TABLES
TABLE 1: BASELINE SOCIO DEMOGRAPHIC DETAILS OF THE STUDY SAMPLE
TABLE 2: BASELINE CLINICAL CHARACTERISTICS OF THE STUDY SAMPLE
TABLE 3: BASELINE ALCOHOL PROFILE OF STUDY SAMPLE
TABLE 4: ABSTINENT EPISODES PROFILE OF STUDY SAMPLE
TABLE 5:BASELINE HISTORY OF COMPLICATED WITHDRAWAL SYMPTOMS
TABLE 6 :BASELINE ALCOHOL SEVERITY PROFILE OF SAMPLE
TABLE 7:BASELINE MOTIVATION PROFILE OF STUDY SAMPLE
TABLE 8: DEADDICTION TREATMENT PROFILE OF STUDY SAMPLE:
TABLE 9: HOSPITAL STAY DURATION
TABLE 10:BENZODIAZEPINE USAGE DETAILS OF STUDY SAMPLE
TABLE 11:ABSTINENT MAINTAINING MEDICATIONS
TABLE 12: ABSTINECE AND RELAPSE OUTCOME IN TCC AND TAU GROUPS:
TABLE 13: ABSTINECE AND RELAPSE OUTCOME IN TCC AND TAU GROUPS:
TABLE 15: DRINKING PERCENTAGE DAYS IN TWO GROUPS:
TABLE 16: COMPARISON OF DRUG COMPLIANCE BETWEEN TWO GROUPS
TABLE 17: COMPARISON OF LENGTH OF FOLLOW- UP BETWEEN TWO GROUPS
TABLE 18: COMPARISON OF GROUP VISITS ATTENDANCE BETWEEN TWO GROUPS
TABLE 19: COMPARISON OF RE-ADMISSIONS BETWEEN TWO GROUPS
TABLE 20: COMPARISON OF DROP-OUTS BETWEEN TWO GROUPS
TABLE 21 : COMPARISON OF DRINKING FREQUENCY WITH THEIR BASELINE
TABLE 22: ASSOCIATION OF STUDY GROUP AND RELAPSE RISK
TABLE 23: ASSOCIATION OF SOCIODEMOGRAPHIC FACTORS AND RELAPSE:
TABLE 24: ASSOCIATION OF OTHER BASELINE DETAILS AND RELAPSE
TABLE 25: ASSOCIATION OF ALCOHOL PROFILE AND RELAPSE:
TABLE 26: ASSOCIATION OF TREATMENT VARIABLES AND RELAPSE
TABLE 27: ASSOCIATION OF FOLLOW UP TREATMENTS AND RELAPSE
TABLE 29: COMPARISON OF DEMOGRAPHIC AND BASELINE ALCOHOL PROFILE OF SAMPLE IN OUR STUDY WITH OTHER INDIAN OUTCOME STUDIES
TABLE 30 : COMPARISON OF POSITIVE FAMILY HISTORY OF ALCOHOLISM WITH OUTCOME STUDIES
TABLE 31 : COMPARISON OF ABSTINENT RATE BETWEEN TWO GROUPS AT EACH MONTH
TABLE 32: COMPARISON OF ABSTINENT RATE WITH OTHER OUTCOME STUDIES
LIST OF FIGURES
FIGURE 1: FLOW CHART DESCRIBING THE METHODOLOGY
FIGURE 2: COMPARISON OF ABSTINENCE BETWEEN TWO GROUPS
FIGURE 3: COMPARISON OF DRUG COMPLIANCE BETWEEN TWO GROUPS
FIGURE 4: COMPARISON OF LENGTH OF FOLLOW UP BETWEEN TWO GROUPS
FIGURE 5: COMPARISON OF GROUP VISITS ATTENDANCE BETWEEN TWO GROUPS
FIGURE 6: COMPARISON OF MONTHLY DRINKING FREQUENCY OF RELAPSED PATIENTS
LIST OF APPENDICES
APPENDIX 1: SCID QUESTIONNAIRE
APPENDIX 2: DSM–IV-TR ALCOHOL DEPENDENCE CRITERIA-DIAGNOSTIC CODE 303.90
APPENDIX 3: SADQ–C SEVERITY OF ALCOHOL DEPENDENCE QUESTIONAIRE
APPENDIX 4: SADQ–C SEVERITY OF ALCOHOL DEPENDENCE QUESTIONAIRE (TAMIL VERSION)
APPENDIX 5: URICA–ENGLISH VERSION
APPENDIX 6: URICA (TAMIL VERSION)
APPENDIX 7: INFORMED CONSENT
APPENDIX 8: INFORMED CONSENT (TAMIL VERSION)
-ABSTRACT
Continuing Care Through Tele-Counselling in Alcohol De-Addiction
Program–A Randomized Controlled Study
INTRODUCTION
There is a rising trend of alcohol addiction in our Indian society. Promised by
the effectiveness of western studies in using telephone based counselling
services and the availability of extensive mobile phone services in our part, we
did this novel study, first of this kind in India
Type of the study: Prospective randomized controlled study
METHODOLOGY:
We recruited admitted in-patients qualified for alcohol dependence and
randomized them at the time of discharge into two groups: 1) ‘Telephone Continuing Care’ group(TCC) who received pro-active contact and
counselling through mobile phones from the treatment team at 1st, 2nd, 4th, 8th,
12th, 16th, 20thand 24th week after discharge. 2)‘Treatment-As-Usual’ group (TAU) received usual out-patient follow-up care. We contacted patients and
their care-givers, belonging to both groups, each month over mobile phone and
drinking percentage days and treatment adherence rates. By including all the
variables, we did logistic regression to predict relapse.
RESULTS
There was no statistical significance between two groups in terms of
abstinence rate (TCC: 66.7% and TAU: 55.6%); however among the group
from whom complete data was obtained abstinence rate was slightly better in
TCC group (TCC: 67.9% and TAU: 43.8%, p=0.06). There was no difference
in the drinking percentage days.TCC group was significantly better than TAU
group in having longer duration of follow-up, good drug compliance, adherence
to group meetings and lower dropout rate. Logistic regression revealed that
family history of alcoholism, three weeks admission for de-addiction, drug
compliance and length of follow-up were found to be significant predictors of
relapse.
CONCLUSION
Telephone continuing care showed few positive findings in improving the
outcome and this could be included in the armamentarium of de-addiction
program.
INTRODUCTION:
Alcohol dependence is a chronic condition with multiple
relapses. According to WHO statistics, in 2010-11, there were nearly 1.8
million alcohol related deaths which is 3.2% of total deaths in that year. In India
alone, there were 62.5 million alcohol users with 17.4% of them (10.6 million)
fulfilling criteria for dependence [1, 2].
Treatment of alcohol addiction is a challenging task, requiring
a multistep approach for sustaining recovery from addiction. Treatment
focussing mainly on ‘acute crisis management’ of alcohol dependence failed to give sustained recovery due to higher relapse rates [3, 4, and 5]. Many outcome
studies[6,7,8,9] proved extended continuing care in managing alcohol addiction
to be effective. This continuing care is comparable to the care in managing
chronic mental illness such as Depression[10,11], Obsessive Compulsive
Disorders[12,13] and as well as in chronic physical diseases such as
Dropout rate was high in case of ‘face-to-face interview type’ continuing care [17, 18, and 19]. This could be because of stigma attached to
visiting mental health centres [20, 21, and 22] shortage of manpower,
inadequate infrastructure and long distance with difficult transportation
facilities. So, there is a need for an alternative to the usual ‘face-to-face interview type’ of continuing care. Telephone based follow up care offers a more feasible form oftaking care of patients’ inconveniences[23, 24].
American Society of Addiction Medicine 2001[25] and McKay 2005[26]
clearly reported about effectiveness of both ‘face to face interview’ and ‘telephone based’ continuing care in treating substance use disorders. Other studies focussing on continuing care through telephone also proved benefits in
controlling alcohol addiction [3,24,27,28,29] , other substance use
All the above studies were done in western countries and there is no
published research in India, where the need of telephone based continuing care
is large.
According to the report of Ministry of Telecommunications [34],
India has 9435.03 lakhs of telephone connections (Urban - 6187.72 lakhs and
Rural - 3247.31 lakhs). Currently, our tele-density stands at 78.10% and it has
been increasing by 12.7% every year. With more than two-thirds of the
population having access, telephone based follow-up care could be feasible and
effective among patients.
There is a rising trend of alcohol addiction in our Indian society [35, 36]
and the traditional de-addiction treatments had yielded abstinence rates of
12.3% [17], 32.5% [37] and 55% [38]. Such a low success rate is not acceptable
and we have to look for alternative mode which improves treatment delivery
RATIONALE OF THE STUDY:
Promised by the effectiveness of western studies in using telephone based
counselling services and the availability of extensive mobile phone services in
our part, we had planned this study.
Among patients who received in-patient treatment for alcohol dependence
syndrome, we compared the effectiveness of abstinence rates and compliance
REVIEW OF LITERATURE:
Alcohol dependence and its effective management was always a
tricky condition. Successful treatment depends on several factors. Search for
effective tools in improving the outcome of treatment of alcohol addiction has
always been a burning issue.
Telephone based interventions have been studied previously. Considering
easy availability and cost effectiveness, studies have shown telephone based
interventions to be helpful in improving the outcome results in common
non-communicable disorders such as Diabetes and Hypertension [14, 15].
Similarly, to improve the outcome measures in the management of substance
disorders, few studies have been carried out [4, 7]. Results in substance
Hubbard et al (2007) [30] carried out a study to find out the effectiveness
of telephone based interventions in management of nicotine disorders. Study
showed better outcomes in patients had received telephone based interventions
in smoking cessation. Similarly, other outcome studies and meta-analytic
review on substance disorders showed encouraging results in controlling
substance disorders. [29, 32, 33]
There were many studies done in western countries to find out the ways of
improving outcome measures in the management of alcohol addiction. [3, 6, 18]
Continuing care through telephone based counselling forms the recent decade
trend of improving management strategies for substance disorders.
Most of the studies were longitudinal prospective studies to find out
effectiveness of tele-counselling in alcohol de-addiction programme. Very few
were randomized controlled trials comparing telephone based continuing care
In 2010, Godley et al [6] did their study in Illinois, United States. Their
study included 104 subjects fulfilling criteria for alcohol dependence, who were
admitted for residential treatment for alcohol de-addiction. They were
randomized into two groups.
One group, telephone based continuing care, comprised of 51 patients who
received proactive tele-counselling for first three months and the other group,
usual continuing care, comprised of 53 subjects. Mean age of subjects was
31.6 years. They were followed up for 6 months period.
Telephone based care group received counselling sessions from the treating
team once a week in the first month and then every fortnight over the next two
months. In last three months, they were contacted once a month.
At the end of 6 months study, there was no significant difference in the
abstinence rate between the two groups (87.39 % in telephone group vs. 84.64
% in usual treatment group). But in the lower severity group of alcohol
dependent patients, there was a statistical significant difference in the
abstinence rate at the end of 3 months, however this statistical significance was
Similarly, there was no significant difference in outpatient session
attendance and Substance Problem Scale between two groups. Although there
was a trend towards significance at the end of three months (0.06), there was no
major difference in outcome measures between two groups.
Mckay et al (2005) [3] conducted a longitudinal prospective study in
Philadelphia, United States to find out the effectiveness of telephone based
counselling in managing alcohol and cocaine disorders. The total sample was
359 subjects, of which 91 patients were having alcohol dependence alone and
remaining 268 patients were having comorbid cocaine dependence.
The sample was divided into three groups. The first group received
telephone based monitoring and brief counselling. The second group was
relapse prevention group and the third one was standard 12 step group
counselling group. Both relapse prevention group and standard 12 step group
They were followed up for 2 years and outcomes at the end of 1st year and
2ndyear were published.
At the end of first year, the study did not find any superiority of telephone
based monitoring group in outcome measures over face-face interventional
groups.
At the end of 2 years, telephone based group had higher rates of total
abstinence than standard 12 step counselling group (p <0.05). Also 24 month
gamma glutamyl transferase level in telephone group was lower compared to
relapse prevention face-to-face group (p=0.05).The results were more
significant for alcohol outcome measures than for cocaine.
The above few studies done in western countries compared the
effectiveness of telephone based care in treating alcohol disorders. In India,
there has not been any published article regarding telephone continuing care in
treating alcohol dependence. However, there are many outcome studies done in
India to find out the effectiveness of alcohol deaddiction treatment and
Abraham et al (1997) [37] carried out a one year prospective
study at JIPMER, Pondicherry. They recruited the patients admitted in the
hospital for alcohol de-addiction treatment, which included detoxification,
group sessions and disulfiram medications. Sixty patients were followed up for
a year.
Mean age of the sample was 39.6 years (±8.5). 81.6% of total subjects
were married. 54.5 % had family history of alcoholism.
They were advised to come for follow-up every two weeks after
discharge. Out of the 60 subjects, only 9 patients had follow-up in clinic at the
end of a year. Thirty one patients had follow-up for less than 3 months and 10
patients were attending for period of 3-6 months. The remaining 10 patients
At the end of one year, 32.5% patients remained abstinent; 35% of
patients continued drinking but improved compared to previous drinking pattern
and; 32.5% patients continued to have unimproved drinking pattern.
Chandrasekaran et al [17], 2001 did a retrospective study at
JIPMER, Pondicherry to find out follow up rates of patients treated for alcohol
addiction. They recruited 800 alcohol dependence patients treated over five
years period.
Mean age of the subjects was 39.7 years (±8.66). Recruited
patients had moderate severity of alcohol dependence, indicated by their mean
SADQ score was 23.95.
Out of 800 patients, only 28 patients (4.6%) were on regular follow
up for 1 year; 48 patients (7.9%) were on regular follow for 6-12 months and;
152 patients (25.1%) were coming for follow up for less than 6 months period,
There was a very high drop-out rate. Within one month 379 patients
(62.4%) dropped out from treatment, which is significantly high compared to
other contemporary Indian studies. [37, 38]
Kar et al [38], 2003 carried out one year prospective study in
Kasturba Medical College, Manipal.
They recruited 60 patients who fulfilled the criteria for alcohol
dependence and admitted for de-addiction treatment, which includes
detoxification, psychoeducation, aversion therapy, group therapy and disulfiram
medication.
Mean age of the sample was 42.86 years. Recruited patients had onset
of regular drinking around 30.85 years. Around 92% of the recruited patients
were prescribed disulfiram at the time of discharge. They were followed up for
At the end of one year 28 patients (46.7%) were abstinent. Five
patients (8.3%) were drinking occasionally and 21 patients were having >50%
drinking days. Remaining 6 patients (10%) were drop outs.
Greater the average age of problem drinking, lower psychosocial
problems and lack of family history of alcoholism were found to be predictors
AIMS & OBJECTIVES:
Our aim was to assess the effectiveness of providing continuing care
through telephone to patients who had received in-patient de-addiction
treatment. We also aim to find out the risk factors that would predict relapse in
the whole sample.
Our objectives are:
1. To prospectively study the abstinence rate between two groups: a)
Telephone Continuing Care (TCC) and b) Treatment As Usual (TAU).
2. To study secondary outcome measures such as drinking frequency, length
of abstinence ,drug compliance and length of follow-up in clinic in the
above 2 groups.
3. To assess the rate of abstinence and relapse among patients for whom we
got complete follow-up data for 6 months (Completers).
METHODOLOGY
All patients admitted to the Department of Psychiatry with the clinical
diagnosis of Alcohol Dependence Syndrome were administered SCID
(Structured Clinical Interview for DSM disorders) and patients who qualified
for the DSM IV TR diagnosis of Alcohol Dependence Syndrome were
recruited for our study. We assessed the severity of dependence by using the
Severity of Alcohol Dependence Questionnaire (SADQ). We assessed the
motivational level of recruited patients using University of Rhode Island
Change Assessment Scale (URICA).
SADQ is 20-item self administered questionnaire developed by
Stockwell et al [39] for assessing the severity of alcohol dependence. We used
SADQ–community version which measures the severity of alcohol dependence in last three months. It was measured in 0-3 point scale with a maximum score
of 60. A score of greater than 30 was considered as severe alcohol dependence.
University of Rhode Island Change Assessment Scale (URICA) is a
questionnaires. We used 12-item scale for the current study. The results were
described in four stages : Precontemplation, Contemplation, Action and
Maintenance. The items of SADQ and URICA were translated from English to
Tamil and back translated to English by2 independent persons. We used the
Tamil version of SADQ and URICA on our patients.
After admission, all these patients were offered the standard treatments
practised in the Department of Psychiatry. Initially all of them had
detoxification treatment and majority of them underwent de-addiction treatment
which include motivational interviews, Cue Analysis, Cue Management, Covert
Sensitization, Aversion Therapy and Group Therapy. They were discharged
with medications to maintain abstinence.
Patients who have phone connections either landline or mobile were
only included in the study. Patients with co-morbid severe mental disorder and
cognitive impairments were excluded from the study.
At the time of discharge from the hospital, we randomized the patients
into 2 groups: 1) Telephone Continuing Care (TCC) and 2) Treatment As Usual
Telephone Continuing Care (TCC):
We contacted patients belonging to this group at the following frequency:
1st, 2nd, 4th, 8th, 12th, 16th, 20thand 24thweek after discharge. During such
contacts, five-minute proactive counselling was provided on the following
themes:
a) Enquiring about abstinence and encouraging remaining so.
b) Probing for ‘craving’ and practice of ‘relapse prevention strategies’. c) Discussing health hazards he had sustained due to alcohol.
d) Ensuring compliance with medications.
e) Encouraging attendance for group therapy.
f) Advising to attend follow-up visits at the de-addiction clinic.
Patients belonging to this group also were getting the standard treatment at the
hospital: attending de-addiction clinic, participation in group therapy and seeing
their primary therapists.
Treatment As Usual (TAU):
Patients belonging to this group were receiving follow-up treatments
from their respective primary therapists. They received psychological treatment
and medications during their consultations. They were encouraged by their
Assessments:
We contacted patients and their primary carers belonging to both
the groups at 4th, 8th, 12th, 16th, 20th, 24th week over mobile phone or telephone.
During that time we conducted semi-structured interviews to get information
regarding the drinking status of the patients. In case, patient had restarted
drinking, we got the following information: number of drinking days in the
previous 4 weeks and about number of drinks per day. The information obtained
from the patients and their primary carers were recorded separately.
The primary outcomes were Abstinence and Drinking percentage days.
We analysed abstinence by dividing into 4 groups:
1) Abstinence: Patient had not touched alcohol
2) Occasional drinking: Patient had taken alcohol but not drinking every day
3) Daily drinking: Patient drinks alcohol every day but not during the day time
4) Daytime drinking: Drinking even during the day time.
We also calculated Drinking percentage days as:
Sample size estimation:
32.5% of patients remained abstinent and non-problem drinker at
the end of one year after a routine de-addiction treatment (Abraham J, 1997)
and we hypothesized that Telephone Continuing Care would improve the
abstinent rate to 60%.
The required sample size to detect this difference in the abstinent
rates between the 2 arms (keeping alpha as 0.05 and beta as 0.2), was 34
patients in each arm. Assuming dropout rate as 10%, we needed 38 patients in
ANALYSES:
Statistical analysis was conducted using SPSS version 19.0 for Windows.
All variables were checked for normality using the Kolmogorov-Smirnov
test. We did parametric tests for the normally distributed data and did
non-parametric tests for the rest.
We usedstudent’s t test to compare the following normally distributed
continuous variables: Mean time for the first drink, mean drinking days
percentage, duration of alcohol intake, duration of daily drinking, SADQ
score,
As the following continuous variables were not normally distributed we
used Mann Whitney U test to compare the mean between the groups:
onset of first drink, number of cigarettes smoked per day, abstinent
episodes, length of abstinence, SCID score, URICA score, duration of
hospital stay, length of follow-up, duration of drug compliance, group
visits and
Chi-square test and fisher’s exact test were used to compare categorical
variables: marital status, socio-economic status, telephone status,
smoking status, other substance status, co-morbid medical illness, family
components, abstinence medications and primary outcome measures:
number of patients remaining abstinent and relapsed.
In the whole sample, among patients who had complete data for 6
months, we did bivariate analyses to see whether there is any association
between relapse and the following variables:
o Socio-demographic factors, history of alcoholism in the family
o Features of alcoholism (age of onset of first drink, age of onset of
daily drinking of alcohol, duration of alcohol use, Severity of
Alcohol Dependent Questionnaire score, no. of abstinent episodes,
length of abstinent periods, history of withdrawal seizures, history
of delirium tremens)
o Level of motivation as assessed by URICA scale
o Treatment factors (length of hospital stay for de-addiction,
different components of de-addiction treatment, medications used
to maintain abstinence, drug compliance and length of follow-up in
the clinic).
We did logistic regression by including all the above variables in the
logistic model to see which variables would predict relapse. We did
Omnibus tests of model coefficients to see the significance of our model
and we did Hosmer and Lemeshow test whether our logistic model is a fit
model.
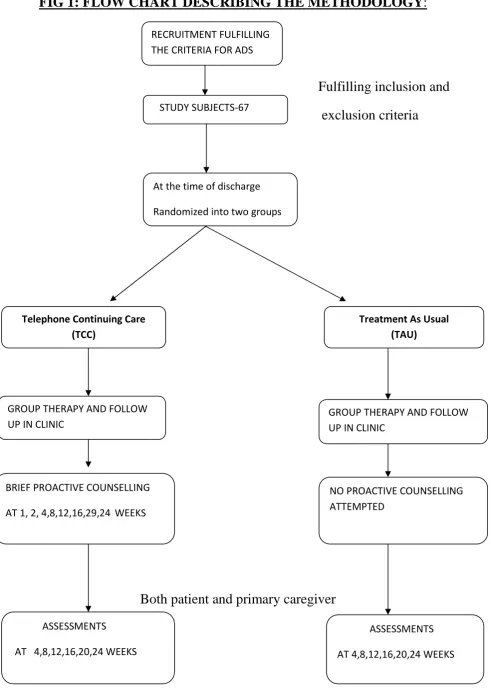
FIG 1: FLOW CHART DESCRIBING THE METHODOLOGY:
Fulfilling inclusion and
exclusion criteria
Both patient and primary caregiver RECRUITMENT FULFILLING
THE CRITERIA FOR ADS
CRSTUDY SUBJECTS-67
At the time of discharge Randomized into two groups
Telephone Continuing Care (TCC)
Treatment As Usual (TAU)
GROUP THERAPY AND FOLLOW UP IN CLINIC
GROUP THERAPY AND FOLLOW UP IN CLINIC
BRIEF PROACTIVE COUNSELLING AT 1, 2, 4,8,12,16,29,24 WEEKS
NO PROACTIVE COUNSELLING ATTEMPTED
ASSESSMENTS AT 4,8,12,16,20,24 WEEKS
RESULTS
1. Baseline profile of the study sample
2. Comparing primary and secondary outcome measures between Telephone
Continuing Care (TCC) and Treatment As Usual (TAU) groups.
3. The rate of abstinence and relapse among patients for whom we got
complete follow-up data for 6 months (Completers).
4. Among completers, predictors of relapse using bivariate analyses and
logistic regression.
There were 77 patients admitted who fulfilled the criteria for alcohol
dependence during study period. Out of 77 patients, 8 patients were excluded
because of comorbid severe mental disorder and 2 patients were not willing to
consent. Hence, remaining total of 67 patients who fulfilled the inclusion
criteria were randomly assigned to ‘Telephone Continuing Care (TCC)’and
There were 34 patients in the TCC group and 33 patients in the TAU
group. We were able to follow-up and obtain data for 60 patients for the entire 6
months and 7 patients dropped out during the course of the study (TCC=1 and
TAU=6).
1. BASELINE PROFILE OF STUDY SAMPLE:
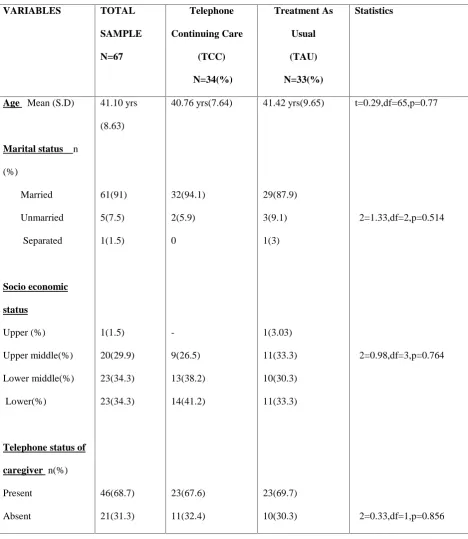
All patients were males and their mean age was 41.10 years and 91 % of
them were married. Both the groups were comparable in all the
TABLE 1: BASELINE SOCIO DEMOGRAPHIC DETAILS OF THE STUDY SAMPLE VARIABLES TOTAL SAMPLE N=67 Telephone Continuing Care (TCC) N=34(%) Treatment As Usual (TAU) N=33(%) Statistics
Age Mean (S.D)
Marital status n
(%) Married Unmarried Separated Socio economic status Upper (%) Upper middle(%) Lower middle(%) Lower(%)
Telephone status of
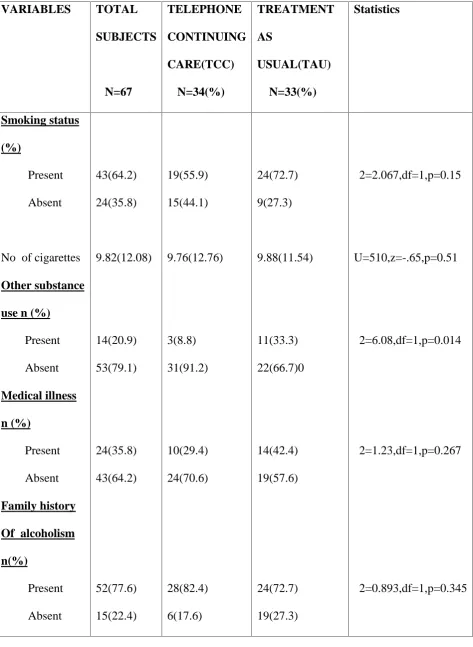
TABLE 2: BASELINE CLINICAL CHARACTERISTICS OF THE STUDY SAMPLE VARIABLES TOTAL SUBJECTS N=67 TELEPHONE CONTINUING CARE(TCC) N=34(%) TREATMENT AS USUAL(TAU) N=33(%) Statistics Smoking status (%) Present Absent
No of cigarettes Other substance use n (%)
In the total sample, 64.2% of patients were smokers and 20.9% were using
substances like tobacco chewing, cannabis, benzodiazepines and these patients
were equally represented in TCC and TAU groups. A high number of patients
(77.6%) had positive family history of alcoholism.
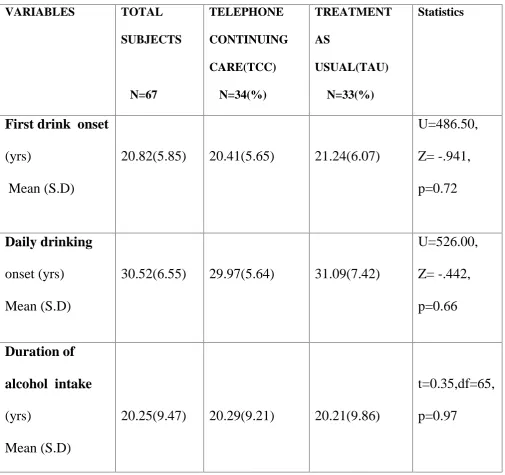
BASELINE ALCOHOL PROFILE OF STUDY SAMPLE
ONSET OF FIRST DRINK:
Mean onset of first drink of total subjects was 20.82 years. There was no
statistical significance between two groups as shown in Table.3
ONSET OF DAILY DRINKING:
Mean age of onset of daily drinking in our sample was 30.52 years. Telephone
continuing care group was having slightly earlier onset of daily drinking
compared to other group but not statistically significant as shown below in the
Table.3
DURATION OF ALCOHOL INTAKE:
Average duration of alcohol intake of total subjects was 20.25 years. Alcohol
intake duration was not statistically significant between two groups, as it was
TABLE 3: BASELINE ALCOHOL PROFILE OF STUDY SAMPLE VARIABLES TOTAL SUBJECTS N=67 TELEPHONE CONTINUING CARE(TCC) N=34(%) TREATMENT AS USUAL(TAU) N=33(%) Statistics
First drink onset
(yrs)
Mean (S.D)
20.82(5.85) 20.41(5.65) 21.24(6.07)
U=486.50, Z= -.941, p=0.72 Daily drinking onset (yrs) Mean (S.D)
30.52(6.55) 29.97(5.64) 31.09(7.42)
U=526.00, Z= -.442, p=0.66 Duration of alcohol intake (yrs) Mean (S.D)
20.25(9.47) 20.29(9.21) 20.21(9.86)
t=0.35,df=65,
ABSTINENT EPISODES PROFILE OF STUDY SAMPLE:
TABLE 4: ABSTINENT EPISODES PROFILE OF STUDY SAMPLE
VARIABLES TOTAL SUBJECTS N=67 TELEPHONE CONTINUING CARE(TCC) N=34(%) TREATMENT AS USUAL(TAU) N=33(%) Statistics Abstinent episodes Mean (S.D) 3.69 (4.41) 2.91 (3.62) 4.48(5.03) U=404.50, Z= -2.01, p=0.045* Length of abstinence Mean (S.D) 197.93 (296.63) 189.85 (282.68) 206.24(314.55) U=482.00, z=-.99, p=0.32
Patients in the TCC group had lesser number of abstinent episodes than
TAU group; however there was no statistical difference in the mean length of
HISTORY OF COMPLICATED WITHDRAWAL SYMPTOMS:
TABLE 5:BASELINE HISTORY OF COMPLICATED WITHDRAWAL SYMPTOMS VARIABLES TOTAL SUBJECTS N=67 TELEPHONE CONTINUING CARE(TCC) N=34(%) TREATMENT AS USUAL(TAU) N=33(%) Statistics Withdrawal seizures n(%) Absent Present 56(83.6) 11(16.4) 29(85.3) 5(14.7) 27(81.8) 6(18.2) χ2=0.147, df=1, p=0.70 Delirium tremens n (%)
History of delirium tremens was present in 26.1 % of patients and
16.4% had history of withdrawal seizures. There was no statistical significance
between two groups with respect to alcohol withdrawal profile.
BASELINE ALCOHOL SEVERITY PROFILE OF SAMPLE:
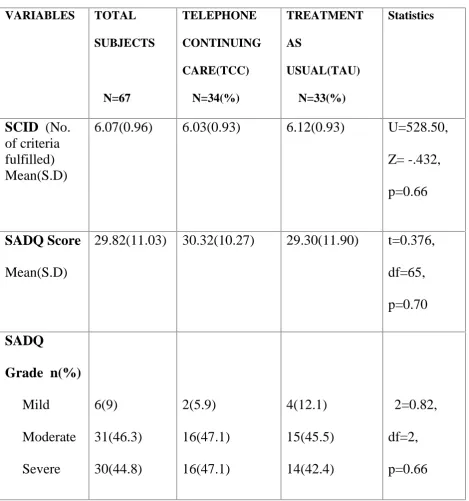
SCID SCORE:
Structured Clinical Interview for DSM IV (SCID) dependence module has 7
criteria and our patients fulfilled at least 6 out of the 7 criteria. Average SCID
criteria fulfilled was 6.07 and Mann-Whitney U test didn’t detect anystatistical difference between TCC and TAU groups (Table 6)
SADQ SCORE:
Mean SADQ score of total sample was 29.82, indicating alcohol dependence of
moderate severity. Both TCC and TAU groups had similar mean SADQ profile
(Table.6)
SADQ GRADE:
Patients recruited belong to mostly moderate and severe grade of alcohol
dependence (46.3 % were of moderate dependence and 44% were of severe
Hence the severity of alcohol dependence in the TCC and TAU groups was
[image:49.595.67.537.256.758.2]similar.
TABLE 6 :BASELINE ALCOHOL SEVERITY PROFILE OF SAMPLE
VARIABLES TOTAL SUBJECTS N=67 TELEPHONE CONTINUING CARE(TCC) N=34(%) TREATMENT AS USUAL(TAU) N=33(%) Statistics SCID (No. of criteria fulfilled) Mean(S.D)
6.07(0.96) 6.03(0.93) 6.12(0.93) U=528.50,
Z= -.432,
p=0.66
SADQ Score
Mean(S.D)
29.82(11.03) 30.32(10.27) 29.30(11.90) t=0.376,
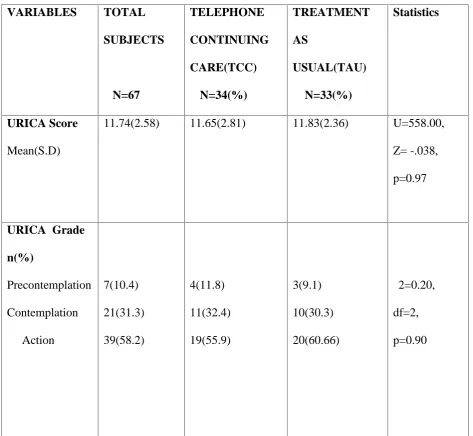
BASELINE MOTIVATION PROFILE OF STUDY SAMPLE:
Motivation level at baseline was assessed by URICA-University of Rhode
Island Change Assessment scale.
URICA SCORE and URICA GRADE:
Mean URICA score of total subjects was 11.74 and 58.2 % of total patients
recruited had higher level of motivation i.e. action phase. Both the groups had
almost similar proportion of patients in each level of motivation as shown in
TABLE 7:BASELINE MOTIVATION PROFILE OF STUDY SAMPLE VARIABLES TOTAL SUBJECTS N=67 TELEPHONE CONTINUING CARE(TCC) N=34(%) TREATMENT AS USUAL(TAU) N=33(%) Statistics URICA Score Mean(S.D)
11.74(2.58) 11.65(2.81) 11.83(2.36) U=558.00, Z= -.038, p=0.97
DEADDICTION TREATMENT:
Patients admitted in de-addiction ward underwent initial detoxification and
then full de-addiction treatment which comprises of motivational interviews,
cue analysis and cue management, coverts sensitisation, aversion therapy, group
therapy and family therapy.
Although there were differences in the components of de-addiction
treatment received by patients, there were no statistical difference between TCC
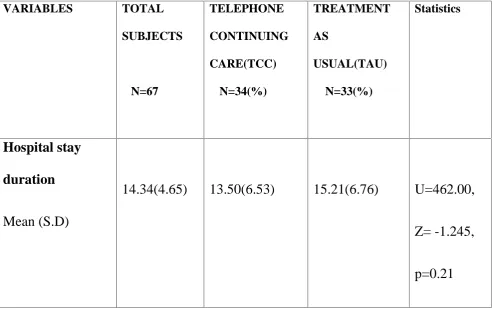
DURATION OF HOSPITAL STAY:
TABLE 9: HOSPITAL STAY DURATION
VARIABLES TOTAL SUBJECTS
N=67
TELEPHONE CONTINUING CARE(TCC)
N=34(%)
TREATMENT AS
USUAL(TAU) N=33(%)
Statistics
Hospital stay
duration
Mean (S.D)
14.34(4.65) 13.50(6.53) 15.21(6.76) U=462.00,
Z= -1.245,
p=0.21
Mean length of hospital for total subjects was 14.34 days. Treatment-as-usual
group had slightly longer mean hospital stay of 15.21 days in contrast to 14.34
BENZODIAZEPINE USAGE OF STUDY SAMPLE:
Only 76.1% of patients admitted received benzodiazepine. Others did
not required benzodiazepine for detoxification or prescribed some other drugs
[image:55.595.54.529.347.671.2]during treatment. Benzodiazepine usage was comparable in both the groups.
TABLE 9:BENZODIAZEPINE USAGE DETAILS OF STUDY SAMPLE
VARIABLES TOTAL SUBJECTS N=67 TELEPHONE CONTINUING CARE(TCC) N=34(%) TREATMENT AS USUAL(TAU) N=33(%) Statistics
BZD USAGE
N (%)
ABSTINENCE MAINTAINING MEDICATIONS:
TABLE 11:ABSTINENT MAINTAINING MEDICATIONS
VARIABLES TOTAL SUBJECTS N=67 TELEPHONE CONTINUING CARE(TCC) N=34(%) TREATMENT AS USUAL(TAU) N=33(%) Statistics Abstinence maintaining medications n(%) Present Absent 38(56.7) 29(43.3) 18(52.9) 16(47.1) 20(60.6) 13(39.4) χ2=0.40, df=1, p=0.52
At the time of discharge, 56.7% of study subjects were prescribed abstinent
medications. Of these, 37.3 % of them were prescribed disulfiram and the
was no statistical difference between choices of abstinent medications between
two groups.
Thus, there were no significant differences in the intensity and components
of in-patient de-addiction received by patients belonging to TCC group and
TAU group. At the time of discharge also they received similar abstinent
maintaining medications.
2.PRIMARY OUTCOME MEASURES
Primary outcome measures were
1) Abstinence
2) Occasional drinking
3) Daily drinking
4) Daytime drinking
At the end of first month 20.9% of patients had relapsed and
79.1% remained abstinent. On subsequent months, abstinence rate gradually
declined and at the end of 6 months it was 61.7%. At the end of 6 months,
Telephone Continuing Care group having slightly higher abstinent rate of
TABLE 12: ABSTINECE AND RELAPSE OUTCOME IN TCC AND TAU GROUPS: VARIABLES TOTAL SUBJECTS N=67 TELEPHONE CONTINUING CARE(TCC) N=34(%) TREATMENT AS USUAL(TAU) N=33(%) Statistics FIRST MONTH Abstinent Occasional drinking Daytime drinking
53(79.1) 3(4.5) 11(16.4) 27(79.4) -7(20.6) 26(78.8) 3(9.1) 4(12.1) χ2=3.82, df=2, p=0.15
SECOND MONTH Abstinent Occasional drinking Daily drinking Daytime drinking 50(74.6) 5(7.5) 2(3) 10(14.9) 26(76.5) 1(2.9) 1(2.9) 6(17.6) 24(72.7) 4(12.1) 1(3) 4(12.1) χ2=2.26, df=3, p=0.52
THIRD MONTH Abstinent
Occasional drinking Daytime drinking
TABLE 13: ABSTINECE AND RELAPSE OUTCOME IN TCC AND TAU GROUPS:
Outcome variables Total Subjects N=67
Telephone continuing Care N =34(%)
Treatment as usual N =33(%)
Statistics
FOURTH MONTH Abstinent Occasional drinking Daily drinking Daytime drinking 41(65.1) 5(7.9) 2(3.2) 11(23.8) 22(66.7) 4(12.1) 1(3) 6(18.2) 19(63.3) 1(3.3) 1(3.3) 9(30) χ2=2.48, df=3, p=0.48
FIFTH MONTH Abstinent Occasional drinking Daily drinking Daytime drinking 37(60.7) 6(9.8) 2(3.3) 16(26.2) 20(60.6) 4(12.1) 1(3) 8(24.2) 17(60.7) 2(7.1) 1(3.6) 8(28.6) χ2=0.50, df=3, p=0.92
ABSTINENCE RATE BETWEEN TWO GROUPS :
[image:60.595.74.526.251.659.2]FIG 2 :COMPARISON OF ABSTINENCE BETWEEN TWO GROUPS
Fig 2 above shows the comparison of abstinence rate between two groups at the
end of each month but there was no statistical significant difference between
two groups across each month. 79.40%
76.50%
67.60% 66.70%
60.60%
66.40% 78.80% 77.70%
63.60% 63.30%
60.70%
55.60%
1st month 2nd month 3rd month 4th month 5th month 6th month
COMPARISON OF ABSTINENCE BETWEEN TWO
GROUPS
Telephone continuing care Treatment as usual
3.SECONDARY OUTCOME MEASURES
3.1.ONSET OF FIRST DRINK AFTER DISCHARGE:
Mean onset of first drink of patients who underwent de-addiction treatment
was 64.22 days after discharge. There was difference of 7.32 days between two
[image:61.595.67.533.446.655.2]groups but it was not statistically significant (p=0.11) as shown below in the
table 13.
TABLE 14: COMPARISON OF ONSET OF FIRST DRINK AFTER DISCHARGE BETWEEN TWO GROUPS:
VARIABLES TOTAL SUBJECTS
N=67
TELEPHONE CONTINUING CARE(TCC)
N=34(%)
TREATMENT AS USUAL(TAU)
N=33(%)
Statistics
Onset of first
drink( in days)
Mean(S.D)
64.22(53.9) 60.06(56.82) 67.38(52.76) U=424.00,
z=-1.61,
TABLE 15: DRINKING PERCENTAGE DAYS IN TWO GROUPS:
Months Total
Drinking percentage days
Mean % (S.D)
TCC
Drinking percentage
days
Mean % (S.D)
TAU
Drinking percentage days
Mean % (S.D)
Statistics
FIRST MONTH Total relapsed pts -14
43.08(25.56) 40.45(22.14) 45.70(30.15) U=555.50, z=-0.097, p=0.92
SECOND MONTH Total relapsed pts -19
42.63(30.47) 47.60(28.15) 38.17(33.25) U=545.00, z=-0.252, p=0.80
THIRD MONTH Total relapsed pts -27
36.24(30.88) 36.40(29.04) 36.09(33.59) U=542.00, z=-0.269, p=0.78 FO URTH MONTH
Total relapsed pts -27
37.52(27.43) 44.79(26.07) 31.70(27.96) U=456.00, z=-0.595, p=0.55
FIFTH MONTH Total relapsed pts -30
37.76(27.33) 43.76(26.25) 32.51(28.00) U=431.00, z=-0.481, p=0.63 SIXTH MONTH
Total relapsed pts -32
There was cumulative increase in the relapse rates during successive
months of follow-up and at the end of 6 months there were 32 patients who had
relapsed into drinking. Among these patients, we calculated drinking percentage
days as: Number of drinking days/Total days. As shown above in the Table. No.
15, there was no significant difference between two groups with respect to mean
drinking percentage days at each month.
3.3. DRUG COMPLIANCE:
Telephone continuing care group had higher drug compliance compared
to treatment-as-usual group. Mean drug compliance in telephone group was
91.44 days compared to 63.18 days, which was statistically significant with p
TABLE 16: COMPARISON OF DRUG COMPLIANCE BETWEEN TWO GROUPS OUTCOME VARIABLE TOTAL SUBJECTS N=67 TELEPHONE CONTINUING CARE(TCC) N=34(%) TREATMENT AS USUAL(TAU) N=33(%) Statistics Drug compliance(in days) Mean (S.D) 77.52 (65.52) 91.44 (63.76) 63.18 (65.15) U=393.50, z=-2.11, p=0.03*
3.4.LENGTH OF FOLLOW UP:
Mean length of follow up of total subjects was 80.40 days. ‘Telephone
continuing care’had longer follow-up of 99.65 days compared to 60.58 days
TABLE 17: COMPARISON OF LENGTH OF FOLLOW- UP BETWEEN TWO GROUPS OUTCOME VARIABLE TOTAL SUBJECTS N=67 TELEPHONE CONTINUING CARE(TCC) N=34(%) TREATMENT AS USUAL(TAU) N=33(%) Statistics
Length of follow up
(days) Mean (S.D) 80.40 (70.53) 99.65 (67.55) 60.58 (68.97) U=347.00, z=-2.73, p=0.06
3.5.GROUP VISITS ATTENDANCE:
In comparing attendance for group visits between two groups, there was
statistical significance with p value of 0.05. Telephone continuing care group
had higher number of mean group visits (1.29) compared to mean of 0.58 visits
TABLE 18: COMPARISON OF GROUP VISITS ATTENDANCE BETWEEN TWO GROUPS:
OUTCOME VARIABLE
TOTAL SUBJECTS
N=67
TELEPHONE CONTINUING CARE(TCC)
N=34(%)
TREATMENT AS USUAL(TAU)
N=33(%)
Statistics
Group
visits
N (%)
0.94
(1.19)
1.29
(1.29)
0.58
(0.96)
U=354.50,
z=-2.78,
3.6. READMISSIONS AFTER DISCHARGE:
19.4 % of total subjects had readmissions after discharge for lapse
of drinking during study period. Of those, there were 6 patients belonging to
telephone continuing care group and 7 patients belonging to treatment-as-usual
[image:67.595.46.539.405.713.2]group, which was not statistically significant (p=0.58).
TABLE 19: COMPARISON OF RE-ADMISSIONS BETWEEN TWO GROUPS:
OUTCOME VARIABLE TOTAL SUBJECTS N=67 TELEPHONE CONTINUING CARE(TCC) N=34(%) TREATMENT AS USUAL(TAU) N=33(%) Statistics
No of re-admissions
(no of patients )(%)
DROP-OUTS BETWEEN TWO GROUPS:
TABLE 20: COMPARISON OF DROP-OUTS BETWEEN TWO GROUPS
OUTCOME VARIABLE
TOTAL SUBJECTS
N=67
TELEPHONE CONTINUING CARE(TCC)
N=34(%)
TREATMENT AS
USUAL(TAU) N=33(%)
Statistics
Drop–outs Completers
7(10.6)
60 (89.6)
1(2.9)
33(97.1)
6(18.8)
26(81.3)
χ2=4.34,df=1,
p=0.05*
There was higher drop-out rate of 18.8% in treatment-as-usual group compared
to 2.9% in telephone continuing care, which was statistically significant with p
COMPLETERS
Among 67 total subjects, we were able to follow-up and obtain complete
information for 60 patients and we call them as “Completers”.At the end of 6
months, among the completers, 28 patients (46.7%) remained as completely
abstinent and 32 patients (53.3%) relapsed into drinking. We call the former as
‘Abstinence group’and latter as‘Relapse group’.
We assessed the drinking percentage days in the Relapse group and compared
them with their baseline drinking percentage days.
3.2. DRINKING FREQUENCY OF RELAPSED PATIENTS
At the end of each month, there was significant reduction in drinking
percentage percentages of patients who had relapsed after discharge from
hospital, which was also statistically significant with p value of 0.0001 at each
TABLE 21 : COMPARISON OF DRINKING FREQUENCY WITH THEIR BASELINE MONTHS TOTAL RELAPSED PATIENTS DRINKING DAYS MEAN (%) MEAN REDUCTION FROM BASELINE
95 % C.I STATISTICS
FIRST 14 43.08(25.56) -56.92 -71.68 to
-42.16
t=-8.832,df=13, p=0.0001
SECOND 19 42.63(30.47) -57.36 -72.05 to
-42.67
t=-8.204,df=18, p=0.0001
THIRD 27 36.24(30.88) -63.73 -75.97 to
-51.54
t=-10.728,df=26, p=0.0001
FOURTH 27 37.52(27.43) -62.47 -73.33 to
-51.62
t=-11.83,df=26, p=0.0001
FIFTH 30 37.76(27.33) -62.23 -72.44 to
-52.02
t=-12.47,df=29, p=0.0001
SIXTH 32 38.78(27.30) -61.21 -71.05 to
-51.36
At the end of first month after discharge, there was almost 56.92%
reduction in drinking days compared to baseline 100 % drinking days.
Reduction in drinking days percentages gradually climbs as months progress
with statistical significance of p=0.0001 at each month.
At the end of sixth month, there was almost 61.21% reduction in
drinking days compared to baseline 100 % drinking days, which was also
PREDICTORS OF RELAPSE IN COMPLETERS
BIVARIATE ANALYSIS:
Possible factors that would predict risk of relapse were analysed using
bivariate analysis and multiple logistic regression .
Factors such as study arm, caregiver telephone status, basic
socio-demographic details, family history of alcoholism, baseline alcohol profile,
alcohol severity, motivation level, treatment details, abstinent medications,
hospital stay duration, drug compliance, group visit attendance and length of
4.1. STUDY GROUP AND RELAPSE:
There was trend towards significance with p value of 0.06 on analysing
the association of interventional group with relapse for those who completed the
study. Telephone continuing care group had lesser proportion of patients
[image:73.595.34.564.403.631.2]relapsing into drinking in the 6 months follow-up.
TABLE 22: ASSOCIATION OF STUDY GROUP AND RELAPSE RISK
VARIABLES ABSTINENCE
GROUP
N=28 (%)
RELAPSE
GROUP
N =32 (%)
STATISTICS
GROUP
Telephone continuing care
Treatment as usual
19(67.9)
9(32.1)
14(43.8)
18(56.3)
χ2=3.50, df=1,
4.2. SOCIODEMOGRAPHIC PROFILE AND RELAPSE RISK:
TABLE 23: ASSOCIATION OF SOCIODEMOGRAPHIC FACTORS AND RELAPSE: VARIABLES ABSTINENCE GROUP N=28 (%) RELAPSE GROUP N=32 (%) STATISTICS AGE Mean(S.D)
40 .00(7.67) 41.28(8.73)
t=-.603, df=58, p=0.54 MARITAL STATUS Married Unmarried Separated 26(92.9) 1(3.6) 1(3.6) 29(90.6) 3(9.4) -χ2=1.92, df=2, p=0.38 EDUCATION Graduate
As shown in the above Table.No.22, there was no statistical significant
association between age, age, marital status, socio-economic status and
Relapse.
4.3. OTHER SUBSTANCE USE AND RELAPSE RISK
On analysing the association of smoking status, number of cigarettes
and other comorbid substance usage with relapse risk in patients who completed
the study, there was no statistical significance of association seen with either of
these factors as shown in the below Table No. Similarly, comorbid physical
illness did not found to have significant association regarding relapse risk.
FAMILY HISTORY AND RELAPSE RISK:
But positive family history of alcoholism had trend towards significant
association with predicting higher chances of relapse. Patients having positive
family history in more than one member had higher chance of relapse (40.6 %)
TABLE 24: ASSOCIATION OF OTHER BASELINE DETAILS AND RELAPSE VARIABLES ABSTINENCE GROUP N=28 (%) RELAPSE GROUP
N =32 (%)
4.5.ASSOCIATION OF CLINICAL FEATURES OF ALCOHOL AND RELAPSE:
TABLE 25: ASSOCIATION OF ALCOHOL PROFILE AND RELAPSE:
VARIABLES ABSTINENCE
GROUP N=28 (%)
RELAPSE GROUP N =32 (%)
STATISTICS
ONSET OF FIRST DRINK 21.21(6.49) 20.50(5.71) U=426.00,z=-.33,p=0.74
DAILY DRINKING ONSET 30.46(5.77) 30.59(7.44) t=-.07,df=58,p=0.94
DURATION OF ALCOHOL
INTAKE 18.79(8.41) 20.81(9.75) t=-.85,df=58,p=0.39
PAST HISTORY OF
LENGTH OF ABSTINENCE 160.75(224.07) 208.19(296.64) U=393.00,z=-.81,p=0.41
WITHDRAWAL SEIZURES Absent Present 23(82.1) 5(17.9) 27(84.4) 5(15.6) χ2=.05, df=1, p=1.00 DELIRIUM TREMENS Absent Present 19(67.9) 9(32.1) 24(75) 8(25) χ2=.37, df=1, p=0.54 WITHDRAWAL PSYCHOTIC DISORDER Absent Present 25(89.3) 3(10.7) 31(96.9) 1(3.1) χ2=1.38, df=1, p=0.24 SADQ SCORE Mean (S.D)
28.50(10.85) 30.31(10.74) t=-.64,
df=58,
Among Completers, none of the alcohol profile factors, such as onset of first
drink, onset of daily drinking , duration of alcohol intake and abstinent episodes
were found to statistically significant in influencing the relapse (shown above in
Table.)
Similarly, history of withdrawal seizures ,delirium tremens and
withdrawal related psychotic disorder were not found to be having any
significant association with abstinence and relapse.
On analysing the association of baseline alcohol severity profile factors
such as SCID score, SADQ score and SADQ grade with abstinence, there was
no statistical significant association with baseline alcohol profile and abstinence
4.9. ASSOCIATION OF TREATMENT VARIABLES AND RELAPSE:
TABLE 26: ASSOCIATION OF TREATMENT VARIABLES AND RELAPSE
VARIABLES ABSTINENCE
GROUP
N=28 (%)
RELAPSE
GROUP
N =32 (%)
STATISTICS URICA GRADE Precontemplation Contemplation Action 4(14.3) 10(35.7) 14(50) 3(9.4) 8(25) 21(65.6) χ2=1.50, df=2, p=.45 HOSPITAL STAY DURATION Mean (S.D)
15.68(6.95) 13.25(6.25) U=353.00,
z=-1.41, p=.15 ABSTINENCE MAINTAINING MEDICATIONS N(%) Absent Present 10(35.7) 18(64.3) 16(51.6) 16(50) χ2=1.24, df=1, p=0.26
Length of hospital admission
>3 weeks < 3 weeks
Motivational level assessed by URICA was also analysed for possible
association with abstinence model, but neither URICA score nor URICA grade
was found to be statistically significant in predicting abstinence.
Treatment profile factors such as benzodiazepine use, mean duration
of hospital stay and abstinent medications were analysed for possible influence
on outcome. But neither of the factors was found to be having any predicting
influence on abstinence.
81.3 % of patients who had relapsed had hospital admission less
than 3 weeks whereas 66.67 % of patients admitted atleast three weeks
were found to be remaining abstinent. Length of hospital admission more
than or equal to three weeks was found to be having positive predicting
influence on outcome.
While hospital admission less than 3 weeks was found to be having three
times higher chance of relapse (Odds Ratio of 3.25 and 95% C.I of 1.018
4.12. ASSOCIATION OF FOLLOW UP TREATMENTS AND RELAPSE:
TABLE 27: ASSOCIATION OF FOLLOW UP TREATMENTS AND RELAPSE:
VARIABLES ABSTINENCE
GROUP
N=28 (%)
RELAPSE
GROUP
N =32 (%)
STATISTICS
DRUG
COMPLIANCE
123.21(59.07) 42.09(45.46) U=129.50, z=-4.76, p=0.0001*
GROUP VISITS 1.39(1.44) 0.59(0.79) U=306.50,
z=-2.25, p=0.024*
LENGTH OF FOLLOW UP
107.14(68.5) 62.19(69.33) U=271.50,
z=-2.68, p=0.008*
Patients having higher drug compliance, higher attendance for group
visits and longer follow-up were found to be statistically significant in
MULTIPLE LOGISTIC REGRESSION:
[image:82.595.41.523.165.738.2]4.13.RESULTS OF MULTIPLE LOGISTIC REGRESSION:
TABLE 28: MULTIPLE LOGISTIC MODEL OF RELAPSE RISK
VARIABLES B S.E SIGNIFICANCE EXP(B)
Demographic details Age Marital status (single/separated) Socioeconomic status Smoking status Family history of alcoholism >1 member =1 member Alcohol profile SADQ score Duration of alcohol intake
Motivation profile URICA score Treatment profile Study group
Duration of hospital stay
Poor drug compliance
For our logistic model, on applying Hosmer and Lemeshow test, p value
came as 0.263 and hence logistic regression analysis is possible. Omnibus tests
of model coefficients, p value is <0.0001; hence our logistic model is a
significant model to predict relapse.
Possible confounding variables such as age, marital status,
socio-economic status, smoking status, family history of alcoholism, baseline alcohol
profile, baseline motivational level, study group, duration of hospital stay and
drug compliance were entered as co-variates keeping Relapse as dependent
variable in the multiple logistic regression analysis.
Family history of alcoholism and drug compliance was found to be
statistically significant in predicting the relapse risk. Positive family history of
alcoholism in one member was found to be having trend towards significance in
predicting relapse whereas positive family history in more than one family
members was found to be having higher risk of relapse with statistical
significance of p value =0.013 and odds ratio of 23.813.
Poor drug compliance was another factor significantly predicting relapse
DISCUSSION
Our randomized controlled study was designed to evaluate the effectiveness of
telephone continuing care in managing alcohol dependence syndrome. Also, the
6 month data obtained for the whole group was used to build a model that
would predict relapse.
To start with, we had recruited a homogenous patient population who fulfilled
the DSM IV TR criteria for alcohol dependence and admitted for de-addiction
treatment. Their baseline socio-demographic details, clinical profile and
baseline features of alcohol appear to be generalizable as they were similar to
other published Indian studies [17, 37, 38].
The mean age of our patient group was 41.10 years and they had been drinking
alcohol since the age of 20 and for at least for the last 10 years they had been
drinking daily. As rated by SADQ, most of them (91%) had moderate to severe
dependence. Most of them (58.2 %) had action level of motivation, as assessed
Table 29: Comparison of demographic and baseline alcohol profile of our
study sample with other Indian outcome studies
Variable Our Study
Results Kar et al,2003 Chandrasekaran et al,2001 Abraham et al,1997 Mean age (S.D) 41.09 yrs(8.63)
30.8 yrs(8.5) 39.7 yrs(8.66) 39.6 yrs(8.5)
Age of onset
of first drink
(S.D)
20.82 yrs
(5.85)
NA 23.18 yrs
(6.92)
23.15(7.2)
Age of onset
Table 30 : Comparison of Positive family history of alcoholism with
outcome studies
Variable Our Study
Results
Kar et
al,2003
Chandrasekara
n et al,2001
Abraham et
al,1997
Positive
family history
of alcoholism
77.6% 66.2 % 67.1% 54.25%
Another interesting finding was 77.6% of recruited patients had positive
family history of alcoholism, which was similar to previous Indian outcome
studies. [17, 37, 38]
Primary outcome measures:
On analysing the primary outcome measures between the two groups, at the
end of 6 months, complete abstinence rate was 66.4% in Telephone
continuing care (TCC) group and 55.6% in Treatment-as-usual group
(TAU). Though numerically TCC group appears better than TAU group, this
Table 31 : Comparison of abstinence rate between two groups at each
month
Telephone
continuing care
Treatment as
usual
P value
1st month 79.4% 78.8% 0.15
2ndmonth 76.5% 77.7% 0.52
3rdmonth 67.6% 63.6% 0.52
4thmonth 66.7% 63.6% 0.48
5thmonth 60.6% 60.7% 0.92
6thmonth 66.4% 55.6% 0.35
However, in the Completers group (6 month complete date obtained)
the difference in the abstinence rate is even larger. In completers, the abstinence
rate in TCC group was 67.9%, whereas in TAU group it was 32.1% and this
difference showed trend towards significance (p=0.06)
This is in contrast to earlier studies done in the west, which showed a better
significant reduction in drinking percentage days. Our study couldn’t replicate such significance because of small sample size. Another reason could be that
our study duration was short. Mckay et al showed significant better results only
in 24 months longer outcome studies [3]. Hence we speculate that a large
sample size with longer duration of study the advantage of Telephone
continuing care could become significant.
Also in addition, still adequate face to face interviews might be needed to hold
on the benefits of telephone continuing care.
Secondary outcome measure:
Telephone continuing care group performed better than
treatment as usual group in terms of good drug compliance, longer length of
follow-ups in clinic and better attendance for group therapy. There was
significant statistical difference between two groups in the above parameters.
Many studies also demonstrated similar results [3, 6].Godley et al [6]
demonstrated better attendance for group visits and follow-up in clinic.
of treatment adherence and follow-up at the end of 3 months. But these results
[image:89.595.74.526.280.687.2]were not replicated at the end of 12 months.
Figure 3: Comparison of drug compliance between two groups
50 70 90
Telephone continuing care Treatment-as-usual
Dr
ug
co
m
pl
ia
nc
e(
in
d
ay
s)
With respect to compliance to drug regimen, telephone continuing care
had mean drug compliance of 91.44 days compared to 63.18 days of treatment
[image:90.595.78.526.337.694.2]as-usual group.(p=0.03).
Figure 4: Comparison of length of follow up between two groups
50 70 90
Telephone continuing care Treatment-as-usual
Le
ng
th
o
f f
ol
lo
w
up
( i
n
da
ys
)
Similarly, there was trend towards significance in terms of length of
follow up between two groups (99.65 days in telephone continuing care group
[image:91.595.81.542.333.711.2]vs 60.58 in treatment-as-usual, p=0.06).
Also, attendance of group visits was higher in telephone continuing
care group and there was statistical significance when compared to
treatment-as-usual group. (1.29 visits versus 0.58 visits, p=0.05)
Regarding other secondary outcome measures such as onset of first drink,
drinking days percentages and number of re-admissions, there was no statistical
difference between two groups.
EFFECTIVENESS OF DE-ADDICTION TREATMENT:
Our de-addiction treatment regimen includes detoxification,
motivational interviews, cue analysis, aversion therapy, covert sensitization,
family and group therapy. Finally at the time of discharge, we used to prescribe
abstinent medications and advised to come for regular follow-up. Many tertiary
centres have de-addiction treatment with the above components [17, 38]
Even though abstinent rate and drinking percentage days among patients
who had did not differ statistically between the two groups, the effectiveness of
the de-addiction programme for the whole sample was very encouraging. For
the whole sample, the complete abstinence rate and drinking percentage days