ISSN: 2347-7474
International Journal Advances in Social Science and Humanities
Available Online at:
www.ijassh.com
RESEARCH ARTICLE
Students’ Social-Economic Status and Equity in Form One
Admission in National Secondary School Clusters in Kenya
Wakwabubi Simon*, Musera Geoffrey Ababu*
Masinde Muliro University of Science and Technology, P.O. Box 190-50100, Kaka mega, Kenya.
*Corresponding Author: Email: [email protected] and [email protected]
Abstract: Through its educational policies and plans, Kenya is among countries whose aim is to achieve equity in access to secondary school education by pupils from different background as envisaged in Vision 2030 and Sustainable Development Goals. However, this dream still remains elusive. This paper provides empirical evidence of the effect of students’ socio-economic status on equity in form one admission in national secondary school clusters in Kenya using data from a sample of 1935 form one students admitted in Kenyan national schools. The results of the multinomial logistic regression indicate that even after holding other predictor variables constant, students’ socio-economic status significantly affected their admission to the national secondary schools clusters. Consequently, there is need to develop sound and inclusive strategies to accelerate equity in form one admission to national secondary school clusters. The Ministry of Education should design policies that equalise opportunities for students from different social-economic background in accessing all national secondary schools clusters.
Keyword:Social-Economic Status, Equity, Form One Admission, National Secondary School Clusters.
Article Received: 01 Oct. 2018 Revised: 12 Oct. 2018 Accepted: 20 Oct. 2018
Introduction
Secondary education is widely seen as one of the most promising avenue for individuals to realize better, more productive lives and as one of the primary drivers of national economic development. Since independence, the Government of Kenya has been committed to reviewing her education policies, planning and tackling emerging issues with a view of enhancing equity, quality, and relevance of education; and access to educational opportunities [1].
Equity in education has two dimensions. The first is fairness, which basically means making sure that personal and social circumstances for example gender, socio-economic status or ethnic origin should not be an obstacle to achieving educational potential. The second is inclusion, in other words ensuring a basic minimum standard of education for all (Organization of Economic Co-operation and Development [2]. Therefore, equity is the degree of fairness and justice extended to every member of the society [3]. The relationship between socio-economic background and educational outcomes has been well documented internationally.
Pupils from lower income and minority ethnic groups have been found to be potentially more at risk of not making a successful transition to post-primary school [4]. For example, a study by Keith [5] indicates different patterns of participation by wealth and gender between countries in Sub-Sahara Africa (SSA) schools.
In Zambia, though wealth is relatively unimportant in grade 1, it becomes much more so in the higher grades of primary and in secondary. Girls and boys are enrolled in nearly equal numbers.
In all cases wealth is a significant determinant of participation and is generally more important than gender. Malecki and Demaray, [6] observed that in some countries for instance, students’ access to educational opportunities is determined by educational performance which is strongly predetermined by their family background. Research by UNESCO [7] indicates that youngsters from lower socio economic state are less likely to succeed in school. In addition, the study findings show that girl’s academic achievement varied positively depending on their family’s income. Fields [8] observed that, there exist considerable differences in educational opportunities and participation classified by gender, socio-economic background and urban-rural areas.
This point to the fact that despite the efforts made to achieve equity of access to educational opportunities, there remains considerable social selection and disparities in education particularly among different socio-economic groups. This has been supported by a number of studies. For example, the OECD [10] study indicates that home background indisputably influences students’ access to educational opportunities.
Similarly, Mbani [10] study indicates that the quality of parents and home background of a student predicts the quality and regularity of the satisfaction and provision of a child's functional survival and academic needs. Poor parental care with gross deprivation of social and economic needs of a child, usually yield poor academic performance of the child. In addition, Ngatiari [11] posits that good parenting supported by strong economic home background enhance a student’s educational outcomes.
Ngware et al. [12] argues that household income level increases the probability of a household decision to enroll a child to secondary school. This implies that the higher the level of household income, the higher the prospect of enrolling children in secondary schools. Blossfeld and Shavit [13] argue that given the long-term process of
educational expansion, reinforced in many countries by educational reforms, one might expect a drop in the impact of social background on educational opportunity.
Surprisingly, empirical studies show that inequality of educational opportunity between social strata has been quite stable over time. Results from a variety of countries suggest that the proportion of people from lower socio-economic backgrounds gaining entry to universities is not likely to increase until the proportion from advantaged backgrounds reach a saturation level. All these factors have to be considered when designing strategies for improving equity and access to secondary school education. The reviewed litera
ture [8] points to the fact that SES has an effect on students’ participation to educational programmes. However, the Kenyan context as relates to equity in access to national secondary school clusters in unknown. Currently Kenya operates three levels of public secondary schools existing in a hierarchical manner, namely; National, County and Sub-county secondary schools. National secondary schools are categorized into cluster 1, 2, 3, and 4.
Cluster 1 is the former provincial secondary schools that were performing very well in Kenya Certificate of Secondary Education (KCSE). Cluster 2 and 4 are mainly former provincial secondary schools found in marginalized areas. Clusters 3 are the original 18 national secondary schools. In terms of Kenya Certificate of Secondary Education (KCSE) performance, national schools perform far better than schools in other categories. For instance, recent figures show that on average students in national schools scored a mean score of 9.6 out of a possible 12.
schools are not as good as the eighteen earlier ones in cluster 3, in terms of facilities and teachers [15].
This competition has elicited intense public debate over which student joins cluster 1, 2, 3 or 4 of national schools in Kenya. While a section of the public argues that some national schools clusters are a preserve of students from the high SES. To promote equity in form one selection, the Kenya Ministry of Education employs a system based on merit, quotas, affirmative action and student choice (In2 East Africa, 2015). Although form one admission to national schools criterion is based merit, student choice and affirmative action, serious concerns have been registered in relation to this form one selection criterion.
For instance, the catholic Bishops in Kenya claim that the selection criteria and especially the quota system discriminate against pupils from private schools (Catholic News Agency for Africa, 2015). Besides, other stakeholders such as the Kenya Private Schools Association (KPSA) claim that the selection process is not transparent (In2 East Africa, 2015).
According to a Standard Reporter, 25th January 2012 as cited in Alari, Migosi and Evusa [16], the current form one selection criterion could be described as “a distortion of merit, equity and fairness and unnecessarily punitive” and as a result the students are discouraged and frustrated when their aspirations are not met. While the numbers and percentages of students admitted to all categories of secondary school are known, little is known about the effect of students’ social-economic status on admission into national secondary schools clusters in Kenyan.
This paper reports findings of how students SES affect their admission to national schools clusters in Kenya. The empirical results seeks to address arguments of a section of the public that there is no equity in accessing National Secondary School clusters in Kenya which is against the education goal of enhancing social equity through education.
Methodology
The paper utilized stratified, Probability Proportion to Size (PPS) and simple random sampling techniques to draw a sample of
1,935 from a population of 20,650 form one students of the year 2016 in the 103 national secondary schools in Kenya. Kenya is a country in Africa and a founding member of the East African Community (EAC).
Its capital and largest city is Nairobi. Kenya's territory lies on the equator and overlies the East African Rift covering a diverse and expansive terrain that extends roughly from Lake Victoria to Lake Turkana and further south-east to the Indian Ocean. It is bordered by Tanzania to the south, Uganda to the west, South Sudan to the north-west, Ethiopia to the north and Somalia to the north-east. Kenya covers 581,309 km2 (224,445 sq mi), and had a population of approximately 45 million people in July 2014.
The climate of Kenya varies by location; from mostly cool every day, to always warm/hot. The climate along the coast is tropical. This means rainfall and temperatures are higher throughout the year. At the coastal cities, Mombasa, Lamu and Malindi, the air changes from cool to hot, almost every day. The further inside Kenya, the more arid the climate becomes. An arid climate is nearly devoid of rainfall, and temperature swings widely according to the general time of the day/night.
For many areas of Kenya, the daytime temperature rises about 25oC, almost every day. There are at least 2 national secondary schools in every county giving a total of 103 national schools across the country with a student population of 81,230 established for purposes of stimulating educational excellence as well as fostering national cohesion. The 103 national schools are categorized into four clusters with cluster 1, 2, 3 and 4 having 30, 25, 18 and 30 national secondary schools.
The authors also collected data on form one student’s secondary school cluster (cluster 1, cluster 2, cluster 3 and cluster 4). Besides, the authors collected data on form one student’s demographic background (age, gender, disability, KCPE scores and admission status). The student SES is the explanatory variable, their national secondary school cluster is the outcome variable while their demographic data is the control. This paper uses this data to test the null hypothesis that a student’s socio-economic status has no statistically significant effect on their form one admission in national secondary school cluster in Kenya. A sequential multinomial logistic regression was fitted to model the effect of student SES on admission in national schools clusters.
Result and Discussion
The authors preferred Multinomial Logistic Regression (MLR) because the outcome variable is a four level categorical variable and it allowed simultaneous comparison of more than one alternative. That is, the Relative Risk Ratio (RRR) of the alternatives was estimated simultaneously by comparing admission to cluster one, cluster two and cluster four national schools with that in cluster three national schools which was the reference category (base category).
For each model, MLR ran regressions for the relative risk of enrolment to cluster one versus cluster three national secondary schools, cluster two versus cluster three national secondary schools and cluster four versus cluster three national secondary schools. Multinomial logistic regression gave separate coefficient estimates for each independent variable for each category of comparison. The estimated coefficients represented the relative risk of being in the comparison category versus being in the base category associated with a one-unit increase in the independent variable. The multinomial logistic model in this study took the form:
Where i is the ith individual, yi is the observed outcome, Xi the independent variables and βj are the beta coefficients that are estimated using maximum likelihood.
Once the coefficients are exponentiated they give odds ratios (OR) reported as the RRR in MLR. The beta coefficients βj are interpreted as the increase in Relative Risk Ratio of being in category j vs the base category resulting from a one-unit increase in the ith covariate, holding the other covariates constant. In this case, βj are the increases in relative risk of admission clusters one, cluster two and four national secondary schools vs admission to cluster three national secondary schools. To be able to fit the multinomial logistic regression, the authors first established the association between national school clusters and statistically significant explanatory variables using a Chi-square test statistic.
The Chi-square results in Table 4 in appendix 1indicate that there was a moderately significant association (χ2 (6, 1935) =765.46, p=<.001; Cramer’s V = 0.3631) between the outcome variable and students’ home county. In addition, the Chi-square results indicate that students’ SES, primary school type, disability and admission status had a statistically weak association with the outcome variable.
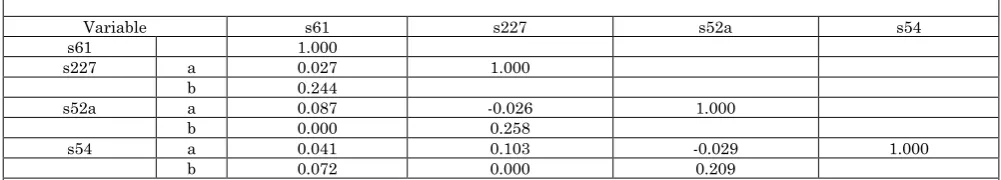
Since these entire predictor variables had a significant association with the outcome variable, the study fitted them in the MLR model to establish their effect on the outcome variable. In addition, the authors ran separate pair-wise correlations between the outcome variable (National school cluster) and its interval-scale correlates to establish which interval variables to pursue in the MLR. The results in Table 5 in appendix 2 indicate that the outcome variable was not significantly correlated with students’ number of bedrooms in their houses at home (p=0.244) and KCPE scores (p=0.072) at α = 0.05. It was expected that KCPE scores will not correlate with outcome variable because placement criterion in nationals school is mainly based on KCPE score and majority of students have high scores.
The students’ age variable was therefore pursued in the regression model as a control variable. Consequently, the authors fitted the variables that were associated with the
outcome variable to model the effect of student SES on admission in national secondary schools clusters. The results are presented in Table 1.
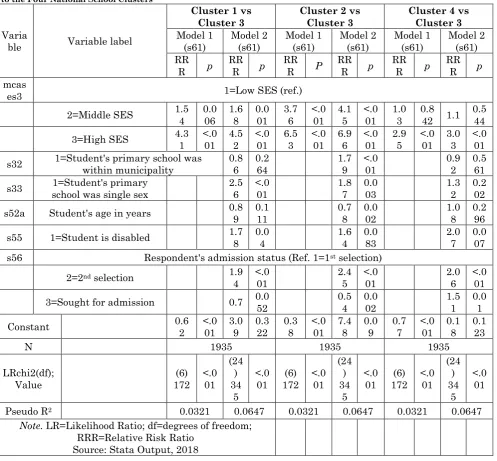
Table 1: Multinomial Logistic Regression Relative Risk Ratios for the Effect of Socio-Economic Status on Admission to the Four National School Clusters
Varia
ble Variable label
Cluster 1 vs Cluster 3
Cluster 2 vs Cluster 3
Cluster 4 vs Cluster 3 Model 1
(s61) Model 2 (s61) Model 1 (s61) Model 2 (s61) Model 1 (s61) Model 2 (s61) RR
R p RRR p RRR P RRR p RRR p RRR p mcas
es3 1=Low SES (ref.)
2=Middle SES 1.54 0.006 1.68 0.001 3.76 <.001 4.15 <.001 1.03 0.842 1.1 0.544
3=High SES 4.31 <.001 4.52 <.001 6.53 <.001 6.96 <.001 2.95 <.001 3.03 <.001
s32 1=Student's primary school was within municipality 0.86 0.264 1.79 <.001 0.92 0.561
s33 school was single sex 1=Student's primary 2.56 <.001 1.87 0.003 1.32 0.202
s52a Student's age in years 0.89 0.111 0.78 0.002 1.08 0.296
s55 1=Student is disabled 1.78 0.04 1.64 0.083 2.07 0.007
s56 Respondent's admission status (Ref. 1=1st selection)
2=2nd selection 1.9
4 <.001 2.45 <.001 2.06 <.001 3=Sought for admission 0.7 0.052 0.54 0.002 1.51 0.01
Constant 0.62 <.001 3.09 0.322 0.38 <.001 7.48 0.09 0.77 <.001 0.18 0.123
N 1935 1935 1935
LRchi2(df);
Value 172 (6) <.001 (24
) 34 5
<.0
01 172 (6) <.001 (24
) 34 5
<.0
01 172 (6) <.001 (24
) 34
5 <.0
01
Pseudo R2 0.0321 0.0647 0.0321 0.0647 0.0321 0.0647 Note. LR=Likelihood Ratio; df=degrees of freedom;
RRR=Relative Risk Ratio Source: Stata Output, 2018
The results of the MLR in Table 1 for cluster 1 vs cluster 3 in model 1indicate that the relative risk ratio (RRR) of being in cluster 1 relative to cluster 3 for a student in the middle SES relative to the one in low SES increases by up to 1.54 times and which is statistically significant (p=0.006). Holding all other predictor variables in the model constant, the RRR increases further by up to 1.68 times and which is statistically significant (p=.001).
Further, the results in Table 1 indicate that the relative risk ratio of being in cluster 1 relative to cluster 3 for a student in the high SES relative to the one in low SES increases
by up to 4.30 times and which is statistically significant (p<0.001).
Controlling all other predictor variables in the model constant, the RRR of being in cluster 1 relative to cluster 3 for a student who is disabled relative to the one who is not increases by up to 1.78 times (p=0.04). Holding all other predictor variables in the model constant, the RRR of being in cluster 1 relative to cluster 3 for a student who was in the second selection relative to the one who in the first selection increases by up to 1.94 times, (p=<.001).
The rest of the covariates (student's primary school was within or outside municipality, student’s age and sought for admission) are not statistically significant. The MLR results in Table 1 for cluster 2 vs cluster 3 showed that the RRR of being in cluster 2 relative to cluster 3 for a student in the middle and high SES relative to the ones in low SES increases by up to 3.76 time, (p=<.001) and 6.53 times, (p=<.001) respectively.
The increase in RRR holds even after all other predictor variables in the model are controlled such that, the relative risk ratio of being in cluster 2 relative to cluster 3 for a student in the middle and high SES relative to the one in low SES increases by up to 4.15 times, (p=<.001) and 6.96 times, (p=<.001) respectively.
Controlling for all other predictor variables in the model constant, the relative risk ratio of being in cluster 2 relative to cluster 3 for a student whose primary school was in municipality relative to the one whose school was outside increases by up to 1.79, (p=<.001).
Similarly, holding all other predictor variables in the model constant, the RRR of being in cluster 2 relative to cluster 3 increases for a student who was in a single sex primary school relative to the one in a co-educational increased by up to 1.87, (p=0.003) and for students who were admitted in the 2nd selection by up to 2.45 times (p=<.001).
However, holding all other predictor variables in the model constant, the relative risk ratio of being in cluster 2 relative to cluster 3 decreases by up to - 0 .78 units, (p=<0.02) with a one year increase in age, in other words, older students are less likely to be in cluster 2 relative to cluster 3 and also
there was a reduction in RRR for students who sought for admission by up to -0.54, (p=<0.001). The covariate (student was disabled (p=0.03)) was not statistically significant. Further, the results in Table 1 for Cluster 4 vs Cluster 3 indicate that the relative risk ratio of being in cluster 4 relative to cluster 3 for a student in the middle SES relative to the one in low SES is not statistically significant before (p=0.842) and even after (p=0.544) holding all other predictor variables constant in model 2.
However, RRR of being in cluster 4 relative to cluster 3 for a student in the high SES relative to the one in low SES increases by up to 2.95 units (p=<0.001) and even after holding all other predictor variables in the model constant, the RRR still increased by 3.03 units, (p=<0.001).
Holding all other predictor variables in the model constant, the following variables had an incremental effect on RRR: Students’, who were disabled (2.07); p=0.007, students who were admitted on 2nd selection (2.06); p=<0.001 and students who sought for admission (1.51); p=0.01. The rest of the covariates (student's primary school was within or outside municipality (p=0.561), student’s age (p=0.202) and weather student was disabled or not (p=0.296) were not statistically significant.
These findings are in tandem with results found by indicating different patterns of participation by wealth and gender between countries in Sub-Sahara Africa (SSA) schools. Besides, results indicate that students’ access to educational opportunities is determined by educational performance which is strongly predetermined by their family background.
Further, argue that despite efforts made to achieve equity of access to educational opportunities, there remains considerable social selection and disparities in education particularly among different socio-economic groups.
Table 2: Measures of Fit for mlogit of National school clusters and Student’s SES
Log-Lik Intercept Only: -2681.832 Log-Lik Full Model: -2508.365
D(1899): 5016.73 LR(24): 346.934
Prob > LR: <.001 McFadden's R2: 0.065 McFadden's Adj R2: 0.051 Maximum Likelihood R2: 0.164 Cragg & Uhler's R2: 0.175
Count R2: 0.321 Adj Count R2: 0.088
AIC: 2.63 AIC*n: 5088.73
BIC: -9354.641 BIC': -165.305
Note. AIC = Akaike Information Criterion; BIC = Bayesian Information Criterion; Adj = Adjusted; LR = Likelihood Ratio; Lik = Likelihood Source: Stata Output, 2018
The measures of fit for mlogit of national school clusters and student’s SES test in Table 2 showed that our full model was statistically significant (p=<.001) and about 0.175 (17.5%) (Cragg & Uh ler's R2) of outcome variability (national school clusters) could be explained by predictor variables (student’s SES and control variables) used in the full model. Besides, the authors established the average marginal effect of each of the regress or variables on the probability of each of the four national school
clusters. The marginal effects were used to determine increases/decreases in the probability of selecting an alternative in outcome variable, based on a certain predictor variable, expressed as a percent. A positive marginal effect implies an increase in probability of admission while a negative marginal effect implies a decrease in probability of admission to national school cluster. Table 3 presents the average marginal effect of each regress or variable on the probability of each of the four national School clusters.
Table 3: The Average Marginal Effect of each Regress or on the Probability of each of the Four National School Clusters
Varia
ble Variable label
Cluster 1 Cluster 2 Cluster 3 Cluster 4 dy/
dx Std. Err p
dy/ dx
Std. Err p
dy/ dx
Std. Err P
dy/ dx
Std. Err p mcase
s3 1=Low SES (ref.)
2=Middle SES 0 0.03 0.93 0.22 0.03 <.001 0.1 -2 0.02
<.0 01
-0.1
1 0.03 <.0
01
3=High SES 0.09 0.03 <.001 0.19 0.03 <.001 0.2 -7 0.03
<.0 01
-0.0
1 0.02 0.5
47
s32 1=Student's primary school was within municipality 0.0 -6 0.02
<.0
01 0.12 0.02 <.001 -0.0
2 0.02 0.3
78 -0.0
4 0.02 0.0
54
s33 1=Student's primary school was single sex 0.13 0.03 <.001 0.04 0.03 0.2 0.1 -1
0.03 <.001 0.0 -5
0.03 0.088
s52a Student's age in years 0.0 -1 0.01
0.2 6
-0.0
4 0.01 <.0
01 0.02 0.01 0.138 0.04 0.01 <.001
s55 1=Student is disabled 0.03 0.04 0.43 0.01 0.04 0.83 0.1 -1
0.04 0.014 0.07 0.04 0.06
s56 Admission status (Ref. 1=1st selection)
2=2nd selection 0.0 2 0.03
0.4 1
0.0
8 0.02 0 -0.1
3
0.03 <.0 01
0.0 4 0.03
0.1 72
3=Sought for admission 0.0 -6
0.03 0.0 6
-0.1
2
0.03 <.0 01
0.0 3 0.03
0.2 16
0.1 4 0.03
<.0 01
Note. n=1935; Marginal effects determined through the Delta-method; dy/dx at the means of the explanatory variables
Source; Stata Output, 2018
The average marginal effects result in Table 3 show that the probability of students from high SES getting admission in cluster one increased by 9% which is statistically
status and form one admission in national secondary school clusters. Surprisingly, unlike the results in Table 4 indicating that a high proportion of students in national schools are from co-education primary schools relative to those from single sex primary schools, The results in Table 3 indicate that the probability of students from the primary schools which were single sex getting admission to cluster one increased by 13% which is statistically significant (p=<. 001). Moreover, contrary to the expectation, the results in Table 3 indicate that the probability of students from the primary school within the municipality getting admission to cluster 1 national schools decreases by -6.0% and the results are statistically significant (p=<.001). The rest of the covariates in cluster 1 had statistically insignificant average marginal effect.
In the cluster 2, average marginal effects results from Table 3 suggest that the effects of SES were still significant. The probability of admission to cluster 2 national schools increased by 22% and the results are statistically significant (p=<.001) for students from middle SES while the probability of admission to cluster 2 by students from the high SES increased by 19% (p=<.001).
The results further indicate that the probability of admission to cluster 2 national schools by students from a primary school which was within municipality increased by12% (p=<.001) and for students from the 2nd selection; the probability increased by 8% (p=<.001). On the other hand, contrary to the societal expectation that as one grows older he or she become wise, the effect of a unit increase in student age decreases the probability of admission to cluster 2 national school by -4.0% (p=<.001) and likewise students who sought admission had their probability of admission to cluster 2 national school decrease by -12% (p=<.001).
It was surprising that all statistically significant variables could decrease the probability of admission to cluster 3 national schools as follows: students from the middle SES by - .12 (-12.0 %, p=<.001), students from the high SES by - .27 (-27.0%, p=<.001), students from the primary school which were single sex decreases by - .11 (-11.0%, p=<.001), students with disability - .11 (-11.0%, p=0.014) and students admitted from 2nd selection -.13 (-13.0%, p=<.001).
The rest of the covariates; students primary school was within municipality(p=0.378) and students who sought for admission (p=0.216), in cluster 3 were not statistically significant.
These findings have shown that when all predictor variables are controlled, the advantageous effect of the probability of admission to the prestigious cluster 3 national school becomes insignificant. This means that students can no longer ride on their status in society and wealth to join “good” schools if the playing field is level. The findings indicate that, the probability of admission to cluster 4 national schools for students from the middle SES decreases by - .11 (11.0%, p=<.001).
However, a unit increase in student age and students who sought for admission had their probability of admission to cluster 4 national school increases by .04 (4.0%, p=<.001) and 0.14(14%, p=<.001) respectively. The marginal effect of the rest of the covariates in cluster 4 was not statistically significant. These findings have suggested that even after holding all other predictor variables in the model constant, the effect of students’ SES on admission to national secondary schools cluster was significant.
Students from high SES have the highest probability of being admitted in cluster 1 while those from middle SES are most likely to be admitted in cluster 2 national secondary schools. However, contrary to the expectation, coming from high and middle SES seems to decrease the probability of admission in to cluster 3 national secondary school which is considered most prestigious. This means that students can no longer ride on their status in society and wealth to join “good” schools if the playing field is level. Moreover, the probability of getting admission to cluster 4 by students from high and middle SES decreases.
p<.001) for effect of the middle and high SES tertile on admission into the three national school clusters relative to cluster 3 respectively is statistically significant.
Further, the chi-square results (χ2 (6) = 152.65, p<.001.) for the overall effect of the middle or high SES tertile or both on admission to the three national schools clusters relative to cluster 3 is statistically significant. Consequently, the authors rejected the null hypothesis that a student’s socio-economic status has no statistically significant effect on their form one admission in national secondary school cluster in Kenya.
Indeed, after controlling for other covariates in the final model, the results indicate that a student’s SES has a statistically significant effect on admission into the national school clusters. Since children's success in secondary education school determines their success as adults, determining whether and where they go to college, what professions they enter and how much they are paid these findings suggest that students SES is one factors which may preventing secondary school education, in national school, from serving the role of being "the great equalizer."
The findings agree with a number of studies. For example, study indicates that there are very different patterns of participation by wealth and gender between countries in Sub-Sahara Africa (SSA) schools. In addition, Fields [8] argue that there exist considerable differences in educational opportunities and participation classified by gender, socio-economic background and urban-rural areas.
The findings suggest that despite the efforts made to achieve equity in access to educational opportunities, there remains considerable social selection and disparities in education particularly among different socio-economic groups.
Similarly, the study which examined the relationship between students’ performance and several aspects of their home background such as their parent’ levels of education and occupations, their exposure to various levels of cultural and economic capital, their country of birth, and the language they speak
at home indicate disparities in access to education based on students wealth index. Further, Ngware et al [12] study on ‘‘Improving access to secondary school in Kenya’’ indicate that household income level increases the probability of a household decision to enroll a child to secondary school. This implies that the higher the level of household income, the higher the prospect of enrolling children in secondary schools. Blossfeld and Shavit [13] argued that given the long-term process of educational expansion, reinforced in many countries by educational reforms, one might expect a drop in the impact of social background on educational opportunity.
However, empirical studies show that inequality of educational opportunity between social strata has been quite stable over time. Results from a variety of countries suggest that the proportion of people from lower socio-economic backgrounds gaining entry to universities is not likely to increase until the proportion from advantaged backgrounds reach a saturation level. All these factors have to be considered when designing strategies for improving equity and access to secondary school education.
Conclusions and Implications for Policy
The MLR results showed that effect of students’ SES on admission to national secondary schools clusters was significant. Students from high SES had the highest probability of being admitted in cluster 1 while those from middle SES were most likely to be admitted in cluster 2 national secondary schools. However, contrary to the expectation, students coming from high and middle SES seemed to decrease the probability of admission in to cluster 3 national secondary school, which are considered most prestigious.
References
1.Republic of Kenya (2005) Sessional on a Policy Framework for Education, Training and Research. Nairobi: Government Printers
.
2.OECD (2007) No More Failures: Ten Steps to Equity in Education, ISBN 978-92
-http://www.academicjournals.org/ERR
64-03259-0, € 24, 155 pages.
3.Chiuri LW, Kiumi JK (2005) Planning and Economics of Education.
Egerton.
4.Gutman LM, Midgely C (2000) The Role of Practice Factors in Supporting the academic Achievement of Poor African American Students During the Middle School Transition.
5.Keith ML (2005) Improving Access, Equity and Transition in Education. Retrieved from
http://www.create.rpc.org.
6.Malecki CK, Demaray MK (2006. Social support as a buffer in the relationship between socioeconomic status and academic performance. School Psychology Quarterly, 21:337-395.
7.Unesco (1994) The challenges of achieving gender parity in vasic education. Paris UNESCO.
8.Fields G (1980) Education & Income Distribution in Developing countries: A Review of the Literature. In Education and Income, ed T. King World Bank Staff Working 402: Washington D.C.
9.OECD (2011) “Does where a student lives affect his or her reading performance?” in PISA 2009 at a Glance, OECD Publishing.
http://dx.doi.org/10.1787/978926409525
0-24-en.
10. Mbani MO (2008) Factors Contributing to Drop out Among Female Students from Secondary Schools in Awendo Division. Unpublished M. Ed Thesis. Nairobi: University of Nairobi.
11. Ngatiari J (2011) Socio-economic factors influencing students’ academic performance
in secondary school in Meru South District, Kenya. Unpublished thesis, Moi University, Eldoret, Kenya.
12. Ngware WN, Eldan O, David IM, Domiano KM (2006) Improving Access to Secondary Education in Kenya: What can be done? Journal of the KIPPRA, Nairobi, Kenya.
13. Blossfeld HP, Shavit Y (1993) Persisting barriers: Changes in Educational Opportunities in Thirteen Countries (1-24).Colorado: West view Press Inc.
14. Onderi H, Makori A (2014) Understanding Realities, inequalities and implications associated with policy and practice in form one selection in secondary schools in Kenya. British Journal of Arts and Social Science. 17(1), 146-164. Retrieved on 30/05/2017 from
http://www.bjournal.co.uk/BLASS.aspx
15. Muindi B (2012) Parents doubt new national schools. Daily Nation, January 15th2012.[URL:http://www.nation.co.ke/Ne ws/parents+doubt+new+national+schools+/ -/1056/1306220/-/7y2xw1z/-/index.html (Accessed on03/03/2017)]
16. Alari OJ, Migosi J, Evusa Z (2013) Teachers’ and students’ perceptions about form one placement of students in public secondary schools in Mumias Division, Kakamega County, Kenya. Univertsal J. du. General Studies, 2(5):167-174.
17. Catholic News Agency for Africa (
c
) (2015) www.canaafrica.org/ index.php/home/16-latestnews/192-church-in-kenya- antsgovernment-to-review-criteria-for-secondary-school-admission.
18. Cohen L, Manion L, Morison K (2000) Research methods in Education. London: Rout ledge Falmer.
Appendices 1
Table 4: Chi-square Association between the Outcome variable and Statistically Significant Explanatory Variables
Association between χ2 df p Cramer's V
s61=National school cluster and mcases3= SES tertiles based on the MCA 162.60 6 <.001 0.2050 s61=National school cluster and s32 = Student's primary school was within
municipality 37.86 3 <.001 0.1399 s61=National school cluster and s33 = Student's primary school was single sex 31.99 3 <.001 0.1286 s61=National school cluster and s41 = Student's primary school county 765.46 135 <.001 0.3631 s61=National school cluster and s55 = Student is disabled 11.00 3 0.012 0.0754 s61=National school cluster and s56 = Respondent's admission status 75.14 6 <.001 0.1393
Note. df=degrees of freedom; Cramer's V: 0-.19=weak association; .20-.49=moderate association; >.49=strong association
Appendices 2
Table 5: Correlation matrix between the outcome variable and its interval-scale correlates
Variable s61 s227 s52a s54
s61 1.000
s227 a 0.027 1.000
b 0.244
s52a a 0.087 -0.026 1.000
b 0.000 0.258
s54 a 0.041 0.103 -0.029 1.000
b 0.072 0.000 0.209
Note: a=Pearson correlation coefficient; b=p-values (α=0.05); Pair-wise correlation: ≤0.35 = Weak correlation; 0.36-0.67 = Moderate correlation; 0.68-0.89=Strong correlation; ≥0.90 = Very strong correlation; Adapted from "Interpretation of correlation coefficient, "