Evaluating Performance
Nexus - Market Research Services - Bus Priorities
Research
Final Report for Nexus March 2011
This report, and information or advice which it contains, is provided by MVA Consultancy Ltd solely for internal use and reliance by its Client in performance of MVA Consultancy Ltd’s duties and liabilities under its contract with the Client. Any advice, opinions, or recommendations within this report should be read and relied upon only in the context of the report as a whole. The advice and opinions in this report are based upon the information made available to MVA Consultancy Ltd at the date of this report and on current UK standards, codes, technology and construction practices as at the date of this report.
Following final delivery of this report to the Client, MVA Consultancy Ltd will have no further obligations or duty to advise the Client on any matters, including development affecting the information or advice provided in this report. This report has been prepared by MVA Consultancy Ltd in their professional capacity as Consultants. The contents of the report do not, in any way, purport to include any manner of legal advice or opinion. This report is prepared in accordance with the terms and conditions of MVA Consultancy Ltd’s contract with the Client. Regard should be had to those terms and conditions when considering and/or placing any reliance on this report. Should the Client wish to release this report to a Third Party for that party's reliance, MVA Consultancy Ltd may, at its discretion, agree to such release provided that:
(a) MVA Consultancy Ltd's written agreement is obtained prior to such release, and
(b) by release of the report to the Third Party, that Third Party does not acquire any rights, contractual or otherwise, whatsoever against MVA Consultancy Ltd and MVA Consultancy Ltd, accordingly, assume no duties, liabilities or obligations to that Third Party, and
(c) MVA Consultancy Ltd accepts no responsibility for any loss or damage incurred by the Client or for any conflict of MVA Consultancy Ltd's interests arising out of the Client's release of this report to the Third Party.
Document Control
Project Title: Nexus - Market Research Services - Bus Priorities Research MVA Project Number: C3A38000
Document Type: Final Report
Directory & File Name: G:\Contracts\Contracts Live\C3A38000_Nexus Bus
Research\Reports\Final\20110302 Nexus C3A38000 Final Report V1.0.Doc
Document Approval
Primary Author: Chris Paterson Other Author(s): Shirley McCoard Reviewer(s): Martin Dix, Neill Birch Formatted by: Chris PatersonDistribution
Issue Date Distribution Comments
1 16/03/2011 Martin Dix For review
Nexus - Market Research Services - Bus Priorities Research 1
Contents
Executive Summary
2
1
Introduction and Summary of Methodology
2.1
1.1 Introduction 2.1
1.2 Background 2.1
1.3 Summary of Methodology 2.3
2
Phase 1 Qualitative Research
2.1
2.1 Introduction 2.1
2.2 Summary of issues raised 2.6
3
Phase 2 – Quantitative Research
3.1
3.1 Introduction 3.1
3.2 Respondent Demographics 3.1
3.3 Bus User Statistics and Origins 3.1
3.4 Bus Waiting Times 3.7
4
Interim Conclusions
4.1
4.1 Summary 4.1
5
Phase 3 – Qualitative Research
5.1
5.1 Introduction 5.1
5.2 Summary of Phase 3 Conclusions 5.11
6
Conclusion and Recommendations
6.1
6.1 Introduction 6.1
6.2 Key Findings 6.1
6.3 Recommended next steps 6.5
Tables
Table 2.1 Focus Group Recruitment Quota’s 2.1
Table 2.2 Factors which encourage bus use 2.4
Table 2.3 Improvement priorities – single most important priority for encouraging bus use2.4
Table 3.1 Age Breakdown 3.1
Table 3.2 Frequency of bus use 3.2
Table 3.3 Residence of Respondents by Bus User/Potential User 3.3 Table 3.4 Local Authority areas travelled within 3.3 Table 3.5 Local Authority areas travelled within by Bus User/Potential User 3.4
Contents
Nexus - Market Research Services - Bus Priorities Research 2 Table 3.7 Main reason for using the bus for bus users 3.6 Table 3.8 Journeys not made by bus that potentially could be 3.6 Table 3.9 Journeys not made by bus that potentially could be by Bus User/Potential User3.7 Table 3.10 Length of time waiting for a bus by for bus users 3.8 Table 3.11 Length of time waiting for a bus by for bus users by Residence 3.8 Table 3.12 Expectation of waiting times for a bus 3.9 Table 3.13 Expectation of waiting times for a bus by bus user/potential user 3.10 Table 3.14 Refusal rates when getting on a bus for bus users 3.10 Table 3.15 Getting a seat on the bus by bus users 3.11 Table 3.16 Key Facilities at an Interchange Point 3.12 Table 3.17 Satisfaction with bus services by bus users 3.13 Table 3.18 Factors preventing travel by bus more often 3.14
Table 3.19 Travel by bus more often 3.16
Table 3.20 Most and Least important priorities for improvement 3.18 Table 3.21 Most and Least important priorities for improvement by bus user/potential
user 3.19
Table 3.22 Potential trips made more often by bus users and potential users 3.22 Table 3.23 Activities if priorities were achieved 3.22 Table 3.24 Improved bus service by area of residence 3.24
Table 3.25 Consultation by area of residence 3.25
Table 3.26 Main improvement by area of residence 3.26
Table 5.1 Focus Group Recruitment Quotas 5.2
Table 5.2 Factors which encourage bus use (Phase 3 groups) 5.6 Table 5.3 Factors which encourage bus use (All groups, phases 1 and 3) 5.7 Table 5.4 Improvement priorities – single most important priority for encouraging bus use
(Phase 3 groups only) 5.7
Table 5.5 Improvement priorities – single most important priority for encouraging bus use
(All groups, phases 1 and 3) 5.7
Table 6.1 Summary of Conclusions and Recommended Next Steps 6.6
Figures
Figure 1.1 Trends in Bus Usage in the North East ... 2.1 Figure 2.1 Facilities necessary at Interchange Locations ... 2.5 Figure 3.1 Area of residence and areas travelled within ... 3.4 Figure 3.2 – Mode choice of potential users ... 3.5 Figure 3.3 Factors preventing bus travel ...3.14 Figure 3.4 Factors which encourage bus travel ...3.16 Figure 3.5 Improvement priorities per region ...3.19 Figure 3.6 Least Important factors per region ...3.19 Figure 3.7 Views on Network Improvements ...3.22 Figure Methodology... 2.3
Nexus - Market Research Services - Bus Priorities Research 2
Executive Summary
Background
Whilst bus user figures remain high in the North East, they have not been immune to the trends in steady decline witnessed across the UK over the past few decades. Considering the above, MVA Consultancy has been commissioned by Nexus, the Public Transport Executive for Tyne & Wear, to undertake market research services building upon previous studies of bus and non bus user attitudes. The outcomes of this work will assist Nexus in planning strategic changes to the bus network with the aim of growing patronage.
Nexus continue to undertake satisfaction surveys, and in addition, require this study to ‘drill down’ deeper into attitudes and perceptions, allowing a greater understanding of barriers to increased bus use (real and perceived) among both regular and non-regular bus user. This study is designed to shape strategic alterations to the network offering, which will support Nexus in the drive to grow bus ridership figures. Nexus hope this new research will provide an informed baseline to assist them in taking any next steps to redesign or reshape the bus network.
To this end, MVA Consultancy are in the process of undertaking focussed research involving qualitative and quantitative elements which will allow us to both add to current satisfaction data but also provide a better understanding of needs and priorities for service improvements among current users and non-users throughout the North East, and what changes to current service delivery will drive up patronage.
Methodology
The research comprised three distinct phases utilising both qualitative and quantitative techniques, designed to feed into each following phase providing a bespoke methodology which:
Identifies issues;
Quantitatively assess the scale of issues; and
Undertakes deeper research to understand the issues and tests possible solutions.
Phase 1 involved qualitative research based in the form of 4 representative focus groups
involving both bus users and potential bus users. The first qualitative phase allowed us to explore customer and potential customers’ needs and concerns, barriers to people using buses more than now, satisfaction with service aspects and trends in satisfaction, the drivers of differences in satisfaction and customer priorities for change and improvement. The initial phase, complemented and helped to design the large-scale quantitative interview survey and assist interpretation, leading to identification of strategic improvement options for testing in the second phase.
Phase 2 quantitative survey comprising 547 interviews with a representative and
statistically robust sample of users and potential users, network-wide. The survey was designed to compare frequent, infrequent and potential users’ satisfaction with aspects of bus services in the different areas, noting users satisfaction and both users’ and non-users’ key improvement priorities. Rather than simply asking people which improvements they would like to see, or which improvements would increase their current level of satisfaction, MVA explored which minimum improvements in each service aspect are needed to generate increased bus use.
0 Executive Summary
Nexus - Market Research Services - Bus Priorities Research 3 Upon conclusion of phases 1 and 2, we produced an interim report and discussion of findings documenting results from both the initial focus groups and quantitative survey before identifying a set of possible options for strategic improvements or improvement ‘packages’ to aspects of the current network, these interim recommendations were used as the basis for designing the final phase of the research.
Following consultation with Nexus on interim recommendations, we undertook Phase 3, the final phase of focus groups designed to obtain and monitor customer reactions to the improvement ideas which were tested in more depth. These focus groups were designed to help understand and explain the findings from the quantitative survey concerning differences in satisfaction between Partnership and other areas, and differences in the service improvement priorities expressed by different types of user and current non-user.
Each stage of the research was considered and built upon, which eventually fed into our final recommendations to Nexus.
Phase 1 – Initial Qualitative Research
The initial focus groups were convened across the Tyne and Wear area to establish outline opinions on the regional bus network. Findings from the focus groups were used to shape the second phase quantitative study. Focus groups were recruited according to strict quota controls to ensure that participants were representative of bus users and non-users throughout the Tyne and Wear area. Key themes were uncovered in phase 1 which merited further consideration in later stages of the research, themes included:
Frequency is a big issue in terms of persuading people to use the bus. Improved or
'turn up and go' service frequencies would allow greater flexibility and people would be more inclined to use the bus. When pushed, the magic number of 15 minute frequencies was raised;
Capacity appears to be a problem across Tyne and Wear, but in Newcastle in
particular, with groups citing examples of full buses not allowing passengers on. This problem can be worse for users in wheelchairs or mothers with buggies as there is limited space for them. Groups noted that at peak times and at weekends, queuing for over capacity buses was a real problem;
Reliability was an issue raised in all groups. All mentioned instances of buses
running late or failing to run at all;
Groups believed the bus network is difficult to understand, particularly through existing service information. Participants believed that this is a significant barrier to travel, some even noting they have in the past considered using the bus, but gave up when they could not understand the information;
The variety of ticket types is very confusing, the confusion itself can act as a barrier to travel. By far the most popular choice would be network ticketing valid across all operators. Potentially other modes, but the groups would at least like to see an 'all buses' ticket;
Value for money: the groups both noted they thought bus services were expensive,
the second group noted how much fares appear to have risen in recent years;
No one had heard of the idea of VPA's or had seen any publicity when told about
0 Executive Summary
Nexus - Market Research Services - Bus Priorities Research 4 explained, a number of participants believed that these arrangements should be statutory; and
Finally, participants were unanimous in stating they are never consulted on service changes and only learn about changes after the change has happened.
Phase 2 – Quantitative Study
To build on the initial evidence and tentative findings from phase 1, a comprehensive on street survey was undertaken, to further understand and quantify bus user satisfaction and both users and non-users’ priorities for improvements. Interviews were undertaken at 24 locations across Tyne and Wear, according to quota controls designed to achieve an even split between current bus users and potential users, and to ensure the sample would be representative in respect of age group, gender and area of residence. The age group and gender quotas were made to match those for the Nexus 2010 Customer Satisfaction Tracking survey. total there were 547 responses to the questionnaire. Of these, 67% (n=366) of respondents were female and 33% (n=181) of respondents were male.
Upon consideration of quantitative results, we undertook a detailed analysis and put together key themes and action points which related to both phases of the research, which would also later be taken forward for inclusion within the final stage. Conclusions included:
Although the focus groups highlighted every 15 mins as the minimum peak hour frequency, achieving frequencies of every 10 minutes or less seems to be a critical threshold for encouraging substantial extra take-up;
There were some fundamental inconsistencies in customers attitudes to ticketing, as participants seem to want multi operator ticketing but also want simplicity;
Satisfaction levels are generally good amongst bus users, with all of the satisfaction criteria scoring 65% or more satisfied or very satisfied. Users were most satisfied with safety and security on buses (91%) whilst value for money showed lowest levels of satisfaction at 65%.
In general, Value for money was seen as the biggest barrier to bus use. Improvement in perceived value for money, together with improved frequency and improved reliability have been highlighted as key areas which would encourage increased bus use. Moreover, while improved Value for money is a recurrent theme, bus user opinion on the value for money from their current services seems polarised. We need to understand what factors make some users feel very satisfied while others feel the opposite;
The majority of respondents did not feel there was appropriate consultation on service changes, since the majority of bus users interviewed in the quantitative survey said they had not been consulted on service changes in the past;
In terms of value for money, 61% indicated they would prefer a high cost service delivered to a premium standard rather than a low cost low frequency service. However, further exploration is needed to understand what factors drive perceived value for money: just what combination of fare and quality constitutes good value for money, and is the ideal balance different for customers in different parts of Tyne and Wear?
In addition to the main issues raised, Nexus and MVA Consultancy agreed that 3 key issues should be further explored as part of phase 3:
0 Executive Summary
Nexus - Market Research Services - Bus Priorities Research 5
Ticketing simplicity – specifically the degree to which ticketing simplicity is more or
less important than ticket cost;
Value for money – the degree to which people are willing to pay more money for a
better quality of service, or whether they prefer a low cost but basic service; and
Awareness of consultation – the awareness of consultations by bus operators to the
public of service and route changes.
Phase 3 – Final Qualitative Research
Consistent with phase 1, focus groups were recruited according to strict quota controls to ensure that participants were representative of bus users and non-users throughout the Tyne and Wear area. Whilst aspects of the focus group remained similar, the majority of the topic guide was reworked, taking cognisance of reported outcomes. Our investigations from phase three revealed the following:
Considering the above, several key themes arose which, we suggest, should be considered further:
Reliability or at the very least perceived reliability appears to be a problem with
bus services across Tyne and Wear. We have no actual reliability statistics to compare opinions with, this should be explored further. Additionally, should reliability statistics show buses are delivering appropriate standards, then Nexus and its Bus Operating partners undertake a publicity exercise to get the message across of how well buses are performing;
Lack of appropriate information, appears to be an issue in the area, with groups
noting they would not know where to find bus information or if they have, they often can not understand the information presented on internet sites. We would suggest Nexus consider producing an appropriate regional bus information strategy which specifies minimum standards for bus information, produced at stops and on the internet. Additionally, some form of publicity exercise may be appropriate to relay the message to the public of where they can find information and how easy it is to access;
Across each of the three phases we note an almost universal opinion that Tyne and Wear residents do not feel consulted or informed in any way of changes to bus services, timetables and routes. This lack of information on service changes only adds to feelings of unreliability of the bus network. Nexus and Bus Operators should work to ensure appropriate consultation is undertaken through a variety of mediums;
The research has consistently shown that residents of Tyne and Wear do not feel they get Value for Money with bus services in the region. Our initial exercises suggest that people will pay more for better value services. In general, the most popular choice of service improvement was improved journey times, often involving direct
routes
Recommendations
Upon conclusion of the research, we drew together each of the key findings, which allowed us to both report on specific conclusions and make recommendations on suggested next steps for Nexus and their partners which will support patronage growth on the bus network. The following table presents a summary of our conclusions and recommendations.
0 Executive Summary
Nexus - Market Research Services - Bus Priorities Research 6
Conclusions Recommended Next Steps
Improvements to bus information availability
Provide or update Regional Bus Information Strategy. Combine with publicity exercise
Real Time Information Consideration of RTI roll out on key corridors
Consultation on service changes
Work with Bus Operator Partners to ensure appropriate advertising and consultation is undertaken before changes to services are made
Information on pending service changes
Work with Bus Operator Partners to ensure effective spread of information on agreed service changes well in advance of implementation
Reliability Investigate bus reliability figures, if appropriate instigate remedial measures. Combine with publicity exercise to address public misperceptions of actual reliability.
Frequency Investigate frequencies on key routes and consider
increasing service frequencies to a consistent level across key strategic routes
Journey Times Review current journey times, particularly in peak
commuting time periods and for routes serving high density areas. Identify scope for improvement to achieve consistently good journey times. Combine any improvements with a publicity exercise
Value for Money Consideration of a fully representative stated preference exercise to quantify extent of willingness to pay more for service improvements, and to identify optimum packages in terms of delivering maximum value for money
Capacity Review boarding figures and if necessary undertake .a
series of boarding surveys to identify extent and impact of any current capacity constraints
Buses for shoppers Investigate scope for improved services to Out of Town shopping Centres, and for tailoring services to meeds the needs of shoppers and tap into potential demand, including maximising increased bus travel through appropriate service frequencies at peak shopping times
Ticketing Simplicity Undertake targeted research through focus groups
specifically designed around the issues of ticketing and the requirements of smart ticketing
Nexus - Market Research Services - Bus Priorities Research 2.1
1
Introduction and Summary of Methodology
1.1 Introduction
1.1.1 MVA Consultancy has been commissioned by Nexus, the Public Transport Executive for Tyne & Wear, to undertake market research services building upon previous studies of bus and non bus user attitudes. The outcomes of this work will assist Nexus in planning strategic changes to the bus network with the aim of growing patronage.
1.2 Background
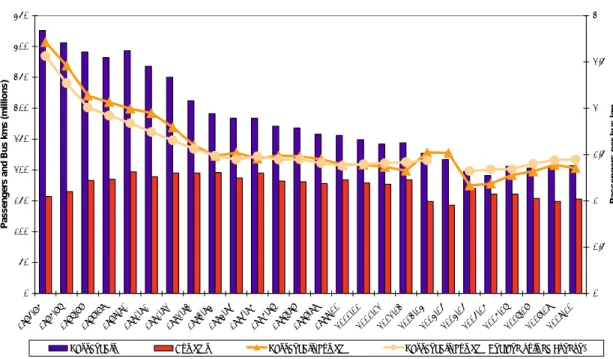
1.2.1 Whilst bus user figures remain high in the North East, they have not been immune to the trends in steady decline witnessed across the UK over the past few decades. This can be illustrated by the following data, which shows that whilst bus passenger journeys in the North East have fallen by around 50% since deregulation in 1986, supply in the market has been largely unchanged, resulting in a reduction in passengers carried per kilometre operated. The trend in the North East has largely followed that of England as a whole (outside London), with evidence of some recovery since 2004/051.
Trends in Bus Use 1985/86 - 2009/10
0 50 100 150 200 250 300 350 400 450 1985 /86 1986 /87 1987 /88 1988 /89 1989 /90 1990 /91 1991/9 2 1992 /93 1993 /94 1994 /95 1995 /96 1996/9 7 1997 /98 1998 /99 1999 /00 2000 /01 2001/0 2 2002 /03 2003 /04 2004/0 5 2004 /05 2005/0 6 2006 /07 2007 /08 2008/0 9 2009 /10 Passe n g ers an d Bu s kms ( m illio n s ) 0 0.5 1 1.5 2 2.5 3 P a s s e nger s pe r bus km
Passengers Bus kms Passengers/bus km Passengers/bus km (England outside London)
Figure 1.1 Trends in Bus Usage in the North East
1.2.2 Nexus continue to undertake satisfaction surveys, and in addition, require this study to ‘drill down’ deeper into attitudes and perceptions, allowing a greater understanding of barriers to increased bus use (real and perceived) among both regular and non-regular bus user. This study is designed to shape strategic alterations to the network offering, which will support Nexus in the drive to grow bus ridership figures.
1 Based on Bus Statistics for the UK published by DfT (December 2010) -
1 Introduction and Summary of Methodology
Nexus - Market Research Services - Bus Priorities Research 2.2 1.2.3 Nexus note that whilst services are generally provided commercially, bus operators receive approximately 45% of their income from the public sector through a variety of means including:
Service subsidies;
BSOG; and
Concessionary fares.
1.2.4 Despite this large proportion of funding from the public purse, Nexus feel that there is not a proportionate control of services/offerings by the public sector. To date Nexus have instigated Quality Corridors (Super Routes) and a number of Voluntary Partnerships, East Gateshead Voluntary Partnership and South Tyneside Better Bus Network. Nexus hope this new research will provide an informed baseline to assist them in taking any next steps to redesign or reshape the bus network.
1.2.5 To this end, MVA Consultancy are in the process of undertaking focussed research involving qualitative and quantitative elements which will allow us to both add to current satisfaction data but also provide a better understanding of needs and priorities for service improvements among current users and non-users throughout the North East, and what changes to current service delivery will drive up patronage.
1.2.6 This document reports all findings of the research, including each key phase, before considering outputs and recommendations to Nexus.
1.2.7 Due to the bespoke linear methodology incorporated, we have structured our report to ‘tell the story’ of the research from inception through to outcomes and recommendations. The following section summarises the methodology adopted, whilst each of the three phases of research are documented within their own chapter. We present interim conclusions and recommendations within chapter 4, these interim recommendations guided the final phase of research which is documented within chapter 5. Following this we present conclusions and recommendations in the final section.
1 Introduction and Summary of Methodology
Nexus - Market Research Services - Bus Priorities Research 2.3
1.3 Summary of Methodology
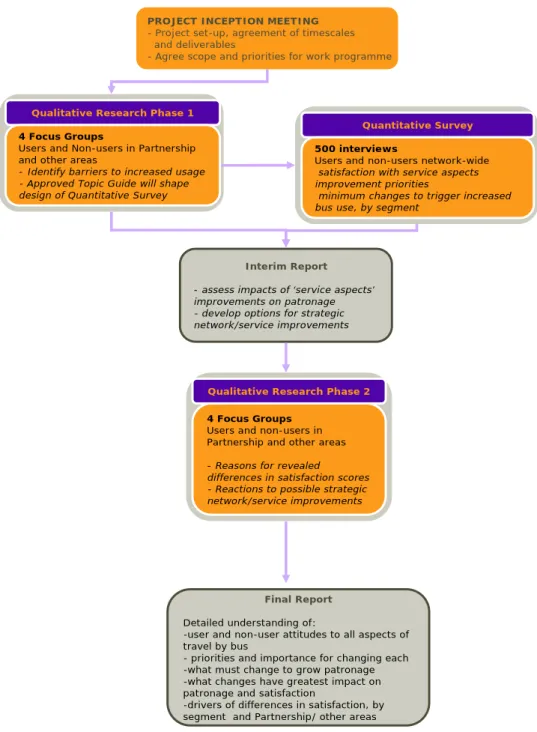
1.3.1 Considering both Nexus’s objectives and future network development plans, MVA designed a bespoke 3 phase methodology utilising both qualitative and quantitative research techniques to gauge both current satisfaction levels and also priorities for future improvements. The methodology adopted is summarised in figure 1.2 below.
PROJECT INCEPTION MEETING
- Project set-up, agreement of timescales and deliverables
- Agree scope and priorities for work programme
Qualitative Research Phase 1 4 Focus Groups
Users and Non-users in Partnership and other areas
- Identify barriers to increased usage
- Approved Topic Guide will shape design of Quantitative Survey
Quantitative Survey 500 interviews
Users and non-users network-wide
satisfaction with service aspects improvement priorities
minimum changes to trigger increased bus use, by segment
Interim Report
- assess impacts of ‘service aspects’
improvements on patronage - develop options for strategic network/service improvements
Qualitative Research Phase 2
4 Focus Groups Users and non-users in Partnership and other areas - Reasons for revealed
differences in satisfaction scores - Reactions to possible strategic network/service improvements
Final Report
Detailed understanding of:
-user and non-user attitudes to all aspects of travel by bus
- priorities and importance for changing each -what must change to grow patronage -what changes have greatest impact on patronage and satisfaction
-drivers of differences in satisfaction, by segment and Partnership/ other areas Figure 1.2 Methodology
1.3.2 The main elements of our approach are as follows.
1.3.3 Two phases of qualitative research with both current users and non-users who are
potential bus users, in partnership and non-partnership areas. In both these qualitative phases we explore customer and potential customers’ needs and concerns, barriers to people
1 Introduction and Summary of Methodology
Nexus - Market Research Services - Bus Priorities Research 2.4 using buses more than now, satisfaction with service aspects and trends in satisfaction, the drivers of differences in satisfaction and customer priorities for change and improvement. 1.3.4 The first phase, comprising four focus groups, complemented and helped to design the
large-scale quantitative interview survey and assist interpretation, leading to identification of strategic improvement options for testing in the second phase. This second phase has explored reactions of users and non users in all five Districts.
1.3.5 A quantitative survey comprising a minimum of 500 interviews with representative and statistically robust samples of users and potential users, network-wide. By ‘potential users’ we mean non-users, excluding people who have not and would never consider using buses (as it would be wasteful of survey resources to include them in research aimed at finding ways of increasing patronage). The survey was designed to compare frequent, infrequent and potential users’ satisfaction with aspects of bus services in the different areas, noting users satisfaction and both users’ and non-users’ key improvement priorities. Rather than simply asking people which improvements they would like to see, or which improvements would increase their current level of satisfaction, MVA explored which minimum improvements in each service aspect are needed to generate increased bus use. This exercise established which improvements to current levels of service (eg frequency, personal security on the bus, provision of bus shelters etc) would encourage users (especially currently infrequent ones) to use buses more often.
1.3.6 Upon conclusion of phases 1 and 2, we produced an interim report and discussion of findings documenting results from both the initial focus groups and quantitative survey before identifying a set of possible options for strategic improvements or improvement
‘packages’ to aspects of the current network, these interim recommendations can be found
within chapter 4, which was used as the basis for designing the final phase of the research. 1.3.7 Following consultation with Nexus on interim recommendations, we undertook the final
phase of focus groups designed to obtain and monitor customer reactions to the
improvement ideas which were tested in more depth. These focus groups were designed to
help understand and explain the findings from the quantitative survey concerning differences in satisfaction between Partnership and other areas, and differences in the service improvement priorities expressed by different types of user and current non-user. Chapter 5 documents the findings of the final focus group, whilst chapter 6 presents a discussion of key findings arising from within the research along with suggested next steps for Nexus to consider.
1.3.8 It is important to note that we do not describe the detailed methodology and process behind each phase within this final report, instead we concentrate on producing detailed findings and considered recommendations. Our full methodology was included within our research tender, and appropriate research materials such as focus group topic guides and the quantitative survey can be found within the appropriate appendices.
Nexus - Market Research Services - Bus Priorities Research 2.1
2
Phase 1 Qualitative Research
2.1 Introduction
2.1.1 Four initial focus groups were convened across the Tyne and Wear area to establish outline opinions on the regional bus network. Findings from the focus groups were used to shape the second phase quantitative study.
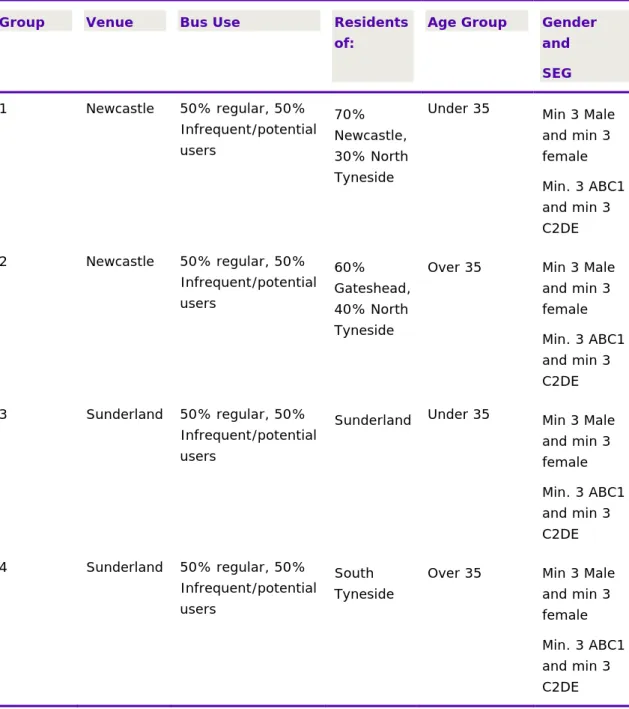
2.1.2 Focus groups were recruited according to strict quota controls to ensure that participants were representative of bus users and non-users throughout the Tyne and Wear area. Recruitment criteria are documented within the table below.
Table 2.1 Focus Group Recruitment Quota’s
Group Venue Bus Use Residents
of:
Age Group Gender
and SEG 1 Newcastle 50% regular, 50% Infrequent/potential users 70% Newcastle, 30% North Tyneside
Under 35 Min 3 Male and min 3 female Min. 3 ABC1 and min 3 C2DE 2 Newcastle 50% regular, 50% Infrequent/potential users 60% Gateshead, 40% North Tyneside
Over 35 Min 3 Male and min 3 female Min. 3 ABC1 and min 3 C2DE 3 Sunderland 50% regular, 50% Infrequent/potential users
Sunderland Under 35 Min 3 Male and min 3 female Min. 3 ABC1 and min 3 C2DE 4 Sunderland 50% regular, 50% Infrequent/potential users South Tyneside
Over 35 Min 3 Male and min 3 female Min. 3 ABC1 and min 3 C2DE
2 Phase 1 Qualitative Research
Nexus - Market Research Services - Bus Priorities Research 2.2 2.1.3 Ten people were recruited to take part in each group with the expectation that, after some drop-out, around eight people would attend. Focus Groups were all well attended with every group registering at least 70%. Attendance at each group was as follows:
Group 1 – 10 participants, 100%
Group 2 – 10 participants, 100%;
Group 3 – 7 participants, 70%; and
Group 4 – 9 participants, 90%.
2.1.4 The remainder of this chapter details the issues raised during the focus groups.
Initial Thoughts on Bus Use
2.1.5 Each focus group was initiated with a general discussion of bus use, and reasons why participants chose not to use the bus. This initial discussion was unprompted and designed to elicit baseline opinions on bus services. Responses across all groups consistently noted the following key reasons for not using the bus:
Lack of knowledge of bus services and perceived lack of service information;
Preference for using other modes, particularly the Tyne and Wear Metro System; and
Capacity issues on the bus.
2.1.6 Considering the Metro system, participants believed the Metro to be more comfortable, particularly for users with children and prams. Additionally, capacity issues recognised on the bus were a factor on the Metro and due to the unique route colour coding, the system was easier to understand than the bus network. The most important consideration however appeared to be that unlike the bus, the Metro System does not suffer from traffic congestion. Participants however believed that the bus was inherently safer from a personal security view than the Metro, particularly at night.
Bus Information
2.1.7 Whilst most participants were aware that bus network information was available at bus stops, interchanges and on line, when probed deeper those with any experience of searching or using the information believed it was difficult to understand. This lack of information was flagged up as a significant barrier to bus use, with more than one participant noting they had previously begun searching for bus information but gave up when they could not find/understand timetables and decided to use their car instead.
“If I thought it was going to be too much of a hassle to find the information, I would just use the car.”
2.1.8 In general, bus timetables were viewed as difficult to understand, this was true for both online timetables and information at bus stops. Sourcing and understanding the actual timetables themselves was believed to be a problem, and only resolved at key bus stations or interchange points which displayed live bus departure boards.
2.1.9 In terms of the services themselves, groups believed that services, routes and timetables changed so frequently it was difficult to keep accurately informed. Taking this point further, the groups were asked if they felt they had been consulted on service changes in the past, or
2 Phase 1 Qualitative Research
Nexus - Market Research Services - Bus Priorities Research 2.3 informed prior to service changes being made. Consistently, attendees indicated they had never been consulted prior to service changes.
“When they last changed the bus services, I was standing at the bus stop and it was too late to do anything about it.”
Since the perceived lack of appropriate bus information is a potential barrier to bus travel, we would like to further explore how bus information could be improved.
Bus Providing Access to facilities
2.1.10 Participants in each of the focus groups were provided with a list of general amenities and asked to rate how well the bus serves each location. Results were primarily as follows:
Work – bus services are generally suitable, however can be crowded at peak times;
Education – generally all groups felt this was adequately serviced, believing this has
improved significantly in recent years;
Shopping – Out of town shopping centres not easy to get to unless you first travel to
a main town/city and change bus;
Healthcare – most agreed bus links were appropriate, however there was a belief
that Rake Lane (ie North Tyneside General) Hospital is poorly served; and
Leisure facilities – those located within city centres are accessible, those outside can
be troublesome.
Frequency
2.1.11 Each focus group believed that improved bus frequency would encourage bus use, turn up and go bus services would help all types of passenger, particularly commuters as it takes issues of bus reliability out of the equation.
2.1.12 When prompted, one of the groups believed a peak period 15 minute frequency was reasonable to expect and would significantly encourage bus use.
We note that 15 min frequency is usually viewed as too low in other parts of UK, and wouldn’t integrate well with Metro which runs every 12 minutes. We believe this should be explored further.
2.1.13 Groups also noted that there are capacity issues with bus services in Tyne and Wear, most groups reported not being able to get on the bus they wish due to it being full; this problem was particularly acute for mothers with prams, or anyone with accessibility requirements. Groups believed that an increase in bus frequency would help to tackle capacity problems.
Important Factors when choosing to use the bus
2.1.14 Participants in each of the four groups were asked to name the key factors which encourage bus use. This was an unprompted exercise, the results are shown in the table below. As expected, lower fares were the most cited factor which would encourage bus use, closely followed by frequency, reliability of services and bus cleanliness.
2 Phase 1 Qualitative Research
Nexus - Market Research Services - Bus Priorities Research 2.4
Table 2.2 Factors which encourage bus use
Factor noted Groups raised
Cost 4 Reliability 3 Frequency 3 Direct routes 1 Information 2 Journey time 1 Cleanliness 3 Safety 1 Driver Attitude 1
Areas for prams/wheelchairs 1
2.1.15 Each group was split into users and non users and asked to note the most important single factor which, if improved, would encourage increased bus use. Responses are shown in table 2.3 below. Generally speaking both reliability and frequency are viewed as important by both regular and non regular users.
Table 2.3 Improvement priorities – single most important priority for encouraging bus use
Factor Regular users Non regular users
Reliability 1 1
Frequency 1 1
Journey Times 1
Information 1
Safety and security 1
Driving standards 1
Voluntary Partnerships
2.1.16 There are currently two Voluntary Partnership Areas (VPAs) within Tyne and Wear area, located within South Tyneside and East Gateshead. Across each of the four groups, no one was aware of either of the VPAs and only one member of the Gateshead group commented that she thought her local services were of a better quality. When informed of the purpose of VPAs, groups believed they were a good idea. However, the groups questioned why they should be necessary, believing that all partners should automatically provide the best possible service, stating that commitments to providing excellent service through improved frequency and quality should be mandatory.
Interchanging
2.1.17 The requirement for bus interchange appears to be common in the Tyne and Wear area with all groups recognising and experiencing the need. In general, interchange appears to be tolerated, particularly when it is facilitated at one of the network’s interchange stations which
2 Phase 1 Qualitative Research
Nexus - Market Research Services - Bus Priorities Research 2.5 in general participants rated highly. Interchange with other modes, particularly the Metro, appears to be common in Tyne and Wear, and participants are familiar and accepting of the concept.
2.1.18 Whilst participants generally accepted the need to interchange, and were approving of interchange facilities, issues and barriers to interchange were also mentioned. The most common barriers noted were problems arising from the lack of integrated ticketing across the network. For many customers this is a deterrent to using buses more than now. Often when commuters interchange, they have to use two different operators which results in two unique tickets, in effect doubling the cost. Participants felt interchange would be more appealing should integrated ticketing across the network be provided. Other issues raised with interchange were service frequencies: in general, interchange could be accepted if there was an appropriate integrated bus timetable.
We recognise that multi-operator ticketing in Nexus area is available and comparable with other regions within the UK. As such we feel further exploration of this point would be useful.
2.1.19 Each of the four groups were asked to name the facilities they believed necessary at interchange stations, results are shown in figure 2.1 below. All groups noted that Bus information and in particular Real Time Information was an important requirement of interchange, whilst toilets and a secure enclosed space were also deemed very important. Half of the groups indicated that integrated services were important to cut down waiting times. It should be noted that this was an unprompted exercise and responses were not influenced or encouraged by the moderator.
0 1 2 3 4
Enclosed Safe Seating Toilets Cleanliness Information
boards/RTI Integrated services G roups noted
2 Phase 1 Qualitative Research
Nexus - Market Research Services - Bus Priorities Research 2.6
Ticketing
2.1.20 Whilst ticket prices were viewed as overly expensive across the groups, the most commonly raised concern was the lack of understanding of the ticketing system. In particular the requirements to buy different operator tickets which will be needed on certain journeys. There were numerous examples cited of participants having to buy a second ticket as they were attempting to board another operators bus. This theme appeared to be commonplace and even angered those who had not experienced this problem.
“I’d be really cross if I had bought my bus ticket and I found out I couldn’t use a specific bus”
2.1.21 Respondents also noted the vast array of ticketing options available to them and found this to be confusing, listing single journey tickets, zone tickets, operator tickets and network tickets. In general there was a preference for multi modal network tickets however all groups noted these were very expensive.
Cost of services was mentioned across all groups, we believe the issue of what constitutes improved value for money warrants further exploration.
We recognise the inconsistencies here as participants seem to want multi operator ticketing but also want simplicity. We feel further exploration of this point would be useful in phase 3.
2.1.22 Participants also noted that even when they tried to find information on ticketing systems, they found this to be confusing with some mentioning that they could not understand information available on the internet and would instead ask bus drivers or go to interchange stations for ticketing information.
2.1.23 A number of groups pointed out they had experienced the London Oyster Card system and believed a similar system in Tyne and Wear would be very useful.
“An oyster card would be better, it makes it quicker, easier, and it makes it cheaper too. You can use them on trains, buses, everything.”
2.2 Summary of issues raised
2.2.1 Considering the above, several key themes were uncovered which were considered when designing the quantitative research:
Frequency is a big issue in terms of persuading people to use the bus. Improved or
'turn up and go' service frequencies would allow greater flexibility and people would be more inclined to use the bus. When pushed, the magic number of 15 minute frequencies was raised;
Capacity appears to be a problem across Tyne and Wear, but in Newcastle in
particular, with groups citing examples of full buses not allowing passengers on. This problem can be worse for users in wheelchairs or mothers with buggies as there is
2 Phase 1 Qualitative Research
Nexus - Market Research Services - Bus Priorities Research 2.7 limited space for them. Groups noted that at peak times and at weekends, queuing for over capacity buses was a real problem;
Reliability was an issue raised in all groups. All mentioned instances of buses
running late or failing to run at all;
Groups believed the bus network is difficult to understand, particularly through existing service information. Participants believed that this is a significant barrier to travel, some even noting they have in the past considered using the bus, but gave up when they could not understand the information;
The variety of ticket types is very confusing, the confusion itself can act as a barrier to travel. By far the most popular choice would be network ticketing valid across all operators. Potentially other modes, but the groups would at least like to see an 'all buses' ticket;
Value for money: the groups both noted they thought bus services were expensive,
the second group noted how much fares appear to have risen in recent years;
No one had heard of the idea of VPA's or had seen any publicity when told about
the East Gateshead and South Tyneside VPA, however when the concept of a VPA was explained, a number of participants believed that these arrangements should be statutory; and
Finally, participants were unanimous in stating they are never consulted on service changes and only learn about changes after the change has happened.
Nexus - Market Research Services - Bus Priorities Research 3.1
3
Phase 2 – Quantitative Research
3.1 Introduction
3.1.1 To build on the initial evidence and tentative findings from phase 1, a comprehensive on street survey was undertaken, to further understand and quantify bus user satisfaction and both users and non-users’ priorities for improvements. The quantitative questionnaire was designed in partnership with Nexus and can be found within appendix A).
3.1.2 Interviews were undertaken at 24 locations across Tyne and Wear, according to quota controls designed to achieve an even split between current bus users and potential users, and to ensure the sample would be representative in respect of age group, gender and area of residence. The age group and gender quotas were made to match those for the Nexus 2010 Customer Satisfaction Tracking survey. This consistency will afford Nexus the ability to accurately monitor changes in satisfaction without introducing response bias. Non-users who would never consider using bus were filtered out of the sample.
3.2 Respondent Demographics
3.2.1 In total there were 547 responses to the questionnaire. Of these, 67% (n=366) of respondents were female and 33% (n=181) of respondents were male.
3.2.2 All respondents detailed their age. Over a quarter (29%, n=158) of respondents were aged 65 or over, with 14% (n=77) in the 55-64 age category, 14% (n=78) aged 45-54, 11% (n=61) aged 35-44, 16% (n=85) aged 25-34, and 16% (n=88) aged between 16-24.
Table 3.1 Age Breakdown
Age N % 16 - 24 88 16% 25 - 34 85 16% 35 - 44 61 11% 45 - 54 78 14% 55 - 64 77 14% 65 or over 158 29% Total 547 100%
3.2.3 Almost all respondents were white (n=540) while four respondents were Black/African/Caribbean/Black British, and three respondents were Asian/Asian British.
3.3 Bus User Statistics and Origins
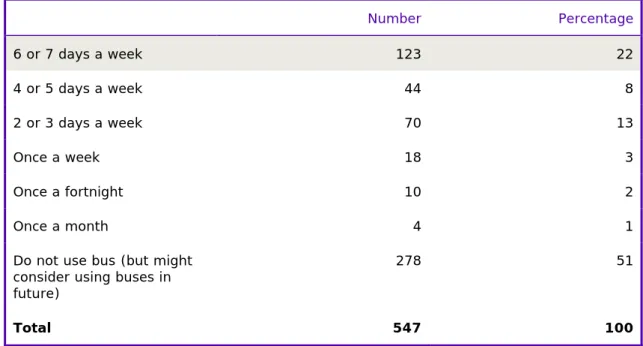
3.3.1 Respondents were asked how frequently they use the bus, with all 547 respondents providing an answer. Table 3.2 below details that 49% of respondents (n=269) of respondents classified themselves as a bus user (n=269), with 30% (n=167) of these respondents stating they use the bus over 4 days a week, while just over half (51%, n=278)
3 Phase 2 – Quantitative Research
Nexus - Market Research Services - Bus Priorities Research 3.2 of respondents stated they currently do not use buses but might consider making some journeys by bus in future (potential users). As already noted, non-users who would never consider using bus were filtered out of the sample.
Table 3.2 Frequency of bus use
Number Percentage 6 or 7 days a week 123 22 4 or 5 days a week 44 8 2 or 3 days a week 70 13 Once a week 18 3 Once a fortnight 10 2 Once a month 4 1
Do not use bus (but might consider using buses in future)
278 51
Total 547 100
3.3.2 Just over half (53% (n=288) of respondents had a car available for their own use while 47% (n=259) did not. Looking at this by bus user/potential user, over three quarters (77%, n-213) of potential users had a car available for their own use compared to 28% (n=75) of bus users.
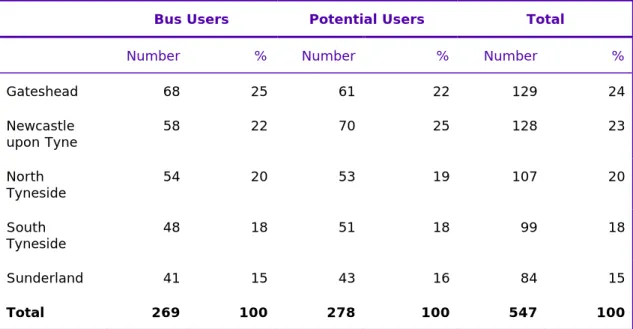
3.3.3 Table 3.3 below details that there was a good representation of respondents from Local Authority areas in the Tyne and Wear area. Looking at residence of respondent by whether they are a bus user or potential bus user, Table 3.3 shows that 25% (n=68) of bus users were resident in Gateshead, while 20% (n=58) of bus users were resident in Newcastle upon Tyne. Similarly, 22% (n=61) of potential users were resident in Gateshead, while 25% (n=70) were resident in Newcastle upon Tyne.
3 Phase 2 – Quantitative Research
Nexus - Market Research Services - Bus Priorities Research 3.3
Table 3.3 Residence of Respondents by Bus User/Potential User
3.3.4 In addition to where respondents lived, all were asked which Local Authority areas they travel within. Table 3.4 details the responses given by all 547 respondents. The results show that Newcastle was the Local Authority most frequently travelled within.
Table 3.4 Local Authority areas travelled within
Number of Responses % of Cases
Gateshead 205 38
Newcastle Upon Tyne 376 69
North Tyneside 215 39
South Tyneside 165 30
Sunderland 177 32
Other 57 10
Total 1195 218
Note: Totals do not equal 100% due to multiple responses
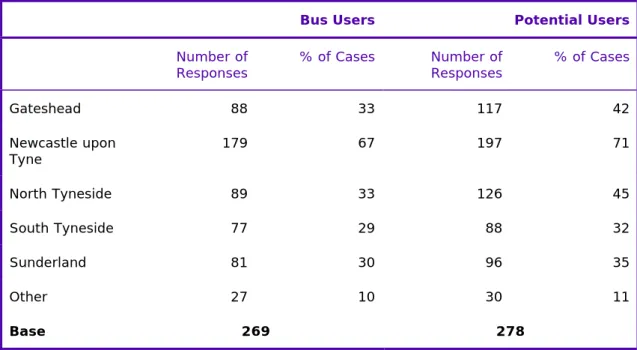
3.3.5 Similarly, looking at Local Authority areas respondents travel in by whether they are a bus user or potential bus user, Table 3.5 shows that 67% (n=179) of bus users travelled in Newcastle upon Tyne. For potential users, this figure is slightly higher, with 71% (n=197) of potential users travelling in Newcastle upon Tyne.
We note the importance of bus travel within Newcastle Upon Tyne in particular and believe this area has particular potential for converting potential users into bus users. This should be explored further.
Bus Users Potential Users Total
Number % Number % Number %
Gateshead 68 25 61 22 129 24 Newcastle upon Tyne 58 22 70 25 128 23 North Tyneside 54 20 53 19 107 20 South Tyneside 48 18 51 18 99 18 Sunderland 41 15 43 16 84 15 Total 269 100 278 100 547 100
3 Phase 2 – Quantitative Research
Nexus - Market Research Services - Bus Priorities Research 3.4 Table 3.5 Local Authority areas travelled within by Bus User/Potential User
3.3.6 Looking at Local Authority areas travelled within by the area that respondents are resident, it can be seen that, as expected, respondents are most likely to travel in the Local Authority of which they are a resident. In addition, over three quarters of respondents in Gateshead (78%, n=101) and North Tyneside (76%, n=81) stated that they travel in Newcastle Upon Tyne, and over a half of respondents in South Tyneside (54%, n=53) stated that they also travel in Sunderland. 0 10 20 30 40 50 60 70 80 90 100
Gateshead Newcastle upon Tyne
North Tyneside South Tyneside Sunderland
Area of Residence
%
Gateshead Newcastle upon Tyne North Tyneside South Tyneside Sunderland Other Figure 3.1 Area of residence and areas travelled within
Bus Users Potential Users
Number of
Responses % of Cases Number of Responses % of Cases
Gateshead 88 33 117 42 Newcastle upon Tyne 179 67 197 71 North Tyneside 89 33 126 45 South Tyneside 77 29 88 32 Sunderland 81 30 96 35 Other 27 10 30 11 Base 269 278
3 Phase 2 – Quantitative Research
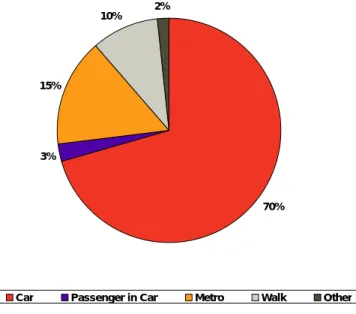
Nexus - Market Research Services - Bus Priorities Research 3.5 3.3.7 Potential users were asked what their main mode of travel was for journeys in Tyne and
Wear. Figure 3.2 shows that almost three quarters (70.5%, n=196) of the 278 potential users who specified their main mode of travel, used a car.
70% 3%
15%
10% 2%
Car Passenger in Car Metro Walk Other
Figure 3.2 – Mode choice of potential users
Noting potential bus users’ extensive current use of car we need to explore which factors would encourage which types of potential user out of their cars on at least some types of journey
3.3.8 Those respondents that were classed as bus users (n=269) were asked what times of the day they generally use the bus. In 85% of cases, bus users used the bus between 9.30am and 4.00pm (see Table 3.6).
Table 3.6 Times of the Day Bus Used
Number of Responses % of Cases
7.00am-9.30am (AM Peak) 89 33
9.30am-4.00pm (Off/Inter Peak) 229 85
Weekend 46 17
4.00pm-6.30pm (PM Peak) 78 29
6.30pm onwards (Evening Services) 49 18
Total 491 182
Note: Totals do not equal 100% due to multiple responses
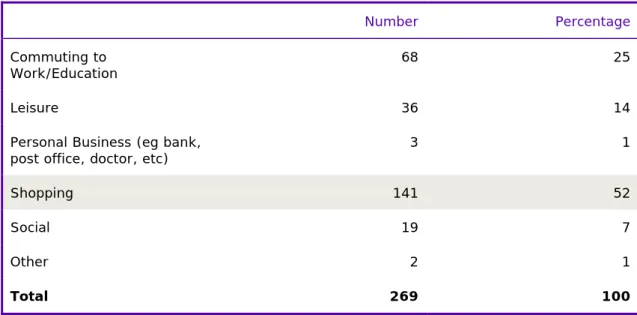
3.3.9 Bus users were asked to specify their most common reason for using the bus. Table 3.7 shows that over half (52%, n=141) of the 269 respondents who answered the question, stated that they used the bus mostly for shopping.
3 Phase 2 – Quantitative Research
Nexus - Market Research Services - Bus Priorities Research 3.6
Table 3.7 Main reason for using the bus for bus users
Number Percentage
Commuting to
Work/Education 68 25
Leisure 36 14
Personal Business (eg bank,
post office, doctor, etc) 3 1
Shopping 141 52
Social 19 7
Other 2 1
Total 269 100
3.3.10 All respondents were asked to think of the journeys that they make and if they could potentially make any of these by bus where they currently use another mode of transport. Table 3.8 shows that of the 546 respondents that provided a response to this question; in 41% of cases respondents stated ‘other’. Almost all of the ‘other’ reasons cited were that the respondent could not think of any other trips that they could make by bus.
Table 3.8 Journeys not made by bus that potentially could be
Number of Responses % of Cases
Commuting to Work/Education 73 13
Leisure 128 24
Personal Business (eg bank, post office,
doctor, etc) 57 10
Shopping 165 30
Social 123 23
Other 224 41
Total 770 141
Note: Totals do not equal 100% due to multiple responses
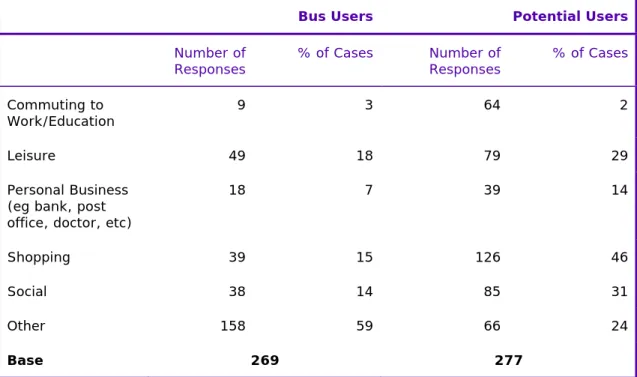
3.3.11 Considering journeys that are not made by bus that potentially could be by bus users and potential user, Table 3.9 shows that bus users are more likely to say other (59%, n=158), most of whom stated that they could not think of any other trips that they could make by bus. Potential users were more likely to state that they could potentially go shopping (46%, n=126) using the bus than any other activity.
There appears to be special potential for encouraging shoppers to use the bus more often. Opportunities and barriers to achieving this merit further exploration.
3 Phase 2 – Quantitative Research
Nexus - Market Research Services - Bus Priorities Research 3.7
Table 3.9 Journeys not made by bus that potentially could be by Bus User/Potential User
Note: Totals do not equal 100% due to multiple responses
3.4 Bus Waiting Times
3.4.1 Bus users were asked, on average, how long they generally have to wait for a bus. Table 3.10 shows that over half (56%, n=151) of the 269 respondents who stated that they have to wait less than 10 minutes, with a further 30.5% (n=82) stating that they have to wait up to 15 minutes. Only 13% (n=36) of respondents stated that they generally had to wait over 15 minutes.
Table 3.10 Length of time waiting for a bus by for bus users
Number Percentage
Less than 10mins 151 56
Up to 15 mins 82 31
Up to 30 mins 31 11
Up to 1 hour 4 2
Total 268 100
3.4.2 Looking at bus waiting times by area of residence, Table 3.11 shows that over half of respondents in Gateshead (57%, n=), South Tyneside (60%, n=), and as many as 81% (n=) of respondents in Sunderland waited less than 10 minutes for a bus.
Bus Users Potential Users
Number of
Responses % of Cases Number of Responses % of Cases
Commuting to
Work/Education 9 3 64 2
Leisure 49 18 79 29
Personal Business (eg bank, post office, doctor, etc)
18 7 39 14
Shopping 39 15 126 46
Social 38 14 85 31
Other 158 59 66 24
3 Phase 2 – Quantitative Research
Nexus - Market Research Services - Bus Priorities Research 3.8
Table 3.11 Length of time waiting for a bus by for bus users by Residence
% Gateshead upon Tyne Newcastle Tyneside North Tyneside Sunderland South N
Less than 10mins 57 43 48 60 81 151 Up to 15 mins 25 45 43 23 12 82 Up to 30 mins 16 12 6 15 7 31 Up to 1 hour 2 - 4 2 - 4 Total 100 100 100 100 100 268
3.4.3 All respondents were asked what they feel would be a reasonable level of time when waiting for a bus, first in peak times and then in off peak times. Of the 547 respondents who specified, 71% (n=387) said that they would expect to wait less than 10 minutes for a bus in peak times, while this figure was 73% (n=401) in off peak/weekend times.
Table 3.12 Expectation of waiting times for a bus
Peak Times Off Peak Times
Number Percentage Number Percentage
Less than 10mins 387 71 401 73 Up to 15 mins 119 22 101 19 Up to 30 mins 5 1 10 2 Up to 1 hour - - - - D/K 36 6 35 6 Total 547 100 547 100
Although the focus groups highlighted every 15 mins as the minimum peak hour frequency, achieving frequencies of every 10 minutes or less seems to be a critical threshold for encouraging substantial extra take-up: this should be explored further.
3.4.4 Looking at expectation of waiting times by whether the respondent was a bus user or a potential user, Table 3.13 shows that around a quarter of both bus users and potential users feel that they should wait less than 10 minutes for a bus in both peak times and off peak times.
3 Phase 2 – Quantitative Research
Nexus - Market Research Services - Bus Priorities Research 3.9
Table 3.13 Expectation of waiting times for a bus by bus user/potential user
Peak Times Off Peak Times
Bus User Potential User Bus User Potential User
N % N % N % N % Less than 10mins 207 78 180 74 221 82 180 74 Up to 15 mins 56 21 63 26 43 16 58 24 Up to 30 mins 4 2 1 <1 4 2 6 2 Up to 1 hour - - - - - - - - D/K - - - - - - - - Total 267 100 244 100 268 100 244 100
3.4.5 Bus users were asked how often they get refused when trying to get on the bus service they intended to travel on (ie because the bus has reached capacity). Table 3.14 shows that of the 268 respondents who answered the question, 72% (n=192) stated that they never get refused when trying to get on a bus.
Table 3.14 Refusal rates when getting on a bus for bus users
Number Percentage Always 6 2 Usually 14 5 Sometimes 15 6 Rarely 41 15 Never 192 72 Total 268 100
3.4.6 Bus users were also asked how often they get a seat when travelling on the bus service they intended to travel on. Table 3.15 shows that of the 269 respondents who answered the question, almost half (46%, n=123) stated that they always get a seat, followed by 30% (n=80) who stated that they usually get a seat.
3 Phase 2 – Quantitative Research
Nexus - Market Research Services - Bus Priorities Research 3.10
Table 3.15 Getting a seat on the bus by bus users
Number Percentage Always 123 46 Usually 80 30 Sometimes 30 11 Rarely 19 7 Never 17 6 Total 269 100
Although relatively few bus users report problems of getting a seat or being refused entry, the focus groups suggest these issues are a major concern to those who experience them: this should be explored further.
Interchanging
3.4.7 All respondents were asked if they usually have to interchange to make their journey, with all 547 respondents answering the question. Almost a quarter (21%, n=117) stated that they do usually have to interchange to make their journey, while 77% (n=423) stated that they do not, and a further seven respondents stated that they could not remember.
3.4.8 All respondents (bus users and potential bus users) were asked what they think are the key facilities necessary at an interchange point. Of the 544 respondents who provided a response, over half (51% of cases) cited enclosed/secure waiting area as the key facility they believe is necessary at an interchange point. This was closely followed by seating which was cited by just under half (43% of cases) of respondents. Other responses included those who said toilets, those who said no facilities were needed, and those who stated that they did not know.
Potential bus users who know they would need to interchange may be deterred for this reason, though a high proportion of potential users may have little idea of whether interchanging would apply to their journey, and what the experience would be. We need to understand what potential users assume and expect about interchanging, and how any misplaced concerns (eg about personal security or waiting times) could be addressed and eased.
3 Phase 2 – Quantitative Research
Nexus - Market Research Services - Bus Priorities Research 3.11
Table 3.16 Key Facilities at an Interchange Point
Number of Responses % of Cases
Clock 50 9
Seating 231 43
Enclosed/secure waiting areas 277 51
Real Time Information Signs 69 13
Integration of bus timetable 118 22
Staff 72 13
Refreshments 53 10
Directions/signs 43 8
Other 75 14
Total 998 183
Note: Totals do not equal 100% due to multiple responses
Satisfaction with Bus Services
3.4.9 Bus users were asked were asked, on a scale of 1 to 5 where 1 is ‘Very Dissatisfied’ and 5 is Very Satisfied’, to rate their satisfaction with each of the following aspects of bus services in their area. Table 3.17 shows that over 30% of respondents were very satisfied with safety/security at bus stops, value for money, availability of seats, ease of getting onboard at peak times, and space for prams/wheelchairs, while over 45% of respondents were very satisfied with safety/security on bus.
3.4.10 Dissatisfaction centred on frequency, reliability and punctuality. Value for money was identified as a source of both satisfaction and dissatisfaction.
Consistent with phase 1, value for money is a key issue, on which bus user opinion seems divided. We need to understand what factors make some users feel very satisfied while others feel the opposite. The question of what factors, and which types of user, should be explored further.
3 Phase 2 – Quantitative Research
Nexus - Market Research Services - Bus Priorities Research 3.12
Table 3.17 Satisfaction with bus services by bus users
%
Very
Dis-satisfied satisfied
Dis-Neither Satisfied nor Dis-satisfied Satisfied Very Satisfied DK N Waiting environment at bus stops 2 7 10 51 30 - 269 Safety/security at bus stops 2 5 10 47 36 - 269 Accuracy of bus timetables 6 9 15 42 28 - 269 Frequency 5 14 11 44 26 - 269 Reliability 6 15 12 42 25 - 269 Punctuality 5 14 14 43 24 - 269
Value for money 7 14 13 30 35 1 269
Ease of getting onboard at peak times 3 4 9 48 33 3 269 Availability of seats 2 5 4 51 38 - 269 Space for prams/wheelchairs 4 9 5 46 34 2 269 Safety/security on bus 2 2 5 45 46 - 269
In view of these findings satisfaction with specific issues was explored in the respective Local Authority Areas, as part of the final phase of research
3.4.11 All respondents were asked what, if anything, would prevent them from travelling by bus more often. All respondents answered this question (n=547), with respondents stating in 55% of cases (n=299) that nothing would prevent them from travelling by bus more often. In 16% of cases (n=89), respondents stated that factors that prevent them from travelling by bus more often are that buses are too expensive, while in 10% of cases (n=52), respondents states that it takes too long to get places by bus. This can be seen in Table 3.18.
3.4.12 Other responses included drivers attitude, metro easier/more convenient, that buses are not convenient, and that respondents have to walk to get to bus stop/bus stop.
3 Phase 2 – Quantitative Research
Nexus - Market Research Services - Bus Priorities Research 3.13
Table 3.18 Factors preventing travel by bus more often
Number of Responses % of Cases
I don't feel safe waiting for the bus 13 2
I don't feel safe travelling on the bus 9 2
Lack of knowledge/information regarding services
8 2
Don't like waiting a long time for a bus 34 6
Buses don't turn up when they're meant to 38 7
Buses are too expensive 89 16
Buses do not run early enough in the morning
4 1
Buses do not run late enough at night 14 3
Don't like standing on the bus/too crowded 18 3
There is no space for my pram/wheelchair 14 3
I have to take more than one bus to get to my destination
35 6
Buses don't run where I need to go 33 6
Drivers ask for correct change/can't use a bank note
2 <1
It takes too long to get places by bus 52 10
Other 24 4
Nothing 299 55
Total 686 125
Note: Totals do not equal 100% due to multiple responses
3.4.13 Considering factors preventing bus travel more often by whether the respondent was a bus user or a potential bus user, 71% (n=192) of bus users said nothing prevents them from travelling by bus more often, while 23% (n=64) of potential users said that buses are too expensive, 17% (n=48) of potential users said that buses take to long, and 39% (n=107) of potential users said that nothing prevents them from travelling by bus more often.
3 Phase 2 – Quantitative Research
Nexus - Market Research Services - Bus Priorities Research 3.14 0 10 20 30 40 50 60 70 80
Bus user Potential bus user
%
I don't feel safe waiting for the bus I don't feel safe travelling on the bus Lack of knowledge/information regarding services Don't like waiting a long time for a bus Buses don't turn up when they're meant to Buses are too expensive
Buses do not run early enough in the morning Buses do not run late enough at night Don't like standing on the bus/too crowded There is no space for my pram/wheelchair I have to take more than one bus to get to my destination Buses don't run where I need to go Drivers ask for correct change/can't use a bank note It takes too long to get places by bus
Other Nothing
Figure 3.3 Factors preventing bus travel Improvements to Bus Services
3.4.14 Again, all respondents were asked to think what would encourage them to travel by bus more often, and which aspects of the bus network in the North East they feel are the most important to improve. Table 3.19 details all 547 respondent’s answers. In 56% of cases (n=307), respondents stated that no improvements would encourage travel by bus more often. In 19% of cases (n=103), respondents stated that buses which are better value for money would encourage travel by bus more often, with respondents stating punctuality/reliability/bus on time in 11% of cases (n=61) and improved frequency of bus service in 10% of cases (n=57) would encourage travel by bus more often.