The Value relevance of Intangible Assets
within the Software and Programming
industry
Master Thesis
The Value relevance of Intangible Assets
within the Software and Programming
industry
Master Thesis
G.M.Voigt St.nr. 0030406
Study Year 2005-2006
Externe Verslaggeving 2 Mastervak
Accountancy and control (MSc)
Hodgson, A.C.
Business Studies
Abstract
The objective of this study is to investigate the value relevance of capitalised research and development (R&D) on the balance sheet and the extent to which different variables influence the level of value relevance. In total a 123 observations from The Netherlands and England were analysed by using a modification of the Callimaci and Landry model (2004). This study not only investigates whether R&D expenditures are value relevant but also considers the different factors of influence on the value
relevance and the accounting variables that are used to measure the value relevance of R&D. The results provide evidence that different variables such as the ratio of R&D, company profits or losses, and country in which a company is located influence the value relevance of capitalised R&D.
Keywords: Value relevance, research and development, capitalisation, expensing, software and programming industry
I would like to thank prof. dr. A.C. Hodgson from the University of Amsterdam (UVA) for supervision and the Financial Services department at KPMG for allowing me to write my thesis during an
internship and for giving me access to the required financial data. In particular I would like to thank my coach at KPMG, Laurens Kreuze for comments on earlier drafts of this paper and his infinite support.
Table of Contents
CHAPTER 1: INTRODUCTION 1
CHAPTER 2: LITERATURE REVIEW 4
2.1 PRIOR RESEARCH ON INTANGIBLE ASSETS 4
2.2 PRIOR RESEARCH ON THE VALUE RELEVANCE OF VALUE RELEVANCE RESE ARCH 5
2.3 PRIOR RESEARCH ON R&D 7
2.4 PRIOR RESEARCH OF R&D IN THE SOFTWARE INDUSTRY 8
CHAPTER 3: CONCEPTUAL DESIGN 10
3.1 DEFINITIONS AND THE FACTORS OF INFLUENCE 10
3.1.1 INTANGIBLE ASSETS 10
3.1.2 THE DEFINITION OF RESEARCH AND DEVELOPMENT 12
3.1.3 THE NEED FOR ACCOUNTI NG STANDARDS 13
3.1.4 THE DIFFERENT REPORTI NG STANDARDS 14
3.1.5 THE SOFTWARE AND PROG RAMMING INDUSTRY 17
3.2 DEFINITION OF VARIABLES 20
3.3 THE CONCEPTUAL DESIGN FOR R&D 20
CHAPTER 4: RESEARCH QUESTIONS 23
4.1 DEFINITION OF THE RESEARCH QUESTION 23
4.2 IS RESEARCH AND DEVELOPMENT VALUE RELEVANT TO INVESTORS ACCORDING TO PRIOR RESEARCH? 24
4.3 CAPITALISATION OR EXP ENSING? 26
CHAPTER 5: HYPOTHESIS AND RESEA RCH METHOD 29
5.1 VARIABLES SELECTED IN THE MODEL 30
5.2 THE DEVELOPMENT OF TH E MODEL 30
CHAPTER 6: RESULTS 34
6.1 DATA SELECTION 34
6.2 R&D RATIO 35
6.3 PROFITS AND LOSSES 36
6.4 DIFFERENCE AMONG COUNTRIES 38
CHAPTER 7: CONCLUSION 43
Directory of Figures and Tables
FIGURE 3.1.5: WORLDWIDE PACKAGED SOFTWARE REVENUE, 2000-2006. 19
FIGURE 3.3: CONCEPTUAL MODEL 21
FIGURE 4.3:LEV, EXPENSE OR CAPITALISE 28
TABLE 6.1: LEVEL OF R&D 35
TABEL 6.2: PROFITS OR LOSSES 37
Chapter 1:
Introduction
In the past, discussions have arisen about what an intangible asset is and how it should be used for accounting purposes. Due to the lack of tangibility and the lack of
information on these intangible assets it is very hard to identify and measure these assets. In response, countries have set up criteria as to when non-physical assets as, patents, franchises, servicing rights and research and development (R&D) can be identified as an intangible asset, when it can be accounted for, and how it should be disclosed. However, because regulators and researchers have limited information on these assets and differ on how to value them, this has resulted in different regulatio ns among countries. One intangible asset that has specifically been under discussion and standard setting is R&D. The aim of this study is to conduct research on the value relevance of R&D focussing on the R&D assets of Dutch and English firms and confining the analysis to the software and programming industry
Prior research in the United States indicates that about 80-90% of R&D expenditure has future benefits and that the cumulative R&D asset accounts for more that 40% of the difference between market and book value of equity (Ballester,
Garcia-Ayuso and Livnat, 2003). Because both tangible and intangible assets generate future cash flows a rational stock market should, by definition, recognise the value of intangibles as it recognises its tangible assets such as property, plant and equipment (PPE) (Zhang, 2004).
Under the International Financial Reporting Standards (IFRS) R&D should generally be recognised as an expense and only allows recognition if it meets several requirements (see chapter 4). Under the US Generally Accepted Accounting
Principles (US GAAP) framework they are treated differently. All costs made for R&D should be expensed making an exception for software development that is allowed to be capitalised according to technological feasibility. For accounting purposes international comparisons could be simplified by setting the same standards and further research should provide information as to which standards will eventually give a ‘fair view’ on financial figures.
Value relevant research can provide further insight in accounting amounts for different groups of interest. Managers and other financial stakeholders can obtain
equity value. Value relevance research can also provide information for standard setters. Half of the Financial Accounting Standards Board (FASB) studies used in their research and standard setting refer to value relevance research (Barth, Beaver and Landsman, 2000; 2001). The FASB refers to value relevance in SFAC No.5 which states that an accounting amount is value relevant if it is capable of making a difference to financial statements users’ decisions.
A number of academics have performed tests of value on accounting amounts to measure the extent of their value relevance in security market values (Harris and Venuti, 1993; Aboody and Lev, 1998; Ohlson, 1999; Healy, Myers and Howe, 1999). In recent years an arm of this research has examined the value relevance of intangible assets. A common conclusion is that an intangible asset is value relevant whether or not it has been capitalised or expensed and reported in financial statements.
Researchers have often used the value relevance of intangible assets as an argument for capitalisation (Lev and Sougiannis 1996, Aboody and Lev, 1998; Chan,
Lakonishok and Sougiannis, 2001; Zhao, 2002; Lev, 2003). Other papers support assertions made about recognised intangible assets being valued by the market but do not evaluate the capitalisation versus expensing debate (Barth and Clinch, 1998). Hence users of financial statements and standard setters have used the findings of value relevant research to gain insight in financial figures.
The research in this thesis is also important because of the level of R&D expenditure. Over the past two decades the domestic expenditure in the Netherlands on R&D has established itself at around the 2% of gross domestic product (GDP) (1981; 1.79%, 1991; 1.97%, 2001; 1.89%) (Eurostat, OECD). The investment in R&D within the information-, communication- and technology-sectors (ICT) accounts for almost 36% of total R&D expense in the Netherlands. This brings the R&D investment for the ICT sector in the Netherlands, with 3.5% (as percentage of GDP), above the EU-average of 2.9% (Ministerie van Economische Zaken, 2005). The English figures show a similar trend. The English software and computer services sector generated sales of US 39.7 billion in 2002 accounting for 3% of the national GDP (UK Trade & Investment, 2004).
One of the ma in industries within the ICT sector in both countries is the software and programming industry. The substantial share of R&D investment within the software and programming industry raises the question whether their stock
This thesis examines the value relevance of capitalised R&D in the software and programming industry and provides additional insights on how investors value these assets. However a caveat is that a value relevance study on its own is not enough to base standard setting upon. Value relevance research as a whole can provide supplementary information in the answering of questions arising in standard setting (Holthausen and Watts, 2001). Chapter 2 will review the diverse literature available on the relevance research.
A caveat is that not all factors that are relevant in standard setting are taken into account when designing value relevance research. Therefore value relevance studies do not predict or stipulate standard setting but it creates a mapping of several factors influencing accounting numbers and share prices that can be used in the decision making process (Barth, Beaver and Landsman, 2001). On the basis of the literature review, I designed a conceptual model to include all factors of influence and variables, from which additional research can be set up described in Chapter 3.
The development of this conceptual model raises a number of questions of importance in understanding the valuation of R&D which are addressed in Chapter 4. In chapters 5 and 6 an empirical research is conducted that reveals mixed results for the value relevance of R&D. These result show that each variable on its own or combined with other variables can have a significant effect on the value relevance of R&D. An overall conclusion is given in chapter 7.
Chapter 2:
Literature Review
Many economists have explored various aspects of value relevance and R&D in some detail. In this thesis research from previous literature has been combined and adapted to gain more insight on the factors that influence the value relevance of R&D and to develop new research questions. In later chapters these research questions will partially be worked out by using previous literature. Therefore only a brief summary of the research topics discussed in earlier literature will be given hereunder.
2.1 Prior research on intangible assets
Baruch Lev (2003) among others has performed extended research on intangible assets. In this article he states that the information provided about intangible assets is often partial, inconsistent and confusing thus leading to costs for companies, investors and society. Because of the magnitude of the investment in intangible assets, between one-half and two-thirds of corporate market values, it is necessary for investors to be provided with; insight information, on-balance-sheet accounting and additional financial disclosures. He determines that accounting rules for intangible assets do not make much economic nor common sense as companies have not been consistent in the application of rules. Lev identified the following four consequences of
missmeasurement and deficit financial reporting of intangibles; 1) deterioration in the information content of key financial statement items; 2) systematic undervaluation of companies that are intensive in intangibles; 3) gains are misallocated to insiders; and 4) deterioration in the integrity of capital markets.
To resolve the current problem, both more recognition and more disclosure are required. Lev proposes a new comprehensive balance sheet that recognizes the
creation of those intangible assets to which you can attribute streams of benefits. Disclosures should be facilitated by creating a common language in accounting regulations allowing comparisons of intangibles. By involvement of users of financial statements and further research this objective can be accomplished.
2.2 Prior research on the value relevance of value relevance research The first study that used ‘value relevance’ dates from 1966 and was conducted by Miller and Modigliani (1966). They used the term value relevance as the association between accounting amounts and security market values. From that time on
researchers like Harris and Venuti, Aboody and Lev and many more have been performing tests of value on accounting amounts to measure the extent of their value relevance in security market values (as examples see Harris and Venuti, 1993; Aboody and Lev, 1998; Ohlson, 1999; Healy, Myers and Howe, 1999).
In 2000 Barth, Beaver and Landsman addressed the importance of value rele vance research to clarify the motivation, contribution, limitations and relevance around this issue. Their intention was to clarify several misconceptions such as; 1) value relevance studies are designed to assess how well particular accounting amounts reflect information that is used by investors in valuing the firm’s equity value and not designed to asses the usefulness of accounting numbers; 2) value relevance research provides significant insights into questions of interest to standard setters and other nonacademic constituents; and 3) value relevance research can accommodate conservatism, a characteristic of accounting practice that might be construed as inconsistent with the FASB’s stated criteria. Barth, Beaver and Landsman (2000) further state that a primary focus of the FASB and other world standard setters is equity investment, although financial statements have a variety of applications beyond equity investment. Empirical implementations of valuation models can be used to address questions of value relevance, despite the simplifying assumptions underlying the valuation models. The extent and pervasiveness of the value relevance literature in the leading academic accounting journals, as well as the adaptations of several of the studies in professiona l publications, including those of the FASB, are testimony to its impact on academic research and accounting practice (Barth, Beaver and Landsman, 2001).
Barth, Beaver and Landsman argue that value relevance studies can provide insight into relevance and reliability of financial statement amounts and reliability if it represents what it purports to represent. They have identified four approaches to provide evidence on reliability when applying valuation models such as the Ohlson (1995) model. First, to make specific predictions on how reliability affects coefficient
being studied with a theoretical benchmark coefficient; thirdly, compare the estimated valuation coefficient on the accounting amount being studied to that on other amounts already recognized in financial statements an finally interpret significant coefficient of the predicted sign on the accounting amount being studied as evidence of reliability (Barth, Beaver and Landsman, 2001).
In 2001 Barth, Beaver and Landsman expressed another view about the value relevance literature for financial accounting standard setting. They explain that value relevance research assesses how well accounting amounts reflect information used by equity investors, and provides insights into questions of interest to standard setters. A contrary view is given on the conclusion made by Holthausen and Watts (2001), stating that value relevance research offers little or no insight for standard setting. Barth, Beaver and Landsman come to the following conclusions in their paper; 1) value relevance research provides insights into questions of interest to standard setters and to other non-academic constituents; 2) primary focus of FSAB and other standard setters is equity investment; 3) empirical implementations of extant valuation models can be used to address questions of value relevance despite the simplified assumptions underlying the models; 4) value relevance research can accommodate conservatis m, and can be used to study the implications of conservation for the relation between accounting amount s and equity values; 5) econometric techniques can be and are applied to mitigate the effects of common econometric issues arising in value
relevance studies that otherwise could limit the validity of inferences drawn from such studies; and 6) drawing policy from implications from academic research is typically not possible because the studies generally do not incorporate all of the factors the FASB must consider.
According to Bart, Beaver and Landsman (2001) the primary purpose for academic researchers that conduct tests of value relevance is to extend our knowledge regarding the relevance and reliability of accounting information as reflected in equity values. Researchers only need to operationalise the FSAB criteria and not determine them. The key conclusion then is that the value relevance literature provides fruitful insights for standard setting. In the following chapters the derived hypotheses from prior research are used to assess value relevance from the point of view of an investor and, by so doing, also addresses questions of interest to accounting standard setters.
2.3 Prior research on R&D
Prior researchers like Abrahams and Sidhu (1998) and Callimaci and Landry (2004) have applied their value relevance methodology to intangible assets such as R&D. In their studies they use empirical models to establish the value relevance of capitalized R&D on the balance sheet. Both studies conclude there is a positive relationship between the amount capitalized and the market value. Sidhu used data from industries where R&D was widespread and analyzed it further for capitalising and
non-capitalising companies. His results suggest that capitalised R&D from ‘capitalisers’ has a significant association with firm value.
Other researchers like Zhao and (2002) Ballester, Garcia-Ayuso and Livnat (2003) have undertaken empirical research on R&D using modifications of the Ohlson model. In their studies they made a selection of different variables to be compared. Zhao analysed the reporting environment in different countries and found that the reporting of total R&D costs increases the association of equity price with accounting earnings and book value in countries with a complete R&D expensing standard, and that the allocation of R&D costs between capitalisation and expense provides incremental information content over that of total R&D costs in countries permitting conditional capitalisation of R&D costs. Zhao concludes that the value relevance of the R&D reporting in each country is influenced by the joint effect of R&D accounting standards and the reporting environment.
In their research, Ballester, Garcia-Ayuso and Livnat (2003) used estimates about the capitalization parameter, the persistence of earnings, and the profitability of the company to predict the economic value of R&D. They compared the predicted R&D to the subsequent stock returns and market to book value to find that the ratio of the R&D asset to market va lue of equity is negatively correlated with size,
profitability, growth rate in R&D, and sales. Not only do their results support the debate about investors considering most of the R&D expenditures to be an economic asset but they also document the existence of significant differences between the firm specific, time-series, estimates of the economic value of the R&D asset and the cross-sectional, industry-wide, estimates generally used in the literature. Their time-series approach generated estimates of the economic value of the R&D asset that show
of the latter two research papers have been integrated in the conceptual model of this research.
2.4 Prior research of R&D in the software industry
Aboody and Lev (1998) have specified their research by examining the value relevance of capitalisation of software development costs. They examined value relevance by associating stock returns with contemporaneous financial data, associating prices with financial data and examining the predictive ability of
capitalised data with respect to subsequent earnings. Before applying their empirical models they distinguish between ‘capitalisers’ and ‘expensers’ by analyzing the following variables; 1) firm size - large firms are expected to expense a larger share of development costs than small firms; 2) software development intensity - a positive relation is expected between the development intensity and the capitalisation rate; 3) profitability - it is believed that profitable companies avoid capitalisation in order not to taint the perceived quality of their earnings in analysts’ eyes; 4) leverage - firms closer to loan restrictions may favor capitalisation which increases equity earning; and 5) systematic risk or ß - riskier firms that devote larger share of development efforts to basic research, expected to expense more than less risky companies. Aboody and Lev (1998) conclude that software capitalisation summarizes relevant information to investors and found evidence that the appeal of software capitalisation in terms of enhancing reporting earnings continually diminished.
In prior literature there have been different approaches to the determination of the value relevance of R&D, but a common conclusion is that R&D is value relevant. When looking at prior research most studies only analyse the value relevance within a few upfront selected factors of influence of which the impact is not always taken into account. The factors of influence can be identified in these previous studies are for instance the location or the specific industry in which a firm operates. These factors of influence are not directly measurable in an accounting amount but do have an
influence on the value relevance of R&D.
Another issue is that previous literature studies the value relevance of R&D as a whole but does not actually measure the impact of the different accounting variables on the value relevance of R&D. The following chapter analyses the different factors
of influence and the accounting variables and portrays their correlation to the value relevance of R&D by the design of a conceptual model.
Chapter 3:
Conceptual Design
To examine the value relevance of R&D this thesis starts out with the design of a conceptual model. A conceptual model is a written description and a visual
representation of the relationship between the variables and factors of influence on the subject. A conceptual model establishes the relation between different elements from the top downwards. Conceptual- level concepts of these elements permit us to model the application-world independently and allow us to develop a quantitative model for empirical research. To design a conceptual model the different factors of influence and the accounting variables need to be identified and examined as to how they theoretically stand in relation to the value relevance of R&D. The following paragraphs will describe the factors of influence and the variables that have come forward in previous studies and their influence on the value relevance of R&D.
3.1 Definitions and the factors of influence
There are significant differences between countries in the identification and
accounting treatment of an intangible asset. These differences limit the comparison of research between countries and industries for stakeholders. Likewise researchers are forced to select between the different factors of influence upfront to gain consistency in their data but limiting capability of making relevant comparisons. As mentioned before these factors of influence are not directly visible on the balance sheet but do have an influence as to how R&D is valued.
In several of these factors I have made a further selection as this study is focussed on the R&D within the software and programming industry in the
Netherlands and England. The definition of R&D and the rules and regulations that are applicable to R&D will be described separately. The remaining factors will be worked out along with the description of the software and programming industry. 3.1.1 Intangible assets
Defining an intangible investment is an important first step in the valuation and reporting of these assets. Most accounting frameworks include non-physical sources and expected future benefit in their description of an intangible asset. In the following
paragraphs I will give a detailed description given by the International Financial Reporting Standards and the US Generally Accepted Accounting Principles frameworks (herein referred to as IFRS and US GAAP).
The IFRS defines an intangible asset under IAS 38 (1998). The intention of IAS 38 is to prescribe the accounting treatment for intangible assets that are not dealt with specifically under another IAS. IAS 38 defines when a company is allowed to recognize an intangible asset, how to measure the carrying amount of an intangible asset and the requirements about the disclosure regarding an intangible asset. IAS 38 states:
An intangible asset is an identifiable non-monetary asset without physical substance held for use in the production or supply of goods or services, for rental to others, or for administrative purposes. An asset is a resource:
a) controlled by an enterprise as a result of past events;
b) from which future economic benefits are expected to flow to the enterprise. IAS 38.12 states that an intangible asset is identifiable when ‘the asset is separable, either individually or together with a related contract, asset or liability, or if the asset arises from contractual or other legal rights, regardless of whether those rights are transferable or separable from the entity or from other rights and
obligations’.
IAS 38.21 requires an enterprise to recognize an intangible asset (at cost) if, and only if:
a) it is probable that the future economic benefits that are attributable to the asset will flow to the enterprise; and
b) the cost of the asset can be measured reliably.
The recognition criteria of IAS 38.21 is required whether an intangible asset is acquired externally or generated internally. IAS 38 includes additional recognition criteria for internally generated intangible assets which will be discussed in chapter 3.3 together with further reporting standards for intangible assets.
US GAAP defines intangible assets by the Financial Accounting Standards Board (FASB) as:
“Probable future economic benefits obtained or controlled by a particular entity as a result of past transactions or events”
“Assets (not including financial assets) that lack physical substance”
(A further explanation of the accounting treatment of an intangible asset under US GAAP will be given in chapter 3.3)
According to Lev (2001, p.7) an intangible assets can be understood as “non-physical sources of value generated by innovation, unique organizational designs or human resource practices. Intangibles often interact with tangible and financial assets to create corporate value and economic growth”.
Examples of intangible assets include R&D, computer software, brands, patent rights, customer lists and copyrights. An intangible asset can also represent the
difference between the value of the asset and the value the stock market assigns to it, for instance goodwill. These assets have economic reality even though they cannot be touched (FAS142, Par. F1).
3.1.2 The definition of research and development
Companies invest in R&D to generate future benefits and rewards. For companies to sustain a competitive position on the market they invest in R&D to strengthen or generate advantages and returns. The increasing amount of investments in R&D has raised the discussion about the influence of R&D on the firm value. Therefore this research focuses upon the R&D asset within a company.
Research can be defined as the systematic study directed toward fuller scie ntific knowledge or understanding of the subject studied with the objective to develop a new product, service, process, technique or improvement to an existing product, to obtain new knowledge or to search for alternatives.
Development is the systematic use of knowledge and findings gained from the research performed and used to plan or design new products, processes or services to improve these for either sale or use. Development focuses on the use of materials, devices or systems for the creation of for example prototypes and processes. (FAS2, Par. 8)
Companies within the software and programming industry tend to have a relative large share of intangible assets. It is hard to define their intangible R&D assets as prospects are highly unpredictable and the benefits materialise at a later period in time. Products and services resulting from R&D often have a short life cycle due to the rapid changes in technology and the high levels of competition (Chan et al., 2001).
3.1.3 The need for accounting standards
The accounting standards used to evaluate R&D is a second factor of influence on the value relevance of R&D. Countries use different regulations which are not always clear-cut resulting in a certain freedom of interpretation for preparers of financial statements. Further, information provided about intangible assets is often incomplete which can create unnecessary search costs for investors and companies. On the other hand costs made to gather absolute information to allocate and account for R&D need to be outweighed by the benefits.
According to the FASB costs made for software development are capitalised when one can speak of technological feasibility but costs made to build a brand name are expensed immediately. Subsequently costs that are made to purchase in-process R&D are expensed and costs to buy a brand name are capitalised. The inconsistency in these accounting rules creates confusing information about financial figures for stakeholders.
For markets to work efficiently it is necessary to endorse transparency and to limit differences in financial reporting. Limiting information asymmetry could diminish mismeasurement and misreporting in financial statements (Lev, 2003).
There have been differences in financial reporting due to the lack of a universal definition of R&D. Factors adding to information asymmetry between investors and managers which can be limited by strict reporting regulations are; 1) R&D projects are generally unique to a company making it difficult to compare data with other companies. Additional reporting on R&D could give more insight on the progress made within a company; 2) management incentives to influence R&D expenditure when bonuses are linked to earnings can differ from investors incentives, this could for instance be made more difficult by the capitalisation and amortisation of
there are no asset prices from which information can be derived; and 4) the different treatment of accounting measures and reporting rules among countries (Aboody and Lev, 2000).
3.1.4 The different reporting standards
3.1.4.1 IFRS
The International accounting Standards Board (IASB) sets the International Financial Accounting Standards (IFRS) (previously called International Accounting Standards (IAS)). The EU- members have decided to apply most of the IFRS as of January 2005.
IFRS accounts for internally generated intangible assets during the research and development phase as prescribed by IAS 38 which remains the same as before the implementation of IFRS for the Netherlands. Prior to the implementation of IFRS in the United Kingdom research and development was accounted for under the
Statement of standard accounting practice No.13 (SSAP) described in the chapter 3.1.4.2.
IAS 38 states that no intangible assets resulting from research should be recognised. Costs should be recognised as expense when incurred. An intangible asset resulting from development should be recognised only if the company can meet up with the following six requirements:
1) the technical feasibility of completing the intangible asset for use or sale; 2) have the intention to complete the intangible asset for usage or selling; 3) have the ability to use or sell the intangible asset;
4) show how the intangible asset will generate future economic benefits; i. demonstrate the existence of a market
ii. if for internal use demonstrate usefulness
5) have the availability of adequate technical, financial and other resources to complete and use or sell the intangible asset;
6) the ability to measure the expenditure attributable to the intangible asset during its development reliably.
After having recognised an intangible asset it should be amortised on a systematic basis over the best estimate of its useful life, usually not exceeding twenty
years. The company should begin amortisation as soon as the asset is available for use. IFRS has no specific regulations on R&D expenditure for software.
As of the 31’st of March 2004 the amendments of IFRS 3 for business combinations will be applied on the annual reports. IFRS 3 suggests that purchased process R&D should be recognised as an asset and that the purchase price of the in-process R&D should be set according to the market price. If there is no organised market, which is often the case for R&D, the purchase price should be set according to the fair- value of the asset. Further expenditures should be accounted for as stated in IAS 38.
Under former Australian Generally Accepted Accounting Standards
companies could choose to carry their intangibles at fair value without restrictions. This changed as of 2005 when Australia implemented IFRS. Now Australian companies can value their intangible asset at fair value only if the value can be determined by reference to an active market which is, as stated before, rarely the case for intangible assets. Australia has however proposed amendment of IAS 38 which was rejected by the IASB (PWC, Headlines, 2004). Although the fair values of intangible assets are not yet the focus of the FASB, propositions like these have opened up the discussion about fair values in the past and for the future. The FASB effected fair value accounting for financial instruments in 2001 and is still actively considered fair-value accounting for some intangible assets (Barth, Beaver and Landsman, 2000). One reason to conduct value relevance studies is obtain information that could be used in these discussions.
3.1.4.2 UK GAAP
Under SSAP No.13 R&D expenditure on pure and applied research should be written off in the year of expenditure through the profit and loss account. Development expenditure is treated alike IAS 38 and capitalised when there are reasonable
expectations of commercial success and of future benefits. Development expenditure can be deferred to be matched against future revenue, to the extent that it is
recoverably, only if:
1) There is a clearly defined project;
1) technical feasibility;
2) commercial viability evaluated by factors as: i. likely market conditions; ii. public opinion;
iii. consumer and environmental legislation.
UK GAAP does not specify its accounting regulations for software development costs (SSAP No.13).
3.1.4.3 US GAAP
Unlike IFRS, US GAAP separates accounting for software R&D and other intangible assets. SFAS No. 2 (FSAB, 1974) states that costs from R&D should be expensed immediately with the sole exception of software development costs. Since December 1985 software and development costs can be capitalised according to technical feasibility under SFAS No. 86, in current text Section Co2.
SFAS No.86 specifies that all costs incurred to establish technological feasibility of computer software to be sold, leased, or otherwise marketed as a separate product or as part of a product or process, shall be charged to expense when incurred.
Technological feasibility of computer software will only be established when “the company has completed all planning, designing, coding, and testing activities that are necessary to establish that the product can be produced to meet its design specifications.”
At a minimum a company will have to have performed the activities under a) or b) to prove that technological feasibility has been established:
1) The process needs to include a detailed program design that includes:
i. The product and program design need to have been completed. The necessary skills, hardware, and software technology need to be available.
ii. The completeness of the detail program design and its consistency with the product design needs to be confirmed
iii. High-risk development issues have been reviewed, coded and tested
i. A finished working model and product design
ii. The completeness of the working model and its consistency with the product design has been confirmed and tested
After realizing technological feasibility all software production costs shall be capitalised and subsequently reported at the lower of un-amortised cost or net realisable value. Capitalised costs will be amortised based on current and future revenue for each product with an annual minimum equal to the straight- line amortisation over the economic estimated life of the product.
Costs incurred by a company in developing computer software for internal use in its research and development activities have to be expensed when incurred (FIN6, 8).
3.1.5 The software and programming industry
Since the establishment of first information, communication and technology (ICT) firms in the Netherlands in the1950s the industry has developed itself increasingly. The ICT industry experienced a booming growth due to the introduction of the personal computer and the increasing use of internet. Since 2001 however the industries sales volume growth underwent a slight drop to 3.5% and recovered in 2003 with a growth above the 5% (Dijk, van et al., 2002). The R&D intensity within the ICT-sector in the Netherlands is extremely high considering that the ICT-sectors consists of only 5% of the Dutch economy and account for more than one third of the R&D expense (Minne and van der Wiel, 2004).
In this thesis I have limited my scope to the R&D within the software and programming firms. Hereunder I will give a brief observation of the main topics regarding this industry and the R&D within this industry.
Within the industry the software and programming firms have created several technological breakthroughs through investing in research and development (R&D). In recent years companies have made tremendous progress using applications
provided by the software vendors. Companies have been able to use software to create complex communication, transportation and information networks or to establish themselves on the Internet. Especially the Internet has created extra services for companies such as online-retailing, shopping and client assistance. As a result of the
using internet at the beginning of 2003 (Centraal Bureau voor de statestiek (CBS)). With the help of sophisticated software companies have also been able to outsource certain business processes like; internet payments can be taken over by credit card companies, inventories can be restocked by EDI-systems using a JIT principle or even completely bypassed by placing orders directly with the suppliers.
Although there are big foreign multinationals such as Microsoft (US), IBM (US) and Oracle (US), the domestic software industry has established a strong
presence on the market. The in the Netherlands based Getronics obtained global sales of EUR2.6 billion (2003) and is a world competitor within the ICT industry. Exact Holdings (NL), a company focused on the production of software for accounting, human resource management, customer relationship management and e-business, booked revenue of EUR 206.4 million in 2003 of which EUR 92,6 million in the Netherlands and Anglo-Dutch Logica CMG, a computer services company, booked revenue of £1,658.4 million in 2004. Other Dutch companies include Unit 4 Agresso (EUR 12.8 million), which focuses on business software, internet and security, and Blue Fox enterprises (EUR 1.26 million), which produces software for the
international textile and clothing industry.
When looking solely at Dutch software, the market has shown a strong growth in 2005 of 6.2% to reach a value of US 5 billion. The Netherlands accounts for 9.5% of the European software market’s value.
The English software market has experienced gradually increasing growth rates over the past five years. At the beginning of the decade low growth rates came as a response to September 11th 2001 but later the business embraced the demands of technology and the software market grew by 4.5% in 2005 to reach a value of US8.9 billion. In terms of value, England accounts for 16.8% of the European software market (Datamonitor, 2005).
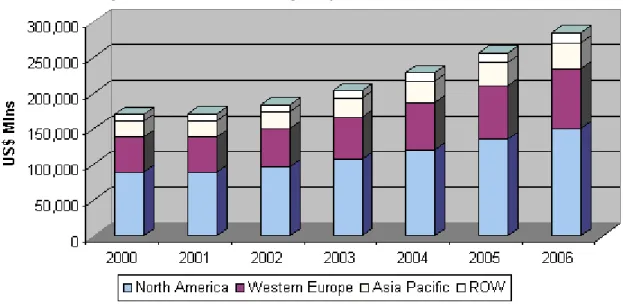
In the chart in figure 3.1.5 you can see the growing demand for software in different regions of the world and the expected growth for 2006. Customers of computer software include businesses, government agencies and households. The largest customers are the businesses, which account for 80% of the purchases. Software is defined as an interface between computer hardware and the data or actions provided. The function of computer software is to control and direct computer
hardware operations using programs, routines and binary representations of electronic readable codes or logic.
Figure 3.1.5: Worldwide Packaged Software Revenue, 2000-2006.
Copyright © 2003, The McGraw-Hill Companies, Inc., Standard & Poor's
Due to the rapid growth in the industry and the technological change it is important for companies to invest large amounts in R&D. In this specific industry it is the norm to invest approximately between 10% and 20% of revenues in R&D if a company wants to sustain a competitive position (Global Software Industry S&P report, August, 2003).
The balance sheet of software companies generally shows few tangible assets and little debt (Chan et al., 2000). Key items on the balance sheet of R&D intensive firms are accounts receivable, inventories and capitalised R&D. Depending on the accounting methods applied a company has to expense R&D costs as incurred or it can capitalise R&D costs and amortise over a certain period of time. Capitalised R&D on the balance sheet suggests future benefits of which costs will be amortised in the associated periods reducing earnings in comparison to when the same earnings would be expensed immediately. In other words, when R&D costs are capitalised, less expenses will be recorded on the income statement, resulting in higher reported earnings for that period of time. Eventually the costs will be incurred in future periods when capitalised assets are amortised and associated expenses are recorded. This in turn will result in relatively lower future earnings than when R&D had been expensed
In order for companies and investors to value R&D and measure its effectiveness they have to take financial and non-financial factors into account. Financial measurements like return or investment, market share, year to year growth of investment or percentage of revenue invested can be used to compare over different time periods or to different companies. Non-financial factors like; the markets in which a company invests, a progressive or declining market, or investments in new-product development or in improving existing new-products, could enhance or reduce the R&D value determined by companies and investors. In this paper we will research we will eventually evaluate how much va lue investors give to R&D.
3.2 Definition of variables
The variables are defined by the different accounting amounts that influence the value relevance of R&D. These amounts are retrieved from annual reports and can have a direct effect on the decision making of stakeholders. Most value relevance studies concerning R&D analyse value relevance as a whole and make a differentiation between capitalising and expensing companies. A few researchers like Aboody and Lev (1998) discuss other variables that could have an influence on the value relevance of R&D such as the level of R&D, the firm size and young or mature companies.
3.3 The conceptual design for R&D
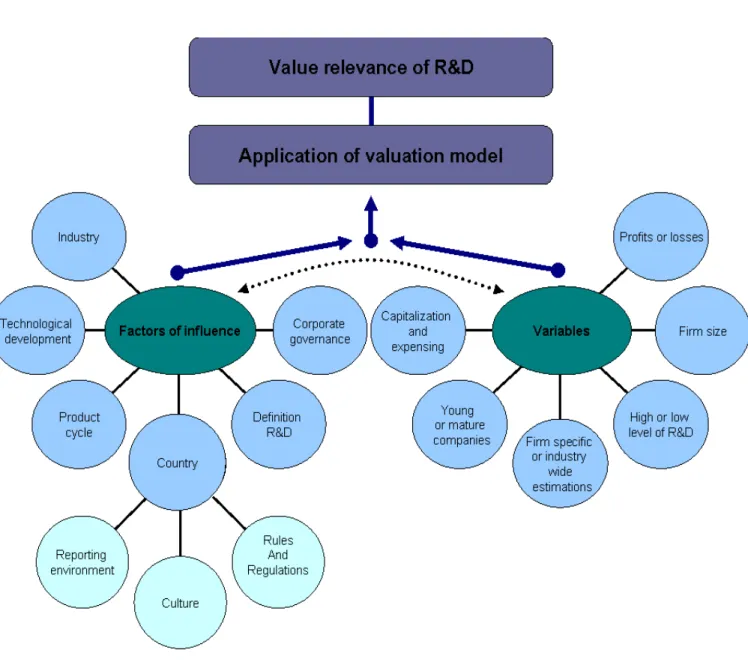
The conceptual model in figure 3.3 gives a representation of the factors of influence and the variables that need to be taken into account prior to the application of a valuation model. The conceptual model portrays all factors of influence and
accounting variables that have come foreward in prior research and their relation to the value relevance of R&D. The different factors of influence as shown hereunder are; the industry, technological development, product cycle, the definition of R&D, corporate governance, and within countries, the reporting environment, the culture and the rules and regulations. The different variables that can be used in a value relevance study are; firm age, firm size, firms that capitalise or expense, generate profits or losses or obtain a high or low level of R&D spending.
Figure 3.3: Conceptual Model
The blue arrows in the conceptual model portray the factors of influence and variables that need to be gathered and joined in a valuation model. The relation between the variables and the factors of influence is portrayed by the dotted double arrow line. When designing a research question as in the following chapters an upfront selection needs to be made between the factors of influence. It is essential to focus on a few aspects of the research subject as it is, for example, impossible to make a relevant comparison between R&D within a software firm in the Netherlands which reports under IFRS and R&D in a biotechnology firm in the United States which reports under US GAAP. Data becomes incomparable when this selection has not
according to the different variables to assign the potential influence on value relevance per variable. After the application of a valuation model with the use of different variables the outcomes can be compared to determine the value relevance of R&D. In the next chapters I will discuss certain variables out of the conceptual model that have been of interest to prior researchers. By understanding prior research
methods and opinions variables can be filtered that might have had an unrecognised effect on the value relevance of R&D.
Chapter 4:
Research questions
4.1 Definition of the research question
When looking at the factors of influence and the variables coming from the
conceptual model and previous literature there are two main topics being discussed in almost every research paper, the value relevance itself and whether R&D has greater value relevance if it is capitalised or expensed. Researchers have measured value relevance in different ways resulting in contradicting outcomes. Most researchers claim that if R&D is value relevant it should be capitalised and shown on the balance sheet. Some researchers and other stakeholders prefer more detailed information about R&D expensing in annual reporting over capitalisation. The opinion given by different stakeholders often depends on the different factors of influence and the variables used in their research. In this research I would like to find out which variables have an influence in value relevance studies and hence on the opinion forming of the se different stakeholders. I have formulated the following research questions to gain more insight on the most frequent discussed items concerning value relevant research:
RQ1) Is research and development value relevant?
RQ2) Should research and development be capitalised or expensed according to different stakeholders?
Research questions, RQ1 and RQ2, will be discussed together with the associated variables that can be used for the valuation of R&D in the following paragraphs. To establish the value relevance of R&D this paper contains a theoretical study that discusses the different factors of influence on the value relevance of R&D, and an empirical study using several variables and comparing them to determine the value relevance of R&D.
4.2 Is research and development value relevant to investors according to prior research?
Over time several researchers have studied the value relevance of R&D to gain insight on the information used by investors to value firms. I have used these studies to examine the value relevance of R&D and to design my own research approach for the software and programming industry. Most researchers have come to the conclusion that the capitalisation of R&D costs or the disclosure of R&D expense is both value relevant (Cha n, Martin and Kensinger, 1990; Hall, 1993; Zarowin, 1999). The models used in the valuation of R&D depend on data availability and personal preference. The most commonly employed model to ascertain whether the market believes R&D to be an asset is the Ohlson model (Zhao, 2002; Ballester, Garcia-Ayuso and Livnat, 2003). Hereunder I will give a short view of the different research approaches and their findings on the value relevance of R&D.
In 1998 Aboody and Lev conducted a study on the relevance of R&D software capitalisation. They used different future earnings and stock return models to come to their conclusion. They examined value relevance by analyzing data outcome from three tests; the association of stock returns with contemporaneous financial data, the association of prices with financial data, and by examining the predictive ability of capitalisation data with respect to subsequent earnings. The extent to which
information is contained in capitalised software is consistent with that used by investors can be derived from the association between unexpected capitalisation-related items and contemporaneous annual stock returns. The cumulative software assets presented on the balance sheet are compared to share prices to determine their value relevance (Aboody and Lev, 1998).
Aboody and Lev found no evidence that software capitalisation decreases the quality of reported earnings which they examined by regressing annual raw returns on the level and change of reported earnings, and alternatively on the leve l and change of adjusted earnings. They did find significant evidence for capitalisation on their three other tests; 1) the annually capitalised development costs proved to be positively associated with stock returns and prices, 2) the cumulative software assets reported on the balance sheet were associated with stock returns and prices and 3) software capitalisation data were associated with subsequent reported earnings. All three of these findings gave statistically significant results about the annual software
capitalisation amount and the cumulative software assets being positively associates with stock return and prices (Aboody and Lev, 1998).
Ballester, Garcia-Ayuso and Livnat (2003) conducted a study about the economic value of R&D using a modification of the Ohlson model. Two different approaches, the time-series and the cross-sectional series approach, are used to compare firm-specific estimates. They use estimates about several factors like the capitalisation parameter, the persistence of earnings and the profitability of the company to calculate the economic value of R&D. The market to book value and the subsequent stock return of the selected companies are then compared to the calculated R&D to come to the following results; 1) the ratio of the R&D asset to market value of equity is negatively correlated with; size, return on assets, R&D growth rate and sales, 2) their results from both estimation procedures suggest the market perceives a significant portion of first-year R&D expenditures to have future benefits in
subsequent years and 3) both estimation approach indicate the perceived importance of R&D asset to market valuation of the companies.
Ballester, Garcia-Ayuso and Livnat’s results support the debate that investors consider most of the R&D expenditure an economic asset. Additionally their study documented the existence of significant differences between the firm-specific and time-series estimates of the economic value of the R&D asset and the cross-sectional, industry-wide estimates. The value of the R&D asset estimated by the time-series approach shows stronger associations with the subsequent stock returns and the difference between the market and book value of equity.
Zhao (2002) performed a similar study using the Ohlson model examining the relative value relevance of R&D reporting in France, Germany, the UK and the USA. Consistent with the prior studies mentioned, Zhao found R&D reporting to be value relevant. The relative value relevance of R&D reporting under different reporting standards was compared using the clean surplus model while controlling for the reporting environments. He came to the conclusion that the value relevance of R&D reporting in different countries is influenced by the joint effect of R&D accounting standards and the reporting environment. His results suggest that; reporting of total R&D costs increases the association of equity price with accounting earnings and book value in countries with complete R&D expensing standards, and that the
information content over that of total R&D costs in countries permitting conditional capitalisation of R&D costs.
4.3 Capitalisation or expensing?
Research and development (R&D) has become an important activity for software and programming companies as it stimulates the productivity growth within companies nationally and internationally (Leeuwen and van der Wiel, 2003). Hence, if the amount of R&D expensed or capitalised predicts future earnings and produc tivity growth it means that it is a significant item of information for investor’s decision making.
However, in March 1996 the Software Publishing Association (SPA) wrote a letter to the Financial Accounting Standards Board (FASB) asking them to reconsider statement No.86. The FASB statement No.86 requires software development costs to be capitalised after technological feasibility has been reached. The SPA states that software companies can hardly meet up to the criteria of statement No.86 due to the increasing development of technology and the shortened product cycle. In their opinion capitalised software development costs are not relevant anymore to the users of financial statements. Hence, the SPA opposed capitalisation and petitioned for the expensing of software development costs under the same regulation as for R&D under US GAAP (Swieringa, 1997; Aboody and Lev, 1998). The petition to abolish FASB statement No.86 failed as the statement still remains effective under US GAAP.
It has been common among managers to also oppose capitalisation. They consider intangible software to uncertain to capitalise and believe that amortisation of capitalised values is subjective which could result in the manipulation of financial reports. Regardless of the provisio n for deferral and amortisation most companies prefer to expense all their R&D costs for tax deductibility and R&D tax credit (Zhao, 2002). Managers have also been sceptic about relationship of costs of intangibles with their real value regarding future benefits and its value on the balance sheet. If R&D assets have been overcapitalised, revealing overestimated future gains, shareholders could undertake legal actions against managers (Aboody and Lev, 1998; Eccher, 1998; Rylander, Jacobsen and Roos, 2000). If the accounting regulations on R&D are strict enough the manipulation of financial statements in the benefit of companies
could be limited. Another reason for managers could be the costs that come along with assigning the amortisation to different periods.
According to Aboody and Lev (1998) forecasting analysts are another group of people that oppose capitalisation. They explain their aversion through the positive association found between analysts’ earnings forecast errors and the intensity of software capitalisation within firms. Aboody and Lev state (p. 186) ‘Capitalisation of an unknown portion of such a large cost component (referring to the share of R&D costs) increases difficulty of predicting the development expense and consequently predicting earnings, since the amount capitalised each period is determined by the largely unpredictable success rate and profit potential of the products under
development.’ These last two reasons for the managers and forecasting analysts could however not conclude a motive for the entire industry (Eccher, 1998).
Lev on the other hand opposes the expensing of R&D costs, in the FRBNY economic policy review of September 2003 (p. 18) he cited ‘Expensing intangibles is conservative for some companies, aggressive for others, and erroneous for al.’ Lev states that immediate expensing which is used in conservative accounting could result in aggressive accounting in later periods (conservative accounting meaning that the company underestimates earnings and the value of equity).
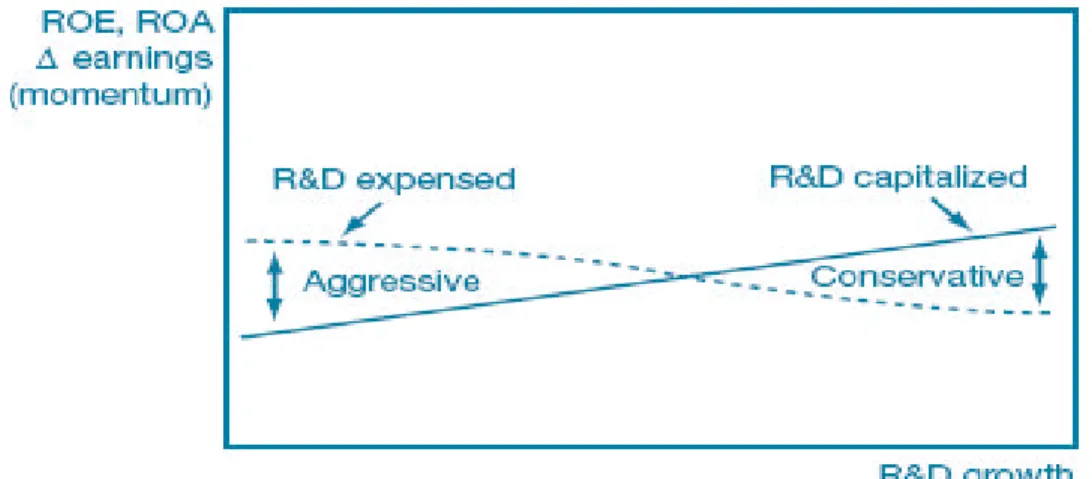
Figure 4.3 shows that companies with high R&D spending growth rates report conservatively when intangibles are expensed. Companies with low growth rates could manipulate financial figures, like return on assets (ROA) or return on equity (ROE), by aggressive reporting. In the model Lev shows that expensing doesn’t necessary mean conservative accounting as growth rates and earnings are portrayed better than they are. Therefore he says that the mismeasurement of profitability and assets due to the expensing of investment in intangibles results in conservative accounting is a myth.
As previously stated researchers like, Aboody (1998), Chan, Lakonishok and Sougiannis (2001) and Zhao (2002) share Lev’s view in support of capitalisation and have used the value relevance of intangible assets as an argument for capitalisation. Even though prior research shows the relevance of R&D capitalisation or R&D expense disclosure, it can not determine op to what level R&D costs should be capitalised. Whereas prior research mainly shows whether R&D is presumed to be
influence the value relevance of R&D and determine whether it should be capitalised or expensed.
Figure 4.3:Lev, expense or capitalise
(Lev, 2003): The solid line in the exhibit shows corporate performance if the R&D spending is
capitalised. The dashed line shows the performance resulting from the immediate expensing of R&D or other intangibles. The inflection point being when the rate of spending growth is equal to the company’s cost of capital.
Taken together the outcomes of prior research suggest that research and development is value relevant to investors and the majority of stakeholders seem to favour capitalisation. In the following chapters I will try to provide more insight on the capitalisation and expensing of R&D through an empirical analysis. For each research question these variables will be analysed further.
Chapter 5:
Hypothesis and research method
With the help of the conceptual design the different factors of influence and variables were selected to formulate hypotheses of importance in understanding the valuation of R&D. After having established the value relevance of R&D in a theoretical study, the variables that affect R&D can be examined through an empirical study. To conduct an empirical study on R&D I have focussed on a few different variables to compare to each other within the software and programming industry. When looking at the financial figures for software and programming companies accounting variables like revenue and the R&D investment ratio seems to catch the attention of stakeholders when giving value to the company. This leads to the following two hypothesizes:
H1) Research and development is more value relevant to investors for firms with a high R&D ratio than for firms with a low R&D ratio within the software and programming industry.
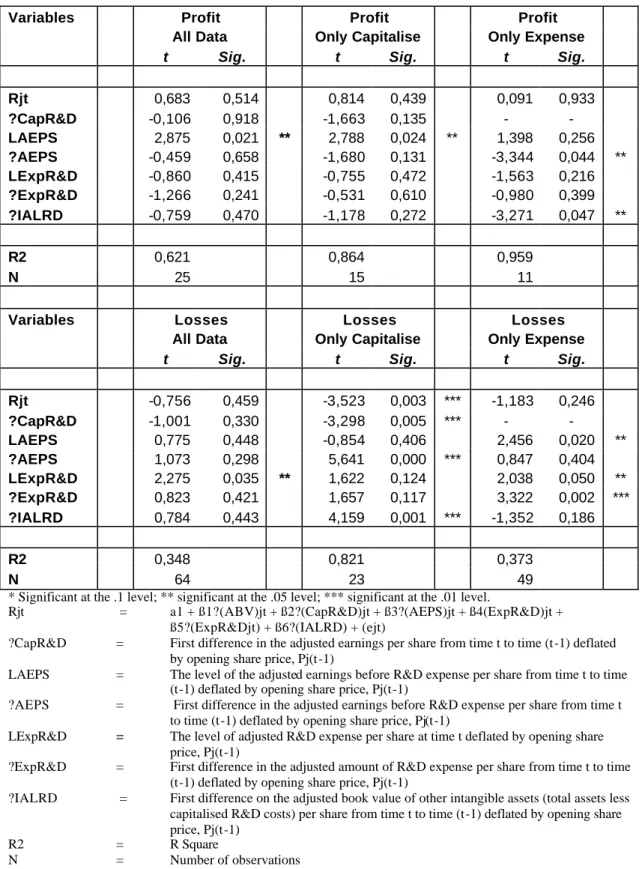
H2) Research and development is more value relevant to investors for firms which generate profits than for firms which generate losses within the software and programming industry.
To test whether the software and programming industry within the
Netherlands values R&D in accordance with other countries we make an international comparison using the following hypothesis:
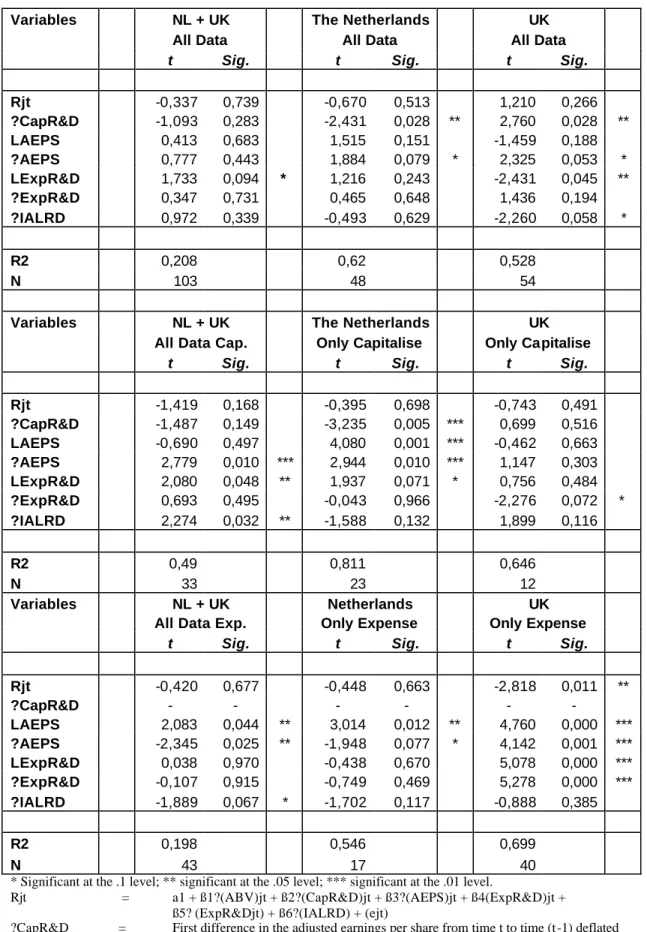
H3) Investors in the Netherlands value capitalised and expensed R&D the same as investors in England.
In previous chapters different opinions have been brought forward about capitalising and expensing. To conduct an empirical analysis on the stakeholder’s opinion on the capitalisation of R&D an international comparison was made for the following hypothesis:
To answer the formulated hypotheses the data was gathered, separated according to the different variables that have influence on the value relevance and inserted into an empirical model. The selected valuation model will be applied to the variables in the paragraphs hereunder and the findings and results from the empirical research will be discussed in chapter 6.
5.1 Variables selected in the model
This research has focussed on the difference in value relevance of R&D between companies that capitalise and that expense. To gain more insight as to why these companies capitalise or expense and to measure the difference in the value relevance of R&D the data was analysed according to the next variables: R&D ratio, profits and losses. After analysing the variables an overall comparison was made between data from the Netherlands and the United Kingdom.
5.2 The development of the model
To test my hypothesis I modified a valuation model used by Callimaci and Landry (2004). The valuation model relates stock price (P) to book value of common equity per share (BVS) and earnings per share (EPS). The following regression model will be used as a basis to determine the value relevance of capitalised and expensed R&D:
Pjt = a1 + ß1(ABV)jt + ß2(CapR&D)jt + ß3(AEPS)jt + (1) ß4(ExpR&D)jt + (ejt)
To determine relevance of capitalised and expensed R&D costs earnings per share (BVS) decomposed into:
(ABV) = Book value per share before capitalised R&D (CapR&D) = Capitalised R&D per share
The earnings per share (EPS) are disaggregated into:
(AEPS) = Earnings per share before R&D expense (ExpR&D) = R&D expense per share
(ejt) = Error term, representing the unexplained portion of stock price
For share price data Callimaci and Landry (2004), and Aboody and Lev (1998) use the share price listed around the month of March, three months after the fiscal year-end. This is the time when most financial statements are released and when relevant information about R&D spending is reflected into share prices. Consistent with Ohlson (1995) I assume that the accounting measurements satisfy the clean surplus relation. The clean surplus relation is an accounting proposition which implies that all changes in book value are reported as either income or dividends. This means that the accounting income for the selected companies must equal to the fiscal year change in book value of equity adjusted for dividends and capital contributions, and that the companies accounting incomes summed over their lifetime are identical (Ohlson, 1988).
The coefficient of R&D capitalisation (CapR&D), ß2, is expected to be positive, reflecting a positive association between R&D capitalisation costs and stock price (P). This would imply that the amount of capitalised R&D provides value relevant information to investors, which in turn is reflected in the stock prices.
Callimaci and Landry also introduced a return model suggested by Easton and Harris (1991). Easton and Harris investigated the relevance of earnings divided by price at the beginning of the stock return period for evaluating earnings/returns associations. Their primary motivation of the empirical analysis was to evaluate the relevance of the earnings level variable (A/P-1) and after to evaluate the relevance of change in the earnings variable (?A/P-1) (Easton and Harris, 1991). When
introducing both earnings level and earnings change in the model two annual flow variables need to be introduced; the level of capitalised R&D and the change in R&D expense. After adapting the variables within the model by deflating them by the opening share price it will result in:
Rjt = a1 + ß1?(ABV)jt + ß2?(CapR&D)jt + ß3?(AEPS)jt + (2) ß4(ExpR&D)jt + (ejt)
Price three months after year end, adjusted for stock splits and consolidations
?(ABV)jt = First difference in the adjusted book value of common equity per share from time t to time (t-1) deflated by opening share price, Pj(t-1)
?(CapR&D)jt = First difference in the adjusted earnings per share from time t to time (t-1) deflated by opening share price, Pj(t-1)
?(AEPS)jt = First difference in the adjusted earnings before R&D expense per share from time t to time (t-1) deflated by opening share price, Pj(t-1)
(ExpR&D)jt = The level of adjusted R&D expense per share at time t deflated by opening share price, Pj(t-1)
(ejt) = The unexplained portion of return from time t to (t-1)
Callimaci and Landry made one more modification to the model by
incorporating the change in R&D expense and not only the level of R&D expense and the change in R&D capitalisation as mentioned before. This results in a third
equation:
Rjt = a1 + ß1?(ABV)jt + ß2?(CapR&D)jt + ß3?(AEPS)jt + (3) ß4(ExpR&D)jt + ß5?(ExpR&Djt) + (ejt)
Decompose (ExpR&Djt) into (ExpR&Dj(t-1)) and ?(ExpR&Djt):
?(ExpR&Djt) = First difference in the adjusted amount of R&D expense per share from time t to time (t-1) deflated by opening share price, Pj(t-1)
(ejt) = The unexplained portion of return from time t to (t-1)
For the last few modifications I introduced the variable other intangible assets (IALRD) and the level of the adjusted earnings before R&D expense (AEPS) based on McCarthy and Schneider (1995), who have conducted a study showing the difference in the pricing of intangibles to each other and to other assets which has been used in several relevance studies e.g. Abrahams and Sidhu (1998). The model
was also adapted for the variable ?(ABV) which was excluded as it is enclosed in the variable Rjt. Consequently we also disaggregate the other intangible assets from the R&D related intangible assets resulting in the fourth and final regression equation:
Rjt = a1 + ß1?(CapR&D)jt + ß2?(AEPS)jt + ß3(AEPS)jt (4) ß4(ExpR&D)jt + ß5?(ExpR&Djt) + ß6?(IALRD) + (ejt)
Where:
?(IALRD) = First difference on the adjusted book value of other intangible assets (total assets less capitalised R&D costs) per share from time t to time (t-1) defla ted by opening share price, Pj(t-1) (AEPS) = The level of the adjusted earnings before R&D expense per
share from time t to time (t-1) deflated by opening share price, Pj(t-1)
The next chapter assesses the data selection and reports the results using model 4.
Chapter 6:
Data selection and results
The data and the selected formula was run and analysed with SPSS software. SPSS stands for Statistical Products and Service Solutions which allows the input and statistical analysis of data. The significant results and their interpretation will be given hereunder. The complete output of the data can be found in the appendix.
6.1 Data selection
The data collection for R&D has resulted in a difficult process. Data Stream and Bloomberg do not seem to provide such detailed information as; R&D expense, capitalisation of R&D or amortisation of R&D. Due to the lack of digitalised data, balance sheet and profit and loss account items had to be extracted out of annual reports using the KPMG annual reports database and company websites. Stock price information was obtained from Euronext and the AMADEUS database provided by Bureau van Dijk.
To collect data for empirical research the names of software companies were found through the European Business Browser provided by OneSource. Out of the 382 Dutch companies involved in the development of software and programming 17 have a quoted status of which only 12 had detailed information on R&D. No more than 6 of the 12 quoted companies have R&D expenses meeting the requirements for capitalisation. (The selection was limited to companies that have been active for at least the past two years.) At first the intention of this research was to only focus on the different variables and value relevance within the Netherlands. As a sample of only 12 companies would be too small to obtain any significant results it was necessary to include another country in the research. Because UK accounting standards seem very alike Dutch accounting standards I included the English Software and programming industry in my sample. Using a country with a resembling environment diminishes the differences in value relevance caused by the earlier mentioned ‘factors of influence’.
One Source provided a list of 168 public quoted software and programming companies situated in the UK. Out of the 15 companies of which further data was collected, 10 companies had capitalised R&D on their balance sheets. In total 123 observations were used from 27 companies to analyse the value relevance of R&D.