A New Version of the Item Count
Technique for Asking Sensitive Questions:
Testing the Performance of the Person
Count Technique
Felix Wolter
Johannes Gutenberg University Mainz, Institute of Sociology
Abstract
This paper presents empirical evidence on a recent advancement of the item count tech-nique (ICT, a survey techtech-nique for asking sensitive questions), namely, the person count technique (PCT; Grant, Moon, & Gleason, 2014). PCT utilizes person lists instead of lists of filler questions, as is the case in the classic ICT design. This simplifies the questioning procedure, but leads to some methodological challenges such as floor and ceiling effects. The main part of this paper presents empirical evidence stemming from an experimental postal survey in Germany (N = 580) investigating how well PCT performs as compared to standard direct questioning (DQ) with regard to alleviating misreporting for questions on attitudes towards refugees.
PCT prevalence estimates for hostile attitudes towards refugees are significantly higher than DQ estimates for one item, and non-significantly higher for three items. Although not consistently significant, the differences are substantial, amounting to a threefold in-crease of the proportion of respondents expressing negative attitudes towards refugees. Even though the findings are not unequivocally in favor of PCT, this new ICT variant still deserves consideration in the future and warrants further development. Specifically, more knowledge is required with respect to its statistical properties and the best practices of its implementation.
Keywords: Sensitive questions, response bias, misreporting, item count technique, person count technique, refugees, xenophobia.
Editorial note
The author of this article is one of the guest editors of this MDA special issue. To avoid conflict of interest, the article has been handled by the other two guest editors and the author has not been involved in any of the editorial work related to this article (such as selecting and inviting reviewers, deciding on revisions, and accepting the manuscript for publication). The identities of the reviewers have not been revealed to the author.
Acknowledgments
For helpful comments, I would like to thank Ben Jann, Peter Preisendörfer, Justus Junkermann, Bastian Laier, who came up with the idea of “fixed person counts”, and two anonymous reviewers of mda. I would also like to thank Jürgen Schiener and our students of the teaching project in which the data were collected.
Direct correspondence to
Dr. Felix Wolter, Institut für Soziologie, Johannes Gutenberg-Universität Mainz, Jakob-Welder-Weg 12, D-55128 Mainz, Tel.: +49 (0) 6131 39 20831
Background and Research Question
(Tourangeau & Yan 2007, p. 862). This could be because respondents may interpret an answer refusal as an “admission of guilt”.
In order to tackle the problem of misreporting (and item-nonresponse), survey methodologists have come up with a number of special questioning techniques. Conventional approaches encompass, for instance, anonymity assurances, “forgiv-ing word“forgiv-ing”, or the sealed envelope technique (Benson 1941; Perry 1979). A more elaborate procedure is the randomized response technique (RRT; Fox & Tracy 1986; Warner 1965), which has probably gained the most attention in the method-ological literature on sensitive questions in surveys. However, RRT procedures in surveys are usually complicated both for respondents and for interviewers. More-over, doubts have been raised regarding the efficacy of RRT in avoiding response biases (Wolter & Preisendörfer 2013). An alternative to RRT is the item count tech-nique (ICT, also referred to as list experiment or unmatched count techtech-nique; Droit-cour et al. 1991; Kuklinski, Cobb, & Gilens 1997), which has attracted increased interest within the research community in recent years.
As with RRT, the idea behind ICT is the anonymization of the interview sit-uation by adding noise to the data concealing the respondents’ answers. This is achieved by randomly splitting the sample into (at least) two groups. One group, the “short-list group”, receives a list of binary yes-no questions which are “harmless” and function as filler items (i.e., they are not important with regard to their con-tent). The other group, the “long-list group”, receives the same list of non-key items, but this time, the list additionally contains the (binary) sensitive item of interest. Respondents in both groups are asked not to answer each item individually, but rather to merely report the number of “yes” answers to the whole list. Therefore, the individual answer to the sensitive item is not disclosed to anyone, not even the interviewer (unless ceiling or floor effects occur, see below). For the whole sample, however, it is possible to calculate an estimate of the prevalence of the sensitive item by simply subtracting the mean of the short list from the mean of the long list. This classic ICT design for binary yes-no questions has recently been expanded upon with a version called item sum technique (IST; Trappmann et al. 2014; Wolter & Herold 2018), designed for quantitative sensitive items (such as the frequency of drug usage).
The person count technique (PCT) is another new variant of the classic ICT approach, originally proposed by Grant et al. (2014). PCT also applies to binary sensitive items, but instead of using lists of filler questions, it utilizes lists of per-sons. The short list is a number of people, and respondents are asked to report the number of persons for whom something applies. The long list corresponds to a list of persons as well, but also contains the respondent himself or herself.
study by Grant et al. (2014), there exists, as yet, no published research investigat-ing the performance of the only just recently proposed PCT. The empirical data presented here were gathered in a postal survey of N = 580 respondents in the City of Mainz, Germany. The PCT-DQ comparison is investigated for four questions on attitudes towards refugees/asylum seekers in Germany. According to the litera-ture (Krumpal 2012; Stocké 2007), expressing negative or hostile attitudes towards immigrants is prone to underreporting. Therefore, due to the enhanced anonymity in PCT mode as compared to DQ, self-reports on hostile attitudes towards refugees should be higher in PCT mode as compared to DQ mode (and, if item-nonresponse is a problem, it should be lower in PCT mode than in DQ mode).
The structure of this article is as follows: The next section will give a brief overview of methodological research on response biases pertaining to attitude questions about immigrants. Afterwards, I will first present the principles of ICT and PCT in more detail, followed by a discussion of methodological aspects and some general pros and cons of PCT vis-à-vis ICT. The “Study Design and Meth-ods” section is devoted to the description of the survey design and some issues of the statistical analyses. The “Results” section depicts the results regarding the PCT-DQ comparison, which are subsequently discussed within a broader frame-work in the final “Discussion” section.
Social Desirability Bias in Research about
Xenophobia
There is a long tradition of research on anti-immigrant or xenophobic attitudes in the social sciences (Allport 1954; Czymara & Schmidt-Catran 2016; Quillian 1995; Weins 2011, to cite but a few). One of the motivations driving this literature is the public and scientific concern regarding political extremism, or, more spe-cifically, regarding voting for (right wing) extremist parties in elections, for which anti-immigrant attitudes are seen as a major influencing factor (Arzheimer 2008). Studying the causes and consequences of xenophobia, however, requires a valid measurement of these attitudes. Several authors have argued that survey estimates from questions on anti-immigrant attitudes are prone to social desirability bias (An 2015; Cea D’Ancona 2014; Janus 2010; Krumpal 2012; Stocké 2007). Since there are social norms inhibiting the public utterance of such attitudes or opinions, some respondents may seek to avoid expressing them in survey interviews. This leads to the underreporting and underestimation of xenophobic attitudes.
desirability bias, existing studies concentrate on comparing varying estimates according to different questioning techniques or survey modes. The ensuing evalu-ation is then carried out relying on the “more is better” assumption, which means that for socially undesirable traits like anti-immigrant attitudes, higher estimates are considered to be more valid than lower ones.
There are three studies comparing DQ and RRT estimates. Krumpal (2012) finds a significant improvement due to RRT for one out of three items on xeno-phobia, the prevalence of respondents expressing a xenophobic attitude amounting to 27 percent in DQ mode and to 35 percent in RRT mode. The estimates for the remaining two items are virtually the same in both question formats and amount to about 40 and 30 percent, respectively. Ostapczuk, Musch, and Moshagen (2009) observe a non-significant difference between a DQ and an RRT question on xeno-phobia. Depending on the education level of the respondents, the prevalence esti-mates of expressing a xenophobic attitude range from 25 to 45 percent in DQ mode and from 47 to 76 percent in RRT mode. Finally, Hoffmann and Musch (2016) compare the crosswise-RRT, an adjusted version of RRT (Yu, Tian, & Tang 2008), with DQ for one item on xenophobia and one on islamophobia. They observe sig-nificantly higher estimates (49 versus 27 percent) using the crosswise model for the first item, but not for the second (52 versus 43 percent).
Studies investigating the effect of ICT on self-reports of anti-immigrant atti-tudes have also been conducted. An (2015) finds that, when asked directly, around 59 percent (depending on education) of the respondents are against “cutting off immigration to the United States”. When asked using ICT, this fraction shrinks significantly to around 33 percent. Significant differences between DQ and ICT have also been reported by Janus (2010) for the same item (58 vs. 39 percent), and by Cappelen and Midtbø (2016) for an item on welfare benefits for immigrants in Norway. The study by Creighton and Jamal (2015), in contrast, yields mixed results with respect to the DQ-ICT comparison. While there is no difference for an item on “granting citizenship to a legal immigrant who is Muslim”, a significant difference (28 vs. 11 percent) was observed for “granting citizenship to a legal immigrant who is Christian”.
Person Count: A Recent Advancement of the Item
Count Technique
As explained above, the basic idea of ICT and PCT lies in concealing respondents’ answers to binary sensitive survey questions by overlaying the data with noise. This noise is created by adding information about respondents’ answers to other filler items (ICT) or third persons (PCT) to the individual answer to the sensitive item. Both ICT and PCT require a random split of the sample into a short-list group and a long-list group. When using ICT, respondents in the short-list group receive a list of harmless yes-no items, for example (Wolter & Laier 2014): “Below you see a list of four questions. Please indicate only the number of questions you answer with ‘yes’, thus, a number between zero and four. 1. Have you ever been abroad? 2. Have you ever used a taxi? 3. Have you used a plane this week? 4. Did you wash your car this week?”. Respondents in the long-list group receive a list containing the same four non-key items plus the sensitive item of interest, for example “Have you ever driven a car while drunk?”. Again, respondents are asked to only report the number of items they answer with “yes”. In doing so, the individual answer to the sensitive item is not disclosed. Of course, this is true only if no ceiling or floor effects occur, i.e., if the respondent does not negate all items in the list or reports that all items apply. In order to avoid ceiling and floor effects, the non-key items should contain both low-prevalence and high-prevalence questions which ideally are negatively correlated among each other (Droitcour et al. 1991).
The PCT replaces the list of filler questions with a list of persons, and respon-dents are asked to report the number of persons for whom (they think that) some-thing (sensitive) applies. In the short-list group, the list only consists of other unin-volved people; in the long-list group the respondent himself is added to the list; respondents report the number of persons for whom something applies including themselves. In the original proposition by Grant et al. (2014, p. 11–12) respondents were asked the following question: “We want to know what type of candidates people would support for President of the United States. Because this is a sensitive topic, we are not going to single you out. Instead, please think about three people you see or talk to often and we’re going to ask you how many of these three people might be willing to vote for each type of candidate. We’re going to ask about five candidates: a Republican, a Democrat, a Tea Party candidate, a Mormon, and a woman. It’s ok to guess if you are not sure how many of the three people would vote for each candidate. […]” In the short-list group the introduction subsequently read “Thinking of these three people, how many would be willing to vote for [a repub-lican, a democrat, a woman etc.]”, while in the long-list group, it read “Thinking of you and these three people […]”.
For both the basic ICT and the PCT, a prevalence estimate of the sensitive item
ˆ
provided that the short-list and long-list samples are independent. xLL and xSL
represent the mean of the reported numbers in the long-list and short-list group, and
( )
Var x the sampling variance of the mean estimate.
ˆ xLL xSL
π= − (1)
( )
ˆ( )
( )
. . LL SL
S E π = Var x +Var x (2)
One advantage of the PCT design vis-à-vis ICT is that having one list of persons means that many sensitive items can be asked at once in the same survey. With ICT, a different item list is required for every sensitive item due to anonymity concerns (or, as Grant et al. 2014, p. 6, put it, an additional random split of the sample for every additional sensitive question, when using the same short list for every item). Also, no fabrication of artificial filler items is necessary with PCT, which could, in turn, simplify the answering process for the interviewees because they only have to deal with one question instead of a question list. But this, of course, has to be investigated empirically. One should also note that respondents may not be cer-tain whether the trait being asked about applies to one or more of the uninvolved persons in the list. As cited above, Grant et al. (2014) try to solve this problem by prompting respondents “to guess if you are not sure”. If the interviewees follow this instruction, possible errors in judging about the status of the “other persons” represent no problem for the validity of the PCT estimate because, due to the exper-imental design (random split into short-list and long-list), the errors in both groups will be equal (Grant et al. 2014, p. 19) – provided that there are no design effects (see below). There are, however, some other challenges inherent to the PCT design, namely floor and ceiling effects, statistical power issues, and design effects. These challenges share (at least to some extent) a common cause, namely homophily effects, which I shall discuss first.
argu-ment is that the choice of the “other persons” may be guided by the question content and context (certain stimuli make respondents think of certain types of people). For instance, if the survey question deals with substance abuse, a respondent who smokes marihuana is probably going to imagine a list of “other persons” who are also inclined to smoke marihuana. This conjecture is supported by empirical evi-dence from social network research on name generators, which shows that question content and context exert an influence on the data generated by name generators in survey settings (e.g., Ferligoj & Hlebec 1999; Shakya et al. 2017). One finding of this research is also that individuals have different networks for different issues: “A person with whom someone discusses politics may not be the person upon whom they rely for assistance with a sick child” (Shakya et al. 2017, p. 158). A third argu-ment for the occurrence of homophily effects (referring to values or attitudes) in PCT designs is derived from research showing that actors often subjectively over-estimate the degree to which their acquaintances are similar to them (Huckfeldt & Sprague 1995): “People tend to assume that their friends are like them, when in fact areas of disagreement simply are not discussed” (McPherson et al. 2001, p. 429). Hence, when asked about characteristics of their acquaintances in PCT procedures, respondents may ascribe similar traits to the “other persons” even if this is objec-tively not the case.
In short, when using PCT we should expect that respondents generate lists of uninvolved persons that, due to homophily, share similar characteristics as them-selves. This is probably further reinforced by framing effects of the question con-tent and context, and by a subjectively overestimated degree of similarity by the respondents.
respondents. If floor and ceiling effects occur, respondents may feel cheated by the survey authors.
Another consequence of homophily effects, directly related to the issue of floor and ceiling effects, are issues of statistical power. One main drawback of all ICT designs is that they always produce larger standard errors than conventional esti-mates. This is obvious, because noise is artificially added to the data. The amount and the statistical properties of this noise affect the statistical efficiency of ICT esti-mates, which means that design aspects of the ICT/PCT procedure affect statistical efficiency and that there is a trade-off between efficiency and respondent protection (Coutts & Jann 2011; Trappmann et al. 2014). The standard errors of ICT estimates depend on (among other things) the number of non-key items (or the number of uninvolved persons in the PCT procedure), their prevalence, and the covariance between the sensitive item and the filler items (see, for example, Corstange 2009; Trappmann et al. 2014 for a more detailed discussion). For a high level of statistical efficiency, it is desirable that the variance of the short list (non-key items) is small. To achieve this, it is preferable that the number of non-key items or “other persons” is low, that they have a prevalence near 0 or 1 (low variance), that they are nega-tively correlated with the sensitive item, and also neganega-tively correlated among each other. Homophily among the uninvolved persons and the respondents themselves counteracts these ideals, because it causes high variance in the answers (people will tend to cluster at the minimum and maximum), and thus a large PCT standard error. In the basic ICT design, these features can be controlled by an appropriate and careful choice of the non-key items. For PCT, things are more difficult, because the researcher does not choose the “other persons” whom the respondents are asked to imagine. Hence, it is only the length of the short list (the number of uninvolved persons) that is directly controllable by design. As, for example, Wolter and Laier (2014, p. 155) recommend with respect to the ICT literature, a list length of three to five non-key items seems to be a good choice.
effects. Pragmatically, Blair and Imai (2012) propose a statistical test empirically testing whether design effects have occurred.
One further constraint of PCT is that the so-called double list design cannot be implemented in a straightforward manner. Double list designs (Biemer et al. 2005; Droitcour et al. 1991) can improve the efficiency of ICT estimates considerably. The double list procedure administers a second short list of non-key questions to the respondents. Those in the original short-list group receive this second list includ-ing the (same) sensitive item; respondents in the former long-list group answer the second list without the sensitive item. The estimates from both lists can then be combined, resulting in lower standard errors than with only one list of innocuous questions. With PCT, this logic does not work because there is only one short list of “other persons”. A remedy would be to introduce a second list of (different) people, but this seems to overcomplicate matters.
The issues discussed above reveal that the newly proposed PCT brings some challenges with it requiring further methodological and empirical research on how design aspects of PCT procedures affect the mechanisms at work and the statistical properties of the resulting estimates. This research should clarify whether the gain in simplicity of PCT vis-à-vis ICT outweighs the difficulties inherent to PCT and whether and how these problems can be resolved.
Besides these statistical aspects of ICT and PCT designs, the essential purpose and main goal of using these techniques remains achieving valid survey responses. With respect to ICT, a comprehensive meta-analysis of studies investigating the efficacy of ICT procedures with regard to avoiding or alleviating response bias is, to my knowledge, still lacking. Existing (summary) studies, however, do point, at least partially, to the result that ICT is successful in reducing response bias:1 A
small meta-analysis by Tourangeau and Yan (2007) of seven studies in which ICT was compared to DQ finds an overall positive, but non-significant ICT effect. A lit-erature review by Wolter and Laier (2014) counts 22 comparative studies, of which 17 find results that are at least partially in favor of ICT. Two studies with aggregate external validation data in the field of voting behavior (and self-reporting on it) both find that ICT performs better than DQ with respect to response bias, but ICT estimates are still off the mark with regard to the externally validated true value (Comşa & Postelnicu 2013; Rosenfeld, Imai, & Shapiro 2015).
In terms of PCT, Grant et al. (2014) themselves provide a first empirical assessment of its performance as compared to DQ. In a telephone survey among registered voters in Illinois, respondents were asked about their intentions to vote for certain types of candidates in presidential elections. The PCT design corre-sponds to the one introduced above in this paper. The authors first find significant
evidence for design effects regarding the Republican candidate item (which, for this reason, is not analyzed any further in the rest of the paper), and no evidence for design effects for the other four items. Second, PCT estimates of respondents claiming to be ready to vote for the respective type of presidential candidate are significantly lower than their DQ counterparts regarding the Democrat, female, and Mormon candidate (with a difference of about 20 percentage points). This is in line with the hypothesis that survey respondents, due to social desirability, claim to be open-minded and devoid of prejudice when asked directly, which results in overre-porting in this case. For the latter item (“tea party member”), no difference is found between question modes.
Study Design and Methods
Survey Design
The PCT-DQ comparison for attitudes towards refugees was part of a local postal survey in the city of Mainz (Germany). The survey went by the title “Living and Residing in Mainz” and contained questions on a variety of topics: of the two main parts of the questionnaire, one was devoted to environmental problems, the other to attitudes and behaviors regarding foreigners and refugees/asylum seekers. Field work was carried out in autumn 2016. It should be noted with regard to the topic of refugees that within this period of 2015/2016, large numbers of asylum seek-ers, mainly from Syria and Afghanistan, came to Germany, which, in turn, created considerable concern and tension in the political debate and among parts of the German population.
Because one aim of the survey (not related to the topic of this paper) consisted in obtaining georeferenced data, we employed a special sampling design. Following an idea of Bauer (2014), we conducted a street section sample. Using GIS software for geographical data, we first identified all residential areas within the municipal area of Mainz and then randomly distributed 200 sampling points within these areas. For each of these (preliminary) sampling points, we then established the geo-graphically nearest street sections, street section referring to the section between two street intersections (footways included). We then counted the number of house-holds in each street section, yielding a number of 11,208 househouse-holds. Another ran-dom sample of 68 street sections was then drawn from the original 200 sampling points, containing about 4,000 households.2 Finally, every second household was
manually assigned a questionnaire package. The package included a cover letter and a stamped envelope in order to send back the filled-out questionnaires without postage costs. We used the next-birthday method to randomly choose an adult per-son within each household. This sampling design leads to the selection probability decreasing for persons in larger households. However, I abstain from using design weights for the analyses, since the main goal of this study is the experimental com-parison between DQ and PCT.
Out of 2,000 distributed questionnaires, 580 were returned, which corre-sponds to an AAPOR response rate of 29 percent (RR2). Because this study was a pilot study within the framework of a teaching project with MA students in sociol-ogy and, therefore, without funding, we were not able to dispatch follow-up letters or questionnaires to respondents who did not reply after the initial distribution of questionnaires.
The survey featured an experimental split into two subsamples. One half of the respondents were assigned to the PCT version of the questions on refugees, the other half to the DQ version. The DQ version also contained the short list of the PCT design. Normally, one would prefer to form three subgroups (DQ, short list, long list), but due to the financial restrictions of this study, we chose not to in order to ensure a sufficiently high number of cases in each group. However, this means that the samples yielding the DQ and PCT estimates are not independent from one another, which in turn requires special statistical procedures for the empirical anal-ysis (see below).
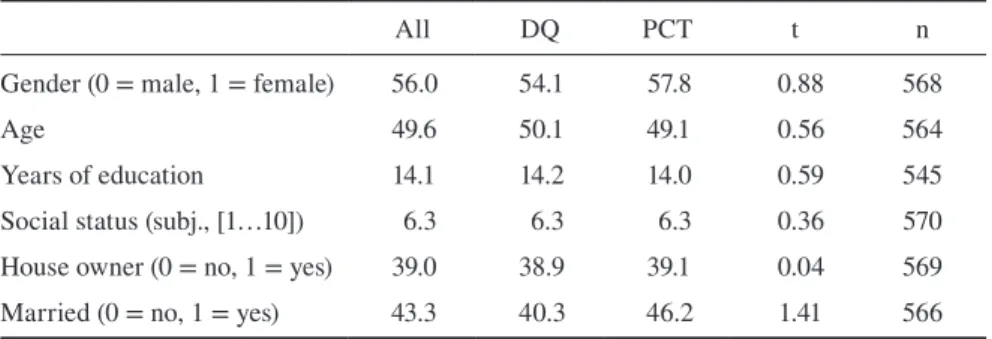
In the analysis sample, 49 percent of all cases are in the DQ/PCT short-list group and 51 percent are in the PCT long-list group. This corresponds almost exactly to the 50-50 partitioning envisaged by the design. Table 1 reports the dis-tribution of some socio-demographic variables by question format. There are no significant differences between the two experimental groups, meaning the random-ization worked as intended. Women are slightly over-represented in the sample, as are people with higher education.
PCT Procedures
The PCT procedure was located roughly in the middle of the questionnaire within a block of various questions on attitudes, contact, and behaviors vis-à-vis refugees and immigrants in general. The PCT questions were devoted to aspects regarding refugees in the city of Mainz. The exact question wording for the long-list group
and the four sensitive items are depicted in Figure 1 (translated from the German original).
There are three things to note on this design. First, the instruction asked respondents about “preferably diverse persons”. This was done in order to avoid homophily effects and, thus, to reduce the likelihood of floor and ceiling effects. Second, the design asked respondents to write down the initials of the first names of their imagined persons. On the one hand, pretests had shown that this helps respon-dents in coping with the questioning procedure. On the other hand, it is desirable that respondents do not switch around the people they are thinking of depending on the question content or the respondent’s own opinion (or for other reasons such as lack of knowledge about the persons of whom they initially thought). Of course, this is not a problem as long as the switching behavior is similar in both groups. However, the stimulus of including oneself in the long-list group might result in a different manner of switching and, hence, trigger design effects and biased results. By letting respondents write down the initials of their imagined persons we hoped to avoid this. Third, we did not introduce the PCT procedure as an “anonymiz-ing technique” for “sensitive questions” or the like in order to avoid the respon-dents framing them in the sense of “the next questions are really sensitive”, which could be detrimental to the aim of achieving valid estimates. Also, this makes the questionnaire instruction more comparable to the short-list version of the PCT procedure. Furthermore, we anticipated that floor and ceiling effects could occur, resulting in a disclosure of the respondent’s individual answer. Introducing PCT as a technique that guarantees anonymity would represent a contradiction if this occurred and could lead to doubts or protests among respondents.
Table 1 Distribution of Socio-Demographic Variables by Question Mode
All DQ PCT t n
Gender (0 = male, 1 = female) 56.0 54.1 57.8 0.88 568
Age 49.6 50.1 49.1 0.56 564
Years of education 14.1 14.2 14.0 0.59 545
Social status (subj., [1…10]) 6.3 6.3 6.3 0.36 570
House owner (0 = no, 1 = yes) 39.0 38.9 39.1 0.04 569
Married (0 = no, 1 = yes) 43.3 40.3 46.2 1.41 566
The wording in the short-list group was identical to the one presented in Fig-ure 1, with the important difference that respondents were asked only about “three people” without themselves and to report a number between zero and three. As the short-list version of the questionnaire also contained the DQ questions of the four sensitive items, immediately after the short-list PCT procedure, the question-naire read “And now we are interested in your personal opinion on these questions. Please answer with ‘yes’ or ‘no’”, followed by the same four items as in the PCT long-list version.
The following questions are about the situation in Mainz.
We are going to use a special questioning technique. For this purpose, please think of three preferably diverse persons among your friends, acquaintances or relatives who you know well and who live in Mainz, too. You can write down the initials of the first name of the three persons in the fields below – this makes things easier, but your notes will remain anonymous.
Initials of my three persons:
Now we are going to make a few statements for which you should estimate how many of these three persons plus yourself agree with the respective statement. The answer is thus a number between 0 (applies to no one) and 4 (applies to all three of the persons and yourself). If you are not sure, it is OK to guess, this is not a prob-lem.
[Item 1] “I feel bothered by the refugees in Mainz”.
Number of persons who agree:
[Item 2] “Refugees should not stroll around in the city center of Mainz, but stay in their asylums”.
Number of persons who agree:
[Item 3] “I have a problem with refugees hanging out in my neighborhood”.
Number of persons who agree:
[Item 4] “The opening of a refugee asylum in my neighborhood would bother me”.
Number of persons who agree:
Note: Translated from the German original. Underlining is depicted as in the original.
Methods
The survey design with only two (DQ and PCT short list versus PCT long list) instead of three experimental groups means that DQ and PCT estimates are not statistically independent from one another. This must be taken into account when calculating standard errors. Therefore, I calculated the mean estimates for DQ and for the short-list and long-list group, respectively, and used the Stata routine suest (seemingly unrelated estimation) in order to obtain a combined and robust covari-ance matrix. Tests for mode differences were then performed using this covaricovari-ance matrix (cf. Weesie 1999).
As explained above, design effects are a potential problem of item count pro-cedures. They occur if the addition of the sensitive item (or the respondent in PCT) to the long list affects the responses to the non-key items (“other persons” in PCT). I will follow the recommendations of Blair and Imai (2012) who propose a statisti-cal test in order to empiristatisti-cally test for design effects. This test basistatisti-cally examines whether implausible negative proportions of respondent types (i.e., respondents with a certain combination of “yes” answers) arise if the sensitive item (the respon-dent himself or herself) is removed from the respective proportion of responrespon-dent type. If such negative proportions occur, the test calculates whether they could have arisen by chance. As the test’s logic and computation are complex, I refer to Blair and Imai (2012, pp. 63-65; see also Glynn 2013, pp. 165-167; Wolter & Laier 2014, p. 161) for further details. The test was performed using the “list” package for R by the same authors (Blair & Imai 2013).
Results
A conjecture made by some authors (e.g., Lensvelt-Mulders 2008, p. 464) is that sensitive questions result in higher item-nonresponse rates than non-sensitive ques-tions. If this conjecture holds true and PCT works as intended, nonresponse should be lower when using PCT as compared to DQ. On the other hand, the PCT design requires more cognitive effort on the part of the respondents vis-à-vis answering a conventional survey question, which, in turn, could increase nonresponse rates. Table 2 shows the item-nonresponse rates for each of the four sensitive items regard-ing attitudes towards refugees in DQ mode and in the two groups of PCT mode.
at least on a 10 percent level. However, the higher nonresponse rates do not seem to be attributable to PCT causing the items to appear more sensitive to the respondents (which in turn could yield higher nonresponse rates), because the nonresponse rates for the PCT short-list version are similar to those from the long-list group and not significantly different from them. Instead, it is the PCT design per se – be it the short or the long list – which boosts nonresponse rates, presumably due to its cogni-tive demands. Of course, this would be a drawback of this new questioning tech-nique. However, it should again be noted that the survey was self-administered with no interviewer present. Taking this into consideration, nonresponse rates of 6 to 7 percent do not appear to be exceedingly or unreasonably high. Further studies should examine to what degree interviewer-administered survey modes can pro-vide a better approach in order to avoid item-nonresponse in PCT designs.
Before we look at the prevalence estimates for the four sensitive items depend-ing on question mode, Table 3 reports information on the distribution of respon-dents’ answers in the short-list and long-list group, respectively. What is important here are floor and ceiling effects, i.e., respondents denying or affirming all items or persons in the list. Above I made the case for the assumption that, when using PCT instead of ICT, floor and ceiling effects will be more problematic because of homophily effects.
The results in Table 3 clearly confirm this assumption. Floor effects are sub-stantial for all four items, both for the short-list and the long-list groups. Up to 77 percent of respondents report that the sensitive item applies to none of the per-sons of whom they had been asked to think. For the long-list group, containing the respondent himself or herself, anonymity is no longer ensured. However, given that a “yes” answer to the sensitive item corresponds to expressing a socially
undesir-Table 2 Item-Nonresponse Rates by Question Mode
Item 1 Item 2 Item 3 Item 4
DQ (n = 284) % NR 2.46 2.82 2.11 2.11
PCT LL (n = 296) % NR 5.74 6.08 6.08 6.08
PCT SL (n = 284) % NR 7.04 6.69 6.69 7.04
χ2 DQ-PCT LL 3.93 * 3.61 + 5.75 * 5.75 *
χ2 DQ-PCT SL 11.27 *** 8.07 ** 11.27 *** 12.25 ***
χ2 PCT LL-PCT SL 0.41 0.09 0.09 0.22
able attitude, these floor effects are probably less problematic regarding response bias. In this regard, ceiling effects, i.e., respondents reporting “4” for the long list are the main problem, because their sensitive answer is no longer concealed by the PCT design. This holds for approximately 7 (item 1 and 3), 3 (item 2), and 15 (item 4) percent of respondents. While 3 percent (corresponding to 9 out of 278 respon-dents) appear to be within an acceptable range, 15 percent for item 4 (42 out of 278 respondents) is definitely too high and endangers the main purpose of PCT, namely assuring anonymity. At first glance, this appears to be a major drawback of PCT as compared to the classic ICT design, wherein floor and ceiling effects can be pre-vented by a careful design of the non-key items. Further studies should investigate possibilities to avoid floor and ceiling effects in PCT designs. For the time being, I suggest following our PCT design reported in Figure 1 above and, at least for now, to not all too loudly hail PCT as a technique that “guarantees complete anonymity”. Future research should also investigate whether the wording of the items affects the tendency for floor and ceiling effects. For example, for item 2 (Table 3), the fraction of “0” answers is by far the highest among the four items. In addition to substantive reasons regarding the level of sensitivity of this item, it can be assumed that this is due to the different cognitive demands processing a single sentence (item 1, 3, and 4) vis-à-vis a normative statement (item 2) requires.
Besides looking at floor and ceiling effects, I performed the aforementioned test for design effects as proposed by Blair and Imai (2012). For none of the four sensitive items could I find evidence for such effects, the p-values for items 1 to 4 are, respectively, p = 0.72, p = 0.69, p = 1.00, and p = 1.00 (the null hypothesis is that there are no design effects; thus, the null cannot be rejected according to the p-values). This can be interpreted as being in favor of PCT, because, at least empiri-cally, based on the Blair-Imai test, there is no evidence that including the
respon-Table 3 Distribution of Answers in the Short-List and Long-List Group
Item 1 (%) Item 2 (%) Item 3 (%) Item 4 (%)
SL LL SL LL SL LL SL LL
0 56.8 49.5 77.0 73.7 44.5 35.6 27.7 21.6
1 22.7 23.7 16.2 13.0 30.9 30.9 31.1 19.8
2 14.4 11.5 4.2 7.2 16.6 18.4 23.1 25.2
3 6.1 8.6 2.6 2.9 7.9 8.6 18.2 18.4
4 - 6.8 - 3.2 - 6.5 - 15.1
n 264 279 265 278 265 278 264 278
dents themselves in the PCT-long-list changes response behavior to the “other per-sons” in the list.
Table 4 reports the main results of the study, namely the prevalence estimates of the four sensitive items on attitudes towards refugees in Mainz, according to question formats DQ and PCT. As expressing hostile attitudes towards refugees is considered socially undesirable, higher estimates are taken as more valid than lower ones. Therefore, the DQ-PCT comparison is based on the “more is better” assumption.
The estimates of dismissive attitudes towards refugees are substantially higher in PCT mode than in DQ mode. This holds for all four items. Regarding item 1 and 2 (“I feel bothered by the refugees in Mainz”; “Refugees should not stroll around in the city center of Mainz, but stay in their asylums”), the PCT estimates are three times higher than the DQ ones. However, as the z statistics show, PCT-DQ differ-ences are statistically significant for the first item only, while for item 2 to 4, DQ estimates are not significantly different from their PCT counterparts at conven-tional levels. An overall test for the DQ-PCT difference, taking into account the four items simultaneously and adjusting for the clustering by respondents, also fails to reach conventional significance levels (diff = 12.21, z = 1.46, p = 0.145). These results are due to the highly inflated standard errors of the PCT estimates. For example, the estimate of 54 percent “yes” answers for item 4 comes with a standard error of more than ten percentage points. As pointed out above, standard errors of ICT estimates will always be higher than those from conventional ones. However, the PCT procedure, as it was implemented in this study, probably aggravates this issue for several reasons. On the one hand and as shown above, there are many respondents who answer “zero” to the person list, and a non-negligible fraction states that the trait applies to all persons in the list. This pattern inflates the vari-ance of the variables, which, in turn, leads to greater standard errors. In classic ICT with non-key items that have either a high or low prevalence, the variance will usually be lower and the standard errors will also follow suit. On the other hand, the correlation between the sensitive item (in PCT: the respondent himself) and the filler items (in PCT: the “other persons”) is probably not negative due to homophily effects, which also boosts standard errors. Furthermore, the prevalence of the sensi-tive trait itself will also have an impact on standard errors, because the variance of binary variables is a function of their mean and highest for an equal distribution (i.e., a prevalence of 50 percent). These considerations show that careful precau-tions are required when developing PCT designs. Further studies should go into more depth on these issues and examine the relationship between design features and statistical properties of PCT estimates in a more general perspective.
direction of the DQ-PCT comparison points in the anticipated direction. Most of the respondents were able to cope with the PCT instructions without assistance of an interviewer and nonresponse rates were not unreasonably high.
Discussion
The present study evaluated the performance of PCT in a mode-comparing per-spective and investigated item-nonresponse and underreporting on four questions regarding hostile attitudes towards refugees in a German city. As far as nonre-sponse is concerned, the observed rates are higher in PCT mode than in DQ mode. This, however, seems not to be caused by the sensitivity of the questions being asked, but by the PCT procedure itself, which was implemented here in a self-administered postal survey. Despite being higher, nonresponse rates remain at a tolerable level also in PCT mode. With respect to the prevalence of the four sensi-tive items, all estimates are distincsensi-tively higher in PCT mode, though significantly different from DQ for one item only. In this context, very large standard errors of the PCT estimates have been observed, presumably caused by the distribution of answers regarding the “other persons” in the item lists and their correlations among each other and with the respondent himself in the long list. All in all, however, the results show that considerable underreporting of hostile attitudes to refugees
Table 4 Prevalence Estimates of the Sensitive Items by Question Format
Item 1 Item 2 Item 3 Item 4
DQ % “yes” 9.75 5.43 23.74 43.88
s.e. 1.78 1.37 2.55 2.98
n 277 276 278 278
PCT % “yes” 29.94 16.47 31.50 53.79
s.e. 9.43 7.20 9.28 10.44
n (short list) 264 265 265 264
n (long list) 279 278 278 278
Difference 20.20 10.72 7.76 9.91
z 2.00 * 1.43 0.75 0.83
occurs when using conventional questioning techniques. Although the findings are not unequivocally in favor of PCT, they suggest considering PCT as a promising alternative in future studies.
Aside from the general difficulties of PCT, this study has some obvious short-comings, that should be taken into account when judging the results. First, the num-ber of cases (N=580) was low. As the elevated standard errors of the PCT estimates show, a larger sample would have been much more preferable and should be aimed for in future studies. Because of the limited sample size, a two-group design (DQ and PCT short list versus PCT long list) had to be used instead of a three-group design with a random split into DQ-, short-list, and long-list subsamples. This two-group design means, firstly, that DQ and PCT estimates are not statistically inde-pendent, which has to be taken into account when performing tests for differences. Secondly, halo effects may affect the results because the experimental stimulus (PCT versus DQ) is confounded with question order. The limited statistical power was also the reason why I restricted the analysis to prevalence estimates and did not conduct a regression analysis on determinants of xenophobic attitudes. Such analy-sis could have been helpful in judging the external validity of the PCT estimates. Whereas regression analysis is generally possible with ICT (or PCT) data (Blair & Imai, 2012, 2013; Imai 2011), it requires large sample sizes due to the restricted sta-tistical power of PCT data. Further, the elevated item-nonresponse rates of the PCT questions show that self-administered survey modes may not be the best choice when planning to use PCT procedures. Interviewer-administered surveys seem to be preferable in this regard. Another flaw is that validation of the PCT results could only be carried out here on the basis of a “more is better” assumption. As no true values were at hand, higher estimates of hostile attitudes to foreigners were assumed to be more valid. To what degree higher estimates are still off the mark from the true value remains undiscoverable with this approach.
Above, several challenges of PCT have been pointed out, namely floor and ceiling effects, statistical power issues, and design effects. In contrast to the clas-sic ICT design, the researcher has less influence on addressing these issues via a thoughtful design of the non-key items. In what follows, I will propose some modifications or alternatives to the PCT design as it was implemented in the present study, which could (partly) address these issues.
Bob Marley and Pope Francis are more or less fixed and near 1 and 0, respectively. This avoids floor and ceiling effects and improves statistical efficiency. For the sake of anonymity, the Angela Merkel item is more ambiguous. Of course, this is just an illustrative example, as one should not choose such obvious cases as Bob Marley and marihuana consumption. One could easily imagine other possible designs in this regard, for instance, letting respondents imagine a member of a typical group such as a “typical democrat voter” or a “typical primary school teacher”. Or, to think of their nearest neighbor, their postman, or their family doctor. A clever choice of these more or less fixed persons might help overcome the problems inher-ent to the basic PCT design.
Another straightforward modification of PCT is to apply the logic of the above-mentioned item sum technique (IST) for metric sensitive variables to a PCT procedure – the person sum technique (PST) as proposed by Junkermann (2018). PST also asks respondents to imagine one or more other persons they know – as with IST, however, one non-key person will usually suffice. Respondents are then asked to estimate the value of one quantitative sensitive item for the other person in the short-list group. In the long-list group, respondents are asked to add up the value of the other person and their own value. For example, the sensitive item could be the number of cigarettes smoked per day. Respondents in the long-list group are then asked to estimate the number of daily smoked cigarettes for the uninvolved person, and to add this value to the number of cigarettes smoked by themselves.
References
Allport, G. W. (1954). Ther Nature of Prejudice. Reading, MA: Addison-Wesley.
An, B. P. (2015). The Role of Social Desirability Bias and Racial/Ethnic Composition on the Relation Between Education and Attitude Toward Immigration Restrictionism. The Social Science Journal, 52(4), 459–467.
Arzheimer, K. (2008). Protest, Neo-Liberalism or Anti-Immigrant Sentiment: What Moti-vates the Voters of the Extreme Right in Western Europe? Zeitschrift für vergleichende Politikwissenschaft, 2(2), 173–197.
Barton, A. H. (1958). Asking the Embarrassing Question. Public Opinion Quarterly, 22(1), 67–68.
Bauer, J. (2014). New Sample Designs. An Improvement and Alternative to Random Route Samples. Working Paper: LMU München.
Benson, L. E. (1941). Studies in Secret-Ballot Technique. Public Opinion Quarterly, 5(1), 79–82.
Biemer, P. P., Jordan, B. K., Hubbard, M., & Wright, D. (2005). A Test of the Item Count Methodology for Estimating Cocaine Use Prevalence. In J. Kennet & J. Gfroerer (Eds.),
Evaluating and Improving Methods Used in the National Survey on Drug Use and Health (DHHS Publication No. SMA 05-4044, Methodology Series M-5) (pp. 149– 174). Rockville: Substance Abuse and Mental Health Services Administration, Office of Applied Studies.
Blair, G., & Imai, K. (2012). Statistical Analysis of List Experiments. Political Analysis, 20(1), 47–77.
Blair, G., & Imai, K. (2013). Package ‘list’. Statistical Methods for the Item Count Tech-nique and List Experiment: retrieved on http://cran.r-project.org/web/packages/list/list. pdf (2018/01/22).
Bradburn, N. M., & Sudman, S. a. A. (1979). Improving Interview Method and Question-naire Design. Response Effects to Threatening Questions in Survey Research. San Francisco: Jossey-Bass.
Cappelen, C., & Midtbø, T. (2016). Intra-EU Labour Migration and Support for the Norwe-gian Welfare State. European Sociological Review, 32(6), 691–703.
Cea D’Ancona, M. A. (2014). Measuring Xenophobia: Social Desirability and Survey Mode Effects. Migration Studies, 2(2), 255–280.
Comşa, M., & Postelnicu, C. (2013). Measuring Social Desirability Effects on Self-Reported Turnout Using the Item Count Technique. International Journal of Public Opinion Re-search, 25(2), 153–172.
Corstange, D. (2009). Sensitive Questions, Truthful Answers? Modeling the List Experi-ment with LISTIT. Political Analysis, 17(1), 45–63.
Coutts, E., & Jann, B. (2011). Sensitive Questions in Online Surveys: Experimental Results for the Randomized Response Technique (RRT) and the Unmatched Count Technique (UCT). Sociological Methods and Research, 40(1), 169–193.
Creighton, M. J., & Jamal, A. (2015). Does Islam Play a Role in Anti-Immigrant Sentiment? Ab Experimental Approach. Social Science Research, 53, 89–103.
Droitcour, J., Caspar, R. A., Hubbard, M. L., Parsley, T. L., Visscher, W., & Ezzati, T. M. (1991). The Item Count Technique as a Method of Indirect Questioning: A Review of its Development and a Case Study Application. In P. P. Biemer, R. M. Groves, L. E. Lyberg, N. A. Mathiowetz., & S. Sudman (Eds.), Measurement Errors in Surveys (pp. 185–210). New York: Wiley.
Ferligoj, A., & Hlebec, V. (1999). Evaluation of Social Network Measurement Instruments.
Social Networks, 21, 111–130.
Fox, J. A., & Tracy, P. E. (1986). Randomized Response. A Method for Sensitive Surveys
(Vol. 07-058). Newbury Park: Sage.
Ganster, D. C., Hennessey, H. W., & Luthans, F. (1983). Social Desirability Response Ef-fects: Three Alternative Models. Academy of Management Journal, 26(2), 321–331. Glynn, A. N. (2013). What Can We Learn with Statistical Truth Serum? Design and
Analy-sis of the List Experiment. Public Opinion Quarterly, 77(Special Issue), 159–172. Grant, T., Moon, R., & Gleason, S. A. (2014). Asking Many, Many Sensitive Questions: A
Person-Count Method for Social Desirability Bias: Unpublished Manuscript. Hoffmann, A., & Musch, J. (2016). Assessing the Validity of two Indirect Questioning
Tech-niques: A Stachastic Lie Detector Versus the Crosswise Model. Behavior Research Methods, 48(3), 1032–1046.
Huckfeldt, R., & Sprague, J. (1995). Citizens, Politics, and Social Communication. Informa-tion and Influence in an ElecInforma-tion Campaign. New York: Cambridge University Press. Hyman, H. (1944). Do They Tell the Truth? Public Opinion Quarterly, 8(4), 557–559. Imai, K. (2011). Multivariate Regression Analysis for the Item Count Technique. Journal of
the American Statistical Association, 106(494), 407–416.
Janus, A. L. (2010). The Influence of Social Desirability Pressures on Expressed Immigra-tion Attitudes. Social Science Quarterly, 91(4), 928–946.
Junkermann, J. (2018). Die Person Sum Technique. Ein neues Instrument zur Erhebung quantitativer heikler Items. University of Mainz.
Kandel, D. B. (1978). Homophily, Selection, and Socialization in Adolescent Friendships.
American Journal of Sociology, 84(2), 427–436.
Krumpal, I. (2012). Estimating the Prevalence of Xenophobia and Anti-Semitism in Germa-ny: A Comparison of Randomized Response and Direct Questioning. Social Science Research, 41(6), 1387–1403.
Krumpal, I. (2013). Determinants of Social Desirability Bias in Sensitive Surveys: A Litera-ture Review. Quality & Quantity, 47(4), 2025–2047.
Kuklinski, J. H., Cobb, M. D., & Gilens, M. (1997). Racial Attitudes and the “New South”.
Journal of Politics, 59(2), 323–349.
Lensvelt-Mulders, G. J. L. M. (2008). Surveying Sensitive Topics. In E. D. de Leeuw, J. J. Hox, & D. A. Dillman (Eds.), International Handbook of Survey Methodology (pp. 461–478). New York: Lawrence Erlbaum.
McPherson, M., Smith-Lovin, L., & Cook, J. M. (2001). Birds of a Feather: Homophily in Social Networks. Annual Review of Sociology, 27, 415–444.
Moore, J. C., Stinson, L. L., & Welniak, E. J. (2000). Income Measurement Error in Sur-veys: A Review. Journal of Official Statistics, 16(4), 331–361.
Perry, P. (1979). Certain Problems in Election Survey Methodology. Public Opinion Quar-terly, 43(3), 312–325.
Quillian, L. (1995). Prejudice as a Response to Perceived Group Threat: Population Com-position and Anti-Immigrant and Racial Prejudice in Europe. American Sociological Review, 60(4), 586–611.
Rosenfeld, B., Imai, K., & Shapiro, J. N. (2015). An Empirical Validation Study of Popular Survey Methodologies for Sensitive Questions. American Journal of Political Science, 60(3), 783–802.
Shakya, H. B., Christakis, N. A., & Fowler, J. H. (2017). An Exploratory Comparison of Name Generator Content: Data from Rural India. Social Networks, 48, 157–168. South, S. J., & Felson, R. B. (1990). The Racial Patterning of Rape. Social Forces, 69(1),
71–93.
Stocké, V. (2007). The Interdependence of Determinants for the Strength and Direction of Social Desirability Bias in Racial Attitude Surveys. Journal of Official Statistics, 23(4), 493–514.
Thomas, K., Johann, D., Kritzinger, S., Plescia, C., & Zeglovits, E. (2017). Estimating Sensi-tive Bahavior: The ICT and High-Incidence Electoral Behavior. International Journal of Public Opinion Research, 29(1), 151–171.
Tourangeau, R., & Yan, T. (2007). Sensitive Questions in Surveys. Psychological Bulletin, 133(5), 859–883.
Trappmann, M., Krumpal, I., Kirchner, A., & Jann, B. (2014). Item Sum – A New Technique for Asking Quantitative Sensitive Questions. Journal of Survey Statistics and Method-ology, 2(1), 58–77.
Warner, S. L. (1965). Randomized Response: A Survey Technique for Eliminating Evasive Answer Bias. Journal of the American Statistical Association, 60(309), 63–69. Weesie, J. (1999). sg121: Seemingly Unrelated Estimation and the Cluster-Adjusted
Sand-wich Estimator. Stata Technical Bulletin 52, 34–47.
Weins, C. (2011). Gruppenbedrohung oder Kontakt? Ausländeranteile, Arbeitslosigkeit und Vorurteile in Deutschland. Kölner Zeitschrift für Soziologie und Sozialpsychologie, 63, 481–499.
Wolter, F., & Herold, L. (2018). Testing the Item Sum Technique (IST) to Tackle Social Desir-ability Bias. SAGE Research Methods Cases. http://dx.doi.org/10.4135/9781526441928 Wolter, F., & Laier, B. (2014). The Effectiveness of the Item Count Technique in Eliciting
Valid Answers to Sensitive Questions. An Evaluation in the Context of Self-Reported Delinquency. Survey Research Methods, 8(3), 153–168.
Wolter, F., & Preisendörfer, P. (2013). Asking Sensitive Questions: An Evaluation of the Randomized Response Technique versus Direct Questioning Using Individual Valida-tion Data. Sociological Methods and Research, 42(3), 321–353.
Yan, T., Curtin, R., & Jans, M. (2010). Trends in Income Nonresponse Over Two Decades.
Journal of Official Statistics, 26(1), 145–164.