Alignment-free classification of COI DNA barcode data with the
Python package Alfie
Cameron M. Nugent
1,2,
Sarah J. Adamowicz
1,21 Department of Integrative Biology, University of Guelph, Guelph, Ontario, Canada 2 Biodiversity Institute of Ontario, University of Guelph, Guelph, Ontario, Canada
Corresponding author: Cameron M. Nugent ([email protected]); Sarah J. Adamowicz ([email protected])
Academic editor: Florian Leese | Received 24 June 2020 | Accepted 27 August 2020 | Published 10 September 2020
Abstract
Characterization of biodiversity from environmental DNA samples and bulk metabarcoding data is hampered by off-target sequenc-es that can confound conclusions about a taxonomic group of intersequenc-est. Existing methods for isolation of target sequencsequenc-es rely on alignment to existing reference barcodes, but this can bias results against novel genetic variants. Effectively parsing targeted DNA barcode data from off-target noise improves the quality of biodiversity estimates and biological conclusions by limiting subsequent analyses to a relevant subset of available data. Here, we present Alfie, a Python package for the alignment-free classification of cytochrome c oxidase subunit I (COI) DNA barcode sequences to taxonomic kingdoms. The package determines k-mer frequencies of DNA sequences, and the frequencies serve as input for a neural network classifier that was trained and tested using ~58,000 publicly available COI sequences. The classifier was designed and optimized through a series of tests that allowed for the optimal
set of DNA k-mer features and optimal machine learning algorithm to be selected. The neural network classifier rapidly assigns COI sequences of varying lengths to kingdoms with greater than 99% accuracy and is shown to generalize effectively and make accurate predictions about data from previously unseen taxonomic classes. The package contains an application programming interface that allows the Alfie package’s functionality to be extended to different DNA sequence classification tasks to suit a user’s need, including classification of different genes and barcodes, and classification to different taxonomic levels. Alfie is free and publicly available
through GitHub (https://github.com/CNuge/alfie) and the Python package index (https://pypi.org/project/alfie/).
Key Words
COI, DNA barcoding, eDNA, environmental DNA, machine learning, metabarcoding, neural network
Introduction
Biodiversity is declining across the globe. Millions of species face the threat of extinction, and ecosystems are being irreversibly altered due to loss of biomass and changes in species composition (Barnosky et al. 2011;
Ceballos et al. 2015). To maintain the health of
ecosys-tems and curb biodiversity loss, informed conservation
and management practices are required. Achievement of
conservation goals is limited by a lack of fundamental information about species composition for many of the
world’s ecosystems. It is therefore imperative that
tech-nological solutions are developed to enable the accurate
and efficient characterization of the world’s biodiversity,
so that existing species can be catalogued, and informed conservation strategies can be developed to protect the
planet’s ecosystems.
The field of DNA barcoding offers a technological
solution to the problem of taxonomically classifying organismal specimens (Hebert et al. 2003). Instead of
relying on laborious and error-prone phenotypic classi-fications, sequence diversity within standardized gene regions is used to enable both specimen identification
and species discovery (Hebert et al. 2003; Ratnasingham
and Hebert 2007; Hubert and Hanner 2015). The field
has advanced from the barcoding of single specimens to the bulk analysis of samples (Hajibabaei et al. 2011,
as metabarcoding, as well as multi-marker (Stefanni et al. 2018) and metagenomics approaches (Cuvelier et al. 2010). These methods have been applied in environmen-tal biomonitoring, where multiple species are identified
at once through the collection of environmental DNA
(eDNA) (Taberlet et al. 2012a). Despite the widespread adoption of these techniques, a fundamental problem
persists: the accurate and repeatable characterization of
biodiversity from eDNA and bulk-sample metabarcoding data is difficult, and conclusions drawn from analyses are strongly affected by methodological decisions (Clare et al. 2016; Braukmann et al. 2019).
Environmental biomonitoring often aims to answer
ecological questions through the targeted examination
of a taxonomic group of interest. DNA barcodes from
a group of focus are targeted using group-specific PCR
primers for one or more selected marker genes in the
PCR amplification step that precedes high-throughput sequencing (Braukmann et al. 2019; Wilson et al. 2019).
Some commonly used primers are overly general, which
results in the amplification of non-target barcodes, in-troducing noise into data and confounding efforts to
characterize true species composition for targeted tax -onomic groups (Brandon-Mong et al. 2015; Zinger et al. 2019). The characterization of biodiversity can be further confounded by intra-group PCR bias, where
the over representation of certain taxa within the target group can result in other taxa being overlooked due to
poorer amplification and sequencing coverage (Elbrecht and Leese 2015).
Shotgun sequencing of eDNA overcomes the primer
issues of eDNA metabarcoding but also produces sub -stantial sequencing noise and sequences from
non-stan-dardized genomic regions (Stat et al.2017; Wilson et al. 2019). A trade-off therefore exists; shotgun sequencing overcomes the amplification bias associated with PCR, but the majority of shotgun sequencing outputs cannot be assigned even high-level taxonomic classifications with confidence (Stat et al.2017; Singer et al. 2020). Despite
present technical limitations, eDNA shotgun sequenc-ing and other next-generation biomonitorsequenc-ing techniques
are seeing increased adoption thanks to their potential to characterize biodiversity more broadly (Makiola et
al. 2020). Within this next generation of biomonitoring methodologies, tools leveraging machine-learning
algo-rithms and available data will be essential to overcoming the limitations associated with existing methods (Cordier
et al. 2019).
The detection of the presence and abundance of species from a specific group is hampered by off-target barcodes that are amplified and sequenced in metabarcoding analy-sis. Traditionally, the characterization of biodiversity via
metabarcoding samples was dependent on the alignment
of sequences against a pre-defined set of reference bar-codes via methods such as BLAST (Altschul et al. 1990). This method of isolating sequences of interest was lim-ited by the pairwise comparison of novel sequences to all reference entries, which is inefficient when query or
reference datasets are large, and is biased against nov
-el genetic variants not present in the reference set. More
efficient means of classifying metabarcoding sequences have been developed (Wang et al. 2007; Bengtsson et al. 2011; Weitschek et al. 2014; Bengtsson-Palme et al. 2015), such as Metaxa2, which relies on the comparison of query sequences against pre-trained hidden Markov
models (HMMs), which serve as probabilistic represen -tations of sequences from different taxonomic groups (Bengtsson-Palme et al. 2015). This allows for more ef-ficient classification of sequences, as query sequences do not need to be aligned to each reference sequence
individ-ually and only need to be evaluated against a much small
-er set of HMMs (each of which represents a multiple
sequence alignment of numerous reference sequences). This reduces the number of pairwise sequence compar-isons required for taxonomic assignment.
Alignment-free methods have been widely applied in biological sequence annotation and classification prob-lems (Abnousi et al. 2016; Zielezinski et al. 2019; Cordier et al. 2018). Alignment-free comparison is defined as any method of quantifying sequence similarity that does not
produce an alignment; these methods are generally less
computationally intensive and can be as effective as con-ventional alignments (Bonham-Carter et al. 2014; Zielez-inski et al. 2019). To compare sequences without align-ment, features must be extracted from sequences in order
to characterize their structure. One common set of align -ment-free features is DNA k-mer counts, where the num-ber of occurrences of fixed-length DNA words of length
k are quantified (Vinga and Almeida 2003; Crusoe et al. 2015). These features can be used as inputs for machine learning models trained to predict classifications such as the taxonomic designation associated with sequences (So-lis-Reyes et al. 2018). Machine learning models that
oper-ate on k-mer input features have previously been applied in DNA barcode sequence classification and other predic-tive tasks (Kuksa and Pavlovic 2009; Langenkämper et al. 2014; Ainsworth et al. 2017; Cordier et al. 2017). The application of these tools is often limited to specific tax-onomic classification tasks (Kuksa and Pavlovic 2009), or they rely on user-provided sets of sequence data for model training (Langenkämper et al. 2014).
The goals of this study were to develop a high-level alignment-free taxonomic classification tool for metabar-coding and environmental DNA marker gene data. This tool was initially designed for the kingdom-level classifi-cation of barcode sequences from the most common
ani-mal barcode, a region of the mitochondrial cytochrome c
oxidase subunit I (COI) gene. To achieve this, we explored different feature sets (k-mer sizes) and machine learning
algorithms to determine the optimal machine learning
architecture for alignment-free barcode classification. To make the tool accessible to other researchers, we de-veloped the Python package Alfie. Within Alfie, we also developed an application programming interface (API) to
taxonom-ic group of interest. Alfie is free and publtaxonom-icly available
through GitHub (https://github.com/CNuge/alfie) and the
Python package index (https://pypi.org/project/alfie/).
Methods
Data acquisition
The Barcode of Life Data system (BOLD) (Ratnasing-ham and Hebert 2007) was queried to obtain all publicly available sequences for the DNA barcode: cytochrome c
oxidase subunit I (COI) (https://github.com/CNuge/da -ta-alfie). Sequences were filtered to ensure a minimum length of 300 base pairs (bp). The five kingdom-level classifications used by the BOLD database (Animal, Bac-teria and Archaea, Fungi, Plant, Protist) were maintained and utilized as the labels in subsequent classifier develop-ment. As a result of BOLD’s mandate to catalogue animal biodiversity, the database displays a significant sampling bias towards the animal kingdom. To ensure that mod-els could be trained effectively and not be biased towards animal classification, down sampling of the animal data
was performed to ensure more even representation of
sequences among kingdoms. Stratified sampling of ani-mal sequences was performed to obtain a representative subsample of 0.2% of the total set of sequences available (sequences were sampled proportionally on the taxonom-ic level: class; a sample size of 0.2% was chosen as this yielded a set of animal sequences roughly equal to the
kingdom with the second highest number of available
COI barcodes, plants) (Table 1). To train models to be robust to variable data quality and barcode sequence cov-erage, each individual barcode sequence was randomly
subsampled, with a 200–600 base pair subsection of the complete barcode being retained at random and subse -quently utilized in model training and testing.
Prior to splitting the data into a train and test set, a
validation set was created to provide a stringent test of the
final models’ ability to make external predictions. From
each kingdom, a complete taxonomic class was withheld to create the validation set and simulate rare or previously
unseen sequences that the classification algorithms saw no examples of during training. The class withheld from
each kingdom was chosen manually, with selection being based on the distribution of barcodes across the taxonom
-ic classes of the given kingdom. Barcode distribution was
variable across kingdoms, so no suitable rule-based
se-lection method was found. Classes with intermediate rep
-resentation levels within their kingdom were chosen to
provide good sample sizes for subsequent classification
tests without grossly detracting from the size of available training data. For the protist kingdom, two classes were selected for inclusion in the validation set due to small
intra-class barcode counts. The composition of the final validation set is described in Table 2. After the validation
set was withheld, the remaining data were randomly split
into a train and test (stratified split on level: kingdom), with 80% of the data comprising the training set, and the other 20% being withheld as the test set composed of a taxonomically diverse set of sequences (Table 2; Suppl.
material 1: File S1).
Feature set evaluation – k-mer size
Following the train-test split, different sets of align-ment-free features were generated, and the accuracy of kingdom-level classifications by the resulting models was tested. For barcode sequences in the training set, k-mer frequencies were generated for values of k from 1 to 6.
K-mer frequencies (count of a given k-mer divided
by the total number of k-mers counted in a given
bar-code) were used as model inputs, so as to standardize the scale of input values and also ensure the models were
robust to input sequences of different lengths. For each
k-mer feature set, deep neural networks with five hidden neuron layers were trained and evaluated through 5-fold
cross validation (neural networks implemented using the
package Tensorflow Version 2.1.0, Abadi et al. 2016). The choice of deep neural network-based classifiers with five hidden neuron layers was based on
explorato-ry data analysis and preliminaexplorato-ry model construction that
showed this architecture to produce effective classifiers. The number of neurons in the hidden layers of the neu-Table 1. The numbers of COI barcode sequences obtained from
BOLD for each kingdom and the number of sequences retained within different data sets used in development of the Alfie pack-age. The raw barcode counts represent the complete set of pub-licly available sequences for the given kingdom. The ‘Barcodes utilized’ column is the total number of sequences used in the analysis for the given kingdoms after filtering based on mini-mum sequence length and down sampling to decrease imbal-anced representation of the different kingdoms. The breakdown of these sequences between the train, test, and validation data
sets is also shown.
Kingdom Raw barcode
count Barcodes utilized Train data set size Test data set size Validation data set size (see Table 2) Animal 1,137,552 23,493 18,189 4,547 757
Bacteria
and Archaea 5,565 5,547 4,380 1,095 72
Fungi 1,407 1,368 1,038 260 70
Plant 22,638 22,599 18,017 4,505 77
Protist 5,029 5,026 4,014 1,003 9
Total 1,172,191 58,033 45,638 11,410 985
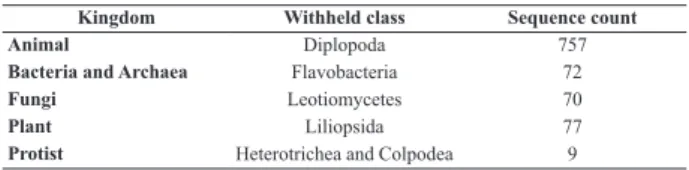
Table 2. The taxonomic breakdown of the validation data set. For each kingdom, a taxonomic class with a near-average num-ber of sequences in the kingdom’s whole data set was chosen for
exclusion from the training set and inclusion in the validation
data set. The names of the taxonomic classes and the numbers of barcode sequences withheld from training and testing for subse-quent validation are shown.
Kingdom Withheld class Sequence count
Animal Diplopoda 757
Bacteria and Archaea Flavobacteria 72
Fungi Leotiomycetes 70
Plant Liliopsida 77
ral network were adjusted according to the size of the
input feature set (Table 3). The 5-fold loss and accuracy metrics for the neural networks with different k-mer in-puts were compared via a one-factor analysis of variance (ANOVA) to determine if there were significant differ-ences in classification accuracy for different feature sets
(k-mer sizes) and to select an optimal value of k for fur
-ther model testing.
Algorithm evaluation
After selection of the optimal k-mer size, five different machine learning models were fit using the training set
and optimized through a grid search of hyperparameters.
Five classification algorithms were utilized: k nearest
neighbour (KNN), support vector machine (SVM),
ran-dom forest (RF), extreme gradient boosting (XGB), and deep neural network (DNN). All models were deployed
using the Python programming language (Version 3.7.4). The KNN, SVM, and RF models were implemented using the package scikit-learn (Version 0.21.3, Pedregosa et al.
2011), the XGB model was implemented using the pack -age XGBoost (Version 0.90, Chen and Guestrin 2016), and the DNN was implemented using the package Tensorflow (Version 2.1.0, Abadi et al. 2016). In order to select
opti-mal hyperparameters and optimize performance, for each
algorithm a grid search was performed using scikit-learn’s GridSearchCV function to train a series of models on the training data set using 5-fold cross validation (Suppl.
ma-terial 2: File S2). Optimal hyperparameters were selected
based on the highest classification accuracy. For the DNN, a custom grid search script was used, with 5-fold cross val-idation and several potential values for each of the models’
respective hyperparameters (Suppl. material 3: File S3). Following the selection of optimal hyperparameter sets
through the grid searches, a final version of each model
was trained using the optimal set of hyperparameters and the complete training data set. Final trained models were then used to make predictions for the previously withheld
test and validation sets (Tables 1, 2). Predicted
classifica-tions were compared to true values to determine the mod -el with the highest classification accuracy. A single opti-mal alignment-free kingdom-level classifier was selected for inclusion in the Alfie package based on the accuracy
of predictions made on the test and validation data, and confusion matrices were prepared to examine rates of
misclassification and taxonomic bias. Several secondary classifier characteristics were also considered to ensure model reusability. Specifically, the file size of the trained models and the time required to make predictions were quantified to ensure that the package’s memory and time requirements were not prohibitive. The Alfie package was
then constructed to allow for the model to be reused in external analyses.
Results and discussion
K-mer size
The cross-validation accuracy scores for the different
neural networks and corresponding k-mer feature sets
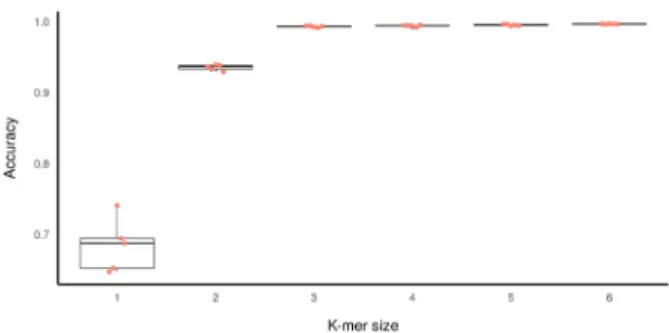
were compared to determine an optimal k-mer feature size. The results showed that the accuracy of models
improved with increasing k-mer feature size, with
di-minishing improvements beyond k = 3 (Table 3; Fig-ure 1). A one-factor ANOVA revealed the differences to be significant (p < 2e-16, F statistic = 318.3, DF1,2 =
5, 24), and a subsequent Tukey’s HSD test showed the
accuracy of both k = 1 and k = 2 to differ significantly
from all larger values of k but no significant differences
in the performance of pairwise comparisons between
k 3–6. A final k value of 4 was selected for subsequent tests, due to the insignificant differences between the
values of k = 3 to k = 6 and the conservative choice to select a k-mer size one larger than the apparent minimal effective feature set.
Table 3. The architectures of the neural networks tested in con-junction with the different k-mer feature sets. For each k-mer
feature set and corresponding neural network, the average loss
and accuracy scores from 5-fold cross validation on the train-ing data (Table 1) are presented. Each neural network was
comprised of a dense input layer (neuron number = number
of unique k-mers, or 4k), five hidden layers of neurons (neuron
counts for each layer given in table), and a dense output layer
(neuron size equal to number of classes). The input and hidden layers utilized a rectified linear unit (relu) activation function (Agarap 2018), and the hidden layers had dropout rates of 0.3. The final output layer utilized a softmax activation function, and
the models were trained using an Adam optimizer (Kingma and Ba 2014), minimizing sparse categorical cross entropy.
K-mer size NN hidden layers sizes Average accuracy Average loss
1 [4,64,128,32,16] 0.684 0.899
2 [16,64,128,64,16] 0.935 0.216
3 [64,128,64,32,16] 0.993 0.038
4 [256,128,64,32,16] 0.994 0.033
5 [1024,512,256,64,16] 0.995 0.047
6 [2080,1040,520,260,130] 0.997 0.023
Figure 1. Boxplot of the 5-fold cross validation accuracy re-sults for the training of models of different k-mer feature sets
and corresponding neural network architectures on the training
data (Table 1). Each dot represents an accuracy score for one of the individual folds in the cross-validation corresponding to the
Training and validation
For each of the machine learning algorithms, a grid search was used to obtain an optimal hyperparameter set (Suppl. material 3:File S3). Final models were trained using the complete training data set and then used to make predic -tions for the test and validation sets (Tables 1, 3).
Per-formance on the test data (withheld barcodes from taxo
-nomic groups otherwise represented in the training data)
was strong for all models, with the lowest classification accuracy exceeding 98% (RF) and all other models ex-ceeding 99.5% accuracy (Table 3). All models made less accurate kingdom-level predictions on the validation data
(barcodes from taxonomic classes that were completely
withheld during training) (Table 4). The accuracy of
pre-dictions on the validation data was variable across mod
-els. On the validation data, the accuracy score of the RF
model was 0.861, and accuracy for the KNN model was 0.927, indicating poorer generalization for these methods to previously unseen data. Each of the DNN, SVM, and XGB models had accuracy > 97% on the validation data, and the most accurate model was the DNN (0.976 on the validation data, Table 4).
Final model
The DNN (operating on 4-mer input features) was select-ed as the final default kingdom-level classification mod-el for the Alfie package. The DNN provided the highest
accuracy on the validation data, as well as high accuracy on the test dataset. Examination of confusion matrices for
the test (Table 5) and validation (Table 6) data showed a
relatively even distribution of errors across the kingdoms,
and no evidence of bias among the classes. These results indicated that the model was not likely to be over fit to the training data and that it was able to generalize
effec-tively and make predictions about data from previously
unseen taxonomic classes. This generalizability of the
model to rare or unseen taxa is an important feature that
indicates the Alfie package can likely be used effective-ly in the anaeffective-lysis of under-studied environments where
uncharacterized biodiversity is more likely to be present.
The 4-mer DNN’s high accuracy on the test and valida-tion data indicated that the model can effectively capture an alignment-free taxonomic signal. The model was
ro-bust to sequences of variable lengths that spanned
vari-ous subsections of the COI barcode region (variable start and stop positions in the COI barcode region, as opposed
to primer-standardized sub-regions). This indicates that the alignment-free classification by Alfie is an effective
method for processing DNA barcoding and metabarcod -ing (specific subsections of the barcode region in a given
study) data, and it may potentially even be applied in the
future in analysis of metagenomics data (non-standard-ized fragments from shotgun sequencing).
Alignment-free model framework
The design and testing of the Alfie package presented here focuses on high-level (kingdom) classification for
the most common animal barcode, COI. However, the Al -fie package provides a robust framework that a user can easily apply to produce and test alignment-free
classifica-tion tools for any taxonomic distincclassifica-tion, DNA barcode, or combination thereof (Suppl. material 4: File S4). As
a kingdom-level classifier, Alfie acts as an effective data filter, allowing the barcode sequences from a kingdom of interest to be separated from the large amount of off-target
noise common in metabarcoding or metagenomics data.
The alignment-free methods can be reapplied to further
home in on taxonomic targets; for example, using pub
-licly available data ( https://github.com/CNuge/data-al-fie), a binary classifier can be trained and subsequently deployed with Alfie to allow for any taxonomic group Table 4. The accuracy scores for the predictions made by the
five different machine learning models (trained on 4-mer fre-quency features and the complete training data set (Table 1)). Accuracy on the test (Table 1) and validation (Table 2) data sets
are shown.
Algorithm Test accuracy Validation accuracy
DNN 0.996 0.976
Support Vector Machine 0.996 0.974
K Nearest Neighbors 0.997 0.927
Random Forest 0.983 0.861
XGBoost 0.998 0.972
Table 5. Confusion matrix for predictions on the test set (Ta-ble 1) by the final model selected for inclusion in the Alfie package (4-mer DNN, test accuracy = 0.996, validation accu-racy = 0.976). The row labels are the true classifications of the sequences (as reported by BOLD) and the column labels are the classifications made by the Alfie package. For example, the value in the fifth column of the first row (4) is the number of true animal sequences that were incorrectly classified as protist sequences by the model, while the value in the first column of the first row (4537) is the number of true animal sequences cor-rectly classified as animal by the model.
Animal Bacteria and Archaea Fungi Plant Protist
Animal 4537 0 1 5 4
Bacteria and Archaea 0 1094 0 1 0
Fungi 6 4 240 9 1
Plant 0 1 1 4500 3
Protist 0 1 0 4 998
Table 6. Confusion matrix for predictions on the validation set
(Table 2) by the final model selected for inclusion in the Alfie package (4-mer DNN, test accuracy = 0.996, validation accu-racy = 0.976). The row labels are the true classifications of the sequences (as reported by BOLD) and the column labels are the classifications made by the Alfie package.
Animal Bacteria and Archaea Fungi Plant Protist
Animal 744 0 0 2 0
Bacteria and Archaea 0 59 0 6 7
Fungi 1 1 65 3 0
Plant 0 0 0 77 0
of interest to be separated from a complete set of COI
metabarcoding sequences. Using other publicly available data (i.e. Pruesse et al. 2007; Banchi et al. 2020), the same custom model construction and training tools in Alfie can be used to construct binary or multiclass alignment-free classification tools for other DNA barcodes or genes.
Although the Alfie package is an effective align-ment-free classification framework at high taxonomic levels, traditional alignments are likely more effective for lower-level classification tasks (i.e. classification to genus or species level). The k-mer frequency method used by Alfie is not likely to be effective for resolving differences between closely related species with more subtle genetic differences than those seen at higher
taxo-nomic levels. Similarly, for taxotaxo-nomic groups with few representatives and no closely related outgroups, avail
-able training data may be scant, providing a limitation in training of DNNs or other machine learning models
which rely on abundant training data. The integration of alignment-based and alignment-free methods for biolog-ical sequence classification has been shown to leverage
the strengths of the individual approaches to yield an ef -ficient and accurate classification method (Borozan et al. 2015). This hybrid methodology has been utilized within other DNA classification tools such as Metaxa2, which utilizes a fast HMM-based model to conduct high-lev-el filtration of sequences and then rhigh-lev-elies on traditional alignment for finer-scale classification of sequences (Bengtsson‐Palme et al. 2015).
A similar hybrid approach using the Alfie package for filtration of sequences and subsequent alignment of sequences for a group of interest can narrow the scope
of the application of alignment methods and thereby im -prove both analysis speed and accuracy. The Alfie pack-age’s API allows a user to extend the package to other classification tasks, as functionality is not limited to pre-defined default models or datasets (Suppl. material 4: File S4). The alignment-free model construction frame-work of Alfie can allow for multiple models to be trained
with relative ease and applied in conjunction with one an -other to isolate barcode sequences of interest from large and messy inputs such as metagenomics data. We propose that effective models could likely be trained and applied to: (a) separate sequences from key mitochondrial genes from other sequences, (b) assign sequences to a barcode or gene of origin, (c) conduct kingdom-level classifica-tion for different barcode genes, and (d) conduct
classifi-cation at intermediate taxonomic levels (i.e. for phylum,
class, or order assignment, when sufficient training data
are available). Based upon the taxonomic signal we de
-tected, we project that this could likely be accomplished
using the same 4-mer frequency data and would allow for messy inputs to be filtered and categorized. Processing
of metagenomics data in this manner would allow subse -quent alignment effort to be more strategically targeted,
improving analysis speed and accuracy. Future compar -ative study and benchmarking of the Alfie package rel-ative to existing alignment and model-based
classifica-tion tools can reveal which methods (or combinaclassifica-tions of
methods) are most effective in different circumstances, such as classification for: metagenomics data, different barcodes, different taxonomic levels, or when differing amounts of reference sequences are available.
Conclusions
We have developed and tested the Python package Alfie,
which extracts k-mer features and uses a neural network to make kingdom-level classifications of COI DNA bar-code fragments with greater than 99% accuracy. The Al-fie package can therefore be used to separate barcode data for a kingdom of interest from off-target noise, narrowing the scope of subsequent analyses to only relevant data. The model is robust to full-length barcodes and short se-quence fragments and is therefore an effective classifier for use in both barcode and metabarcoding analyses. The Alfie package can be incorporated into broader analyses pipelines (Elbrecht et al. 2018; Cordier et al. 2019) and paired with tools that conduct quality control (Callahan et
al.2016; Nugent et al.2020) and taxonomic annotation (Altschul et al.1990; Wang et al. 2007) to characterize biodiversity from large and complex data sets. The default model of Alfie is limited to kingdom-level classification
for the most common animal barcode, COI. Researchers
may expand upon this narrow scope to fit custom research needs by using the training module of Alfie. This allows Alfie to be applied in different taxonomic classification tasks or for the classification of data from different DNA barcodes (where labelled training data are available). The generalized and customized nature of the Alfie package will allow for it to adapt along with the field of
biodiversi-ty genomics. As metagenomics becomes more prevalent,
the Alfie package can be expanded with additional default
models for tasks such as the isolation of mitochondrial
DNA or sequences from specific mitochondrial genes from large, messy shotgun sequencing datasets.
Acknowledgements
Thank you to Tyler A. Elliott for assisting in the acqui-sition of data from the BOLD database. Thank you to
Christopher A. Hempel for helpful discussions during the
initial conceptualization and design of the Alfie package. Thank you to Christopher A. Hempel, Rami Baghdan,
and Nora Samhadaneh for feedback on the initial draft of the manuscript.
Funding for this research was obtained from grants in Bioinformatics and Computational Biology from Genome Canada through Ontario Genomics and from the Ontario Ministry of Economic Development, Job
Creation and Trade. Funders played no role in study design or decision to publish. This research was enabled
References
Abadi M, Barham P, Chen J, Chen Z, Davis A, Dean J, Devin M, Ghe-mawat S, Irving G, Isard M, Kudlur M (2016) Tensorflow: A system for large-scale machine learning. In 12th {USENIX} Symposium
on Operating Systems Design and Implementation ({OSDI} 16) 265–283.
Abnousi A, Broschat SL, Kalyanaraman A (2016) A fast alignment-free approach for de novo detection of protein conserved regions. PLoS ONE 11(8): e0161338. https://doi.org/10.1371/journal.
pone.0161338
Agarap AF (2018) Deep learning using rectified linear units (relu). arX-iv preprint arXarX-iv:1803.08375.
Altschul SF, Gish W, Miller W, Myers EW, Lipman DJ (1990) Basic local alignment search tool. Journal of Molecular Biology 215(3): 403–410. https://doi.org/10.1016/S0022-2836(05)80360-2
Ainsworth D, Sternberg MJ, Raczy C, Butcher SA (2017) k-SLAM: accurate and ultra-fast taxonomic classification and gene identifica-tion for large metagenomic data sets. Nucleic Acids Research 45(4): 1649–1656. https://doi.org/10.1093/nar/gkw1248
Banchi E, Ametrano CG, Greco S, Stanković D, Muggia L, Pallavi-cini A (2020) PLANiTS: a curated sequence reference dataset for plant ITS DNA metabarcoding. Database. https://doi.org/10.1093/ database/baz155
Barnosky AD, Matzke N, Tomiya S, Wogan GO, Swartz B, Quental TB, Marshall C, McGuire JL, Lindsey EL, Maguire KC, Mersey B (2011) Has the Earth’s sixth mass extinction already arrived?. Na-ture 471(7336): 51–57. https://doi.org/10.1038/nature09678
Bengtsson J, Eriksson KM, Hartmann M, Wang Z, Shenoy BD, Grelet GA, Abarenkov K, Petri A, Rosenblad MA, Nilsson RH (2011) Metaxa: a software tool for automated detection and discrimina -tion among ribosomal small subunit (12S/16S/18S) sequences of archaea, bacteria, eukaryotes, mitochondria, and chloroplasts in metagenomes and environmental sequencing datasets. Antonie Van Leeuwenhoek 100(3): 471. https://doi.org/10.1007/s10482-011-9598-6
Bengtsson‐Palme J, Hartmann M, Eriksson KM, Pal C, Thorell K, Lars-son DG, NilsLars-son RH (2015) METAXA2: improved identification and taxonomic classification of small and large subunit rRNA in metagenomic data. Molecular Ecology Resources (6): 1403–1414.
https://doi.org/10.1111/1755-0998.12399
Bonham-Carter O, Steele J, Bastola D (2014) Alignment-free genet-ic sequence comparisons: a review of recent approaches by word analysis. Briefings in Bioinformatics 15(6): 890–905. https://doi.
org/10.1093/bib/bbt052
Borozan I, Watt S, Ferretti V (2015) Integrating alignment-based and alignment-free sequence similarity measures for biological se-quence classification. Bioinformatics 31(9): 1396–1404. https://doi.
org/10.1093/bioinformatics/btv006
Braukmann TW, Ivanova NV, Prosser SW, Elbrecht V, Steinke D, Ratnasingham S, de Waard JR, Sones JE, Zakharov EV, Hebert PD (2019) Metabarcoding a diverse arthropod mock commu-nity. Molecular Ecology Resources 19(3): 711–727. https://doi.
org/10.1111/1755-0998.13008
Brandon-Mong GJ, Gan HM, Sing KW, Lee PS, Lim PE, Wilson JJ (2015) DNA metabarcoding of insects and allies: an evaluation of primers and pipelines. Bulletin of Entomological Research 105(6): 717–727. https://doi.org/10.1017/S0007485315000681
Callahan BJ, McMurdie PJ, Rosen MJ, Han AW, Johnson AJA, Holmes SP (2016) DADA2: high-resolution sample inference from Illu-mina amplicon data. Nature Methods 13(7): 581–583. https://doi.
org/10.1038/nmeth.3869
Ceballos G, Ehrlich, PR, Barnosky AD, García A, Pringle RM, Palmer TM (2015) Accelerated modern human-induced species losses: En-tering the sixth mass extinction. Science advances 1(5): e1400253.
https://doi.org/10.1126/sciadv.1400253
Chen T, Guestrin C (2016) Xgboost: A scalable tree boosting system. In Proceedings of the 22nd acm sigkdd international conference on
knowledge discovery and data mining 2016, 785–794. https://doi.
org/10.1145/2939672.2939785
Cordier T, Esling P, Lejzerowicz F, Visco J, Ouadahi A, Martins C, Ced-hagen T, Pawlowski J (2017) Predicting the ecological quality status of marine environments from eDNA metabarcoding data using su -pervised machine learning. Environmental Science & Technology 51(16): 9118–9126. https://doi.org/10.1021/acs.est.7b01518
Cordier T, Forster D, Dufresne Y, Martins CIM, Stoeck T, Pawlows-ki J (2018) Supervised machine learning outperforms taxono-my-based environmental DNA metabarcoding applied to biomoni-toring. Molecular Ecology Resources 18(6): 1381–1391. https://doi.
org/10.1111/1755-0998.12926
Cordier T, Lanzén A, Apothéloz-Perret-Gentil L, Stoeck T, Pawlowski J (2019) Embracing environmental genomics and machine learning for routine biomonitoring. Trends in Microbiology 27(5): 387–397.
https://doi.org/10.1016/j.tim.2018.10.012
Clare EL, Chain FJ, Littlefair JE, Cristescu ME (2016) The effects of parameter choice on defining molecular operational taxonomic units and resulting ecological analyses of metabarcoding data. Genome 59(11): 981–990. https://doi.org/10.1139/gen-2015-0184
Cristescu ME (2014) From barcoding single individuals to metabarcod -ing biological communities: towards an integrative approach to the study of global biodiversity. Trends in Ecology & Evolution 29(10): 566–571. https://doi.org/10.1016/j.tree.2014.08.001
Crusoe MR, Alameldin HF, Awad S, Boucher E, Caldwell A, Cartwright R, Charbonneau A, Constantinides B, Edvenson G, Fay S, Fenton J (2015) The khmer software package: enabling efficient nucleo-tide sequence analysis. F1000Research 4. https://doi.org/10.12688/ f1000research.6924.1
Cuvelier ML, Allen AE, Monier A, McCrow JP, Messié M, Tringe SG, Woyke T, Welsh RM, Ishoey T, Lee JH, Binder BJ (2010) Targeted metagenomics and ecology of globally important uncultured eukary -otic phytoplankton. Proceedings of the National Academy of Sci-ences of the USA 107(33): 14679–14684. https://doi.org/10.1073/
pnas.1001665107
Elbrecht V, Leese F (2015) Can DNA-based ecosystem assessments quantify species abundance? Testing primer bias and biomass-se-quence relationships with an innovative metabarcoding proto-col. PLoS ONE 10(7): e0130324. https://doi.org/10.1371/journal. pone.0130324
Elbrecht V, Vamos EE, Steinke D, Leese F (2018) Estimating intraspe-cific genetic diversity from community DNA Metabarcoding Data. PeerJ 6: e4644. https://doi.org/10.7717/peerj.4644
Hajibabaei M, Shokralla S, Zhou X, Singer GA, Baird DJ (2011) En-vironmental barcoding: a next-generation sequencing approach for biomonitoring applications using river benthos. PLoS ONE 6(4): e17497. https://doi.org/10.1371/journal.pone.0017497
are reconnecting biodiversity science and biomonitoring. Philo-sophical Transactions of the Royal Society B: Biological Sciences 371(1702): 20150330. https://doi.org/10.1098/rstb.2015.0330
Hebert PDN, Cywinska A, Ball SL, Dewaard JR (2003) Biological identifications through DNA barcodes. Proceedings of the Royal So-ciety of London. Series B: Biological Sciences 270(1512): 313–321.
https://doi.org/10.1098/rspb.2002.2218
Hubert N, Hanner R (2015) DNA barcoding, species delineation and taxonomy: a historical perspective. DNA Barcodes 3(1): 44–58.
https://doi.org/10.1515/dna-2015-0006
Kingma DP, Ba J (2014) Adam: A method for stochastic optimization. arXiv preprint arXiv:1412.6980.
Kuksa P, Pavlovic V (2009) Efficient alignment-free DNA barcode an-alytics. BMC Bioinformatics 10: S9. https://doi.org/10.1186/1471-2105-10-S14-S9
Langenkämper D, Goesmann A, Nattkemper TW (2014) Ake-the accel-erated k-mer exploration web-tool for rapid taxonomic classifica-tion and visualizaclassifica-tion. BMC Bioinformatics 15(1): 384. https://doi.
org/10.1186/s12859-014-0384-0
Makiola A, Compson ZG, Baird DJ, Barnes MA, Boerlijst SP, Bouchez A, Brennan G, Bush A, Canard E, Cordier T, Creer S (2020) Key questions for next-generation biomonitoring. Frontiers in Environ-mental Science. https://doi.org/10.3389/fenvs.2019.00197
Nugent CM, Elliott TA, Ratnasingham S, Adamowicz SJ (2020) Coil: an R package for cytochrome C oxidase I (COI) DNA barcode data cleaning, translation, and error evaluation. Genome 63(6): 291–305.
https://doi.org/10.1139/gen-2019-0206
Pedregosa F, Varoquaux G, Gramfort A, Michel V, Thirion B, Grisel O, Blondel M, Prettenhofer P, Weiss R, Dubourg V, Vanderplas J (2011) Scikit-learn: Machine learning in Python. Journal of Machine Learning Research 12: 2825–2830.
Pruesse E, Quast C, Knittel K, Fuchs BM, Ludwig W, Peplies J, Glöck-ner FO (2007) SILVA: a comprehensive online resource for quali-ty checked and aligned ribosomal RNA sequence data compatible with ARB. Nucleic Acids Research 35(21): 7188–7196. https://doi.
org/10.1093/nar/gkm864
Ratnasingham S, Hebert PDN (2007) BOLD: The Barcode of Life Data System (http://www. barcodinglife.org). Molecular Ecology Notes. 7(3): 355–364. https://doi.org/10.1111/j.1471-8286.2007.01678.x
Singer GA, Shekarriz S, McCarthy A, Fahner N, Hajibabaei M (2020) The utility of a metagenomics approach for marine biomonitoring. bioRxiv. https://doi.org/10.1101/2020.03.16.993667
Solis-Reyes S, Avino M, Poon A, Kari L (2018) An open-source k-mer based machine learning tool for fast and accurate subtyping of HIV-1 genomes. PLoS ONE HIV-13(HIV-1HIV-1): e0206409. https://doi.org/10.1371/
journal.pone.0206409
Stat M, Huggett MJ, Bernasconi R, DiBattista JD, Berry TE, Newman SJ, Harvey ES, Bunce M (2017) Ecosystem biomonitoring with eDNA: metabarcoding across the tree of life in a tropical marine environment. Scientific Reports 7(1): 1. https://doi.org/10.1038/ s41598-017-12501-5
Stefanni S, Stanković D, Borme D, de Olazabal A, Juretić T, Pallavicini A, Tirelli V (2018) Multi-marker metabarcoding approach to study mesozooplankton at basin scale. Scientific Reports 8(1): 3. https://
doi.org/10.1038/s41598-018-30157-7
Taberlet P, Coissac E, Hajibabaei M, Rieseberg LH (2012a) Environ-mental DNA. Molecular Ecology 21(8): 1789–1793. https://doi.
org/10.1111/j.1365-294X.2012.05542.x
Taberlet P, Coissac E, Pompanon F, Brochmann C, Willerslev E (2012b) Towards next‐generation biodiversity assessment using DNA me-tabarcoding. Molecular Ecology 21(8): 2045–2050. https://doi.
org/10.1111/j.1365-294X.2012.05470.x
Vinga S, Almeida J (2003) Alignment-free sequence comparison-a re-view. Bioinformatics 19(4): 513–523. https://doi.org/10.1093/bioin-formatics/btg005
Wang Q, Garrity GM, Tiedje JM, Cole JR (2007) Naive Bayesian clas-sifier for rapid assignment of rRNA sequences into the new bac-terial taxonomy. Applied and Environmental Microbiology 73(16): 5261–5267. https://doi.org/10.1128/AEM.00062-07
Weitschek E, Fiscon G, Felici G (2014) Supervised DNA Barcodes spe-cies classification: analysis, comparisons and results. BioData Min-ing 7(1): 4. https://doi.org/10.1186/1756-0381-7-4
Wilson JJ, Brandon-Mong GJ, Gan HM, Sing KW (2019) High-through-put terrestrial biodiversity assessments: mitochondrial metabarcod -ing, metagenomics or metatranscriptomics? Mitochondrial DNA Part A 30(1): 60–67. https://doi.org/10.1080/24701394.2018.1455189
Zielezinski A, Girgis HZ, Bernard G, Leimeister CA, Tang K, Dencker T, Lau AK, Röhling S, Choi JJ, Waterman MS, Comin M (2019) Benchmarking of alignment-free sequence comparison methods. Genome Biology 20(1): 144. https://doi.org/10.1186/s13059-019-1755-7
Zinger L, Bonin A, Alsos IG, Bálint M, Bik H, Boyer F, Chariton AA, Creer S, Coissac E, Deagle BE, De Barba M (2019) DNA metabar-coding-Need for robust experimental designs to draw sound ecolog-ical conclusions. Molecular Ecology 28(8): 1857–1862. https://doi.
org/10.1111/mec.15060
Supplementary material 1
File S1 – Training, test, and validation data sets used in model training and analysis
Authors: Cameron M. Nugent, Sarah J. Adamowicz Data type: source code
Copyright notice: This dataset is made available under the
Open Database License (http://opendatacommons.org/licens
-es/odbl/1.0/). The Open Database License (ODbL) is a license
agreement intended to allow users to freely share, modify, and use this Dataset while maintaining this same freedom for oth
-ers, provided that the original source and author(s) are credited. Link: https://doi.org/10.3897/mbmg.4.55815.suppl1
Supplementary material 2
File S2 – Python script for custom grid search of hyperpa-rameters for optimization of the neural network
Authors: Cameron M. Nugent, Sarah J. Adamowicz Data type: source code
Copyright notice: This dataset is made available under the
Open Database License (http://opendatacommons.org/licens
-es/odbl/1.0/). The Open Database License (ODbL) is a license
agreement intended to allow users to freely share, modify, and use this Dataset while maintaining this same freedom for oth
Supplementary material 3
File S3 – The parameters utilized in the grid search for each of the five machine learning algorithms tested in the design of the Alfie package
Authors: Cameron M. Nugent, Sarah J. Adamowicz Data type: source code
Copyright notice: This dataset is made available under the
Open Database License (http://opendatacommons.org/li
-censes/odbl/1.0/). The Open Database License (ODbL) is a
license agreement intended to allow users to freely share, modify, and use this Dataset while maintaining this same freedom for others, provided that the original source and au
-thor(s) are credited.
Link: https://doi.org/10.3897/mbmg.4.55815.suppl3
Supplementary material 4
File S4 – Jupyter notebook with tutorial demonstrating how to apply the Alfie classifier in the Python programming lan -guage, and how to train custom alignment-free classifiers using the Alfie training module
Authors: Cameron M. Nugent, Sarah J. Adamowicz Data type: source code
Copyright notice: This dataset is made available under the
Open Database License (http://opendatacommons.org/licens
-es/odbl/1.0/). The Open Database License (ODbL) is a license
agreement intended to allow users to freely share, modify, and use this Dataset while maintaining this same freedom for oth