Data Exploration at the Exascale
Hank Childs1c
The Author 2017. This paper is published with open access at SuperFri.org
In situ processing — i.e., coupling visualization routines to a simulation code to generate images in real-time — is predicted to be the dominant form for visualization on upcoming super-computers. Unfortunately, traditionalin situtechniques are largely incongruent with exploratory visualization, which is an important activity to enable understanding of simulation data. In re-sponse, a new paradigm is emerging: data is transformed and massively reducedin situand then the resulting form is exploredpost hoc. The fundamental tension in this approach is between the extent of the data reduction and the loss in integrity in the resulting data. However, new oppor-tunities, in terms of increased access to data, may blunt this tension and allow for both sufficient data reduction and also more accurate analysis. With this paper, we describe the trends behind “data exploration at the exascale” and also summarize some recent results that confirmed that this new paradigm can produce superior results compared to the traditional one.
Keywords: scientific visualization, high-performance computing, Lagrangian flow analysis.
Introduction
This paper describes the fundamental challenges behind “data exploration at the exascale,” the strategy behind the proposed solution, and some recent evidence that supports the merits of this strategy. It is organized as follows:
• Section 1 provides background. Specifically, Section 1.1 describes the high-performance
computing trends that will compel the usage ofin situ processing and Section 1.2 describes
the importance of data exploration and why the traditional approach for this exploration
is incongruent with in situ processing.
• Section 2 gives an overview of the new paradigm for achieving data exploration with in
situ.
• Section 3 describes a success story using this new paradigm. One of the main lessons from
this example is that increased access to data can lead to more accurate analysis and also reduced storage costs.
1. Background
1.1. In Situ
The justification for in situ [6] is discussed extensively in the Report for the DOE ASCR
2011 Workshop on Exascale Data Management, Analysis, and Visualization [2]: the ability to
generate data is going up much faster than the ability to store it, with the limitations in storage being both in I/O bandwidth and in power costs due to data movement. This summary presented here focuses mostly on the I/O costs, as the the I/O subsystem is undergoing a significant change on upcoming supercomputers.
As supercomputers get ever larger, the cost of achieving sufficient I/O bandwidth is, un-surprisingly, increasing. But supercomputing architects have been experimenting with a new approach to decrease this cost. Where the typical approach has a simulation write data directly to a parallel file system (i.e., “spinning disk”), the new approach introduces an additional par-ticipant, solid state drives (SSDs) and has the simulation write data to the SSDs instead. The
simulation can then immediately resume, while, concurrently, the data is copied from the SSDs to the file system, shielding the simulation from slow parallel file system performance. Although the SSDs introduce a new cost, they lessen the importance of I/O bandwidth, allowing for the SSDs to be coupled with a slower (and less expensive) parallel file system, providing an overall cost reduction.
To applications, this I/O configuration appears to have two distinct bandwidth characteris-tics. On write, the bandwidth appears to be good, since it is be accelerated by SSDs. On read, however, the bandwidth will be poor, since the reads are backed by a slower parallel file system and the presence of SSDs can not accelerate this activity.
The write performance on exascale machines, relative to data size, is expected to be compa-rable to that of petascale machines (taking into accounts SSDs). But the read performance will be at least one order of magnitude less. Further, as shown in [7], I/O is already the bottleneck on massive data sets. As a result, the I/O bottleneck will be even more extreme at the exascale for visualization programs that attempt to load data at its full resolution.
As a result of these trends, in situ processing has become increasingly popular with many
successful usages in recent years [8, 12, 14, 17, 20]. Further, an additional advantage of in situ
processing is that it can access all of the simulation data, which has never previously been
possible with post hoc analysis. Phrased another way, where supercomputing trends are leading
simulations to store data less often, in situ processing allows for dramatic increases in temporal
frequency, equal to that accessible in the simulation code itself.
1.2. Data Exploration
Bergeron argued in [4] that visualization and analysis usage falls into three categories: de-scriptive, analytical, and exploratory. Bergeron defined descriptive visualization as useful “when the phenomena represented in the data is known, but the user needs to present a clear visual verification of this phenomenon (usually to others).” He described analytical visualization (or directed search) as “the process we follow when we know what we are looking for in the data.” Finally, he defined exploratory visualization (or undirected search) as the process we follow when “we do not know what we are looking for; visualization may help us understand the nature of the data by demonstrating patterns in that data.”
Descriptive and analytical use cases can often benefit from a priori knowledge, making them ideal for in situ processing. But exploratory visualization can not benefit from a priori knowledge: it is for when “we do not know what we are looking for.”
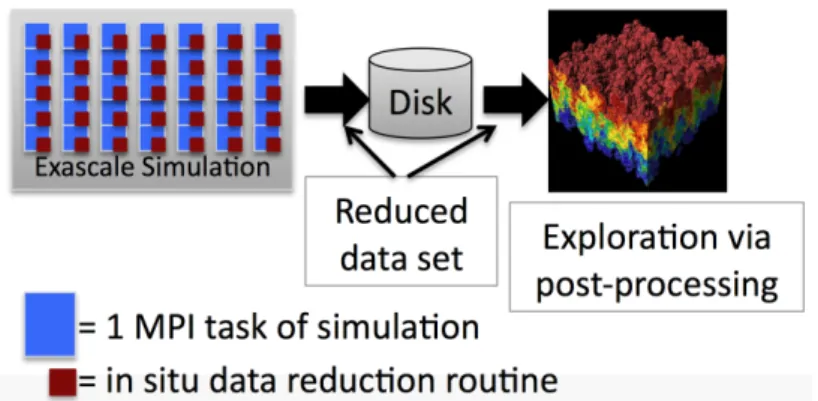
2. New Paradigm: In Situ Reduction and Post Hoc Exploration
The new paradigm resembles the traditional post hoc model, in that the simulation writes
data to disk and stand-alone programs visualize this data by reading it from disk. However, the
new paradigm introduces a key new step to this model: it substantially reduces the data using in
situ processing before writing it to disk(see fig. 1). With enough reduction, the amount of data
to store forpost hoc processing can become tractable, although actual sizes that are “tractable”
will depend on the details of each individual supercomputer.
Figure 1. The new paradigm for exploring exascale simulation data viain situ transformation
and reduction and post hoc analysis
Of course, the goals of data reduction and data integrity are in tension. Thinking of a simple compression scheme, too much reduction can sacrifice data integrity, while requiring high data integrity often leaves opportunities for only minimal reduction. So our community must perform significant research to find techniques that balance these tensions. Further, we must constrain ourselves to only considering reduction operators that are viable in an exascale setting.
This new paradigm will represent a significant change for users. Users often distrust any reduction in data; many users believe the integrity of their data can only be preserved if it is displayed or analyzed at its full and native resolution. But this desire is not realistic for exascale computing. I/O and power limitations will restrict how much data can be read in and how much can be stored for subsequent analysis. Given these limitations, users will not be able to continue with “business as usual.” This new paradigm is responsive to the fundamental issues, but, ultimately, users will need to accept tradeoffs and guide how decisions are made. Further, significant research is needed to enable users to make informed decisions, e.g., “this level of data integrity comes at the cost of this much time, storage, and power.”
More and more research has been devoted to this new paradigm in recent years [11, 15, 16, 18, 19]. A particularly noteworthy research result in this space is ParaView Cinema [3]. With
this work, the in situ reduction comes from extracting many explorable images, and the post
hoc exploration is on these images, often in forms that feel interactive for users.
In the following section, we present another research result following this new paradigm, specifically targeting flow visualization. This research result is somewhat different from the
other results described previously, in that it makes use of the opportunity provided by in situ
processing to access more data than ever before, enabling it to create more accurate answers
3. Lagrangian Flow
Doing flow analysis with Lagrangian flow is a relatively new concept for visualization. So, this section begins with an overview of the traditional method for flow analysis (Eulerian flow) in Section 3.1, for the sake of comparison. Section 3.2 then describes the new, Lagrangian method, and Section 3.3 describes results, contrasting them with the traditional method.
3.1. Traditional Method
Particle advection — calculating the trajectory a massless particle follows in a flow field — is foundational for many flow visualization and analysis techniques. McLouglin et al. recently surveyed the state of the art in flow visualization [13], and the large majority of techniques they described, such as line integral convolution [5], finite-time Lyapunov exponents [9], and streamsurfaces [10], depended on advection. Advection assumes access to a vector field, i.e., a
continuous function over a four-dimensional domain. Ifx is the spatial location of a point andt
is a time, then the vector fieldv maps the tuple (x, t) to its velocity asv(x, t).
Advection constructs integral curves, which are continuous functions tangential to the vector field. Each integral curve is called a pathline, and it encodes the trajectory of a single mass-less
particle. The path of an integral curve I is the solution to an ordinary differential equation, and
is represented as:
d
dtI(t) =v(I(t), t) (1)
where I(t0) =x0, for a seed point at timet0 and locationx0.
For some approaches, visualization techniques focus on the special case of stationary flows which vector fields do not vary over time (“steady state”). With this research, the focus was on the general case: transient flows, where the vector fields are time-varying (“unsteady state”).
The traditional method for calculating particle trajectories is not particularly well-suited
to exploratory analysis. With post hoc analysis, simulations write time slices of data to disk
and then this time slice data is explored afterwards. But solving the advection equation requires evaluating the velocity field at many temporal locations. Oftentimes, the necessary time locations are not the ones saved out, so the visualization program instead does a temporal interpolation. This temporal interpolation introduces an error, making the particle follow the wrong trajectory.
Further, the increased access provided by in situ processing cannot be leveraged by this model
when doing data exploration — since the required particles are not known ahead of time, the necessary velocity evaluations cannot be performed, and so the only data that can be used is
the time slice data stored for traditional post hoc processing.
3.2. Lagrangian Method
Agranovsky et al. [1] explored the Lagrangian approach in the context ofin situ reduction
andpost hoc exploration (i.e., the new paradigm described in Section 2). Thein situ
transforma-tion and reductransforma-tion operator placed “basis” particles in the Eulerian vector field and calculated their corresponding trajectories. The storage costs were proportional to the number of particles, so storage reductions could be achieved by limiting the number of these particles. Critically, unlike the traditional/Eulerian method, the Lagrangian method made use of all spatio-temporal data, specifically when calculating the trajectories that their “basis” particles followed. As a result, the spatio-temporal data was encoded into the trajectories, and so subsequent explo-ration — which happened by interpolating between trajectories — was able to make use of the spatio-temporal data.
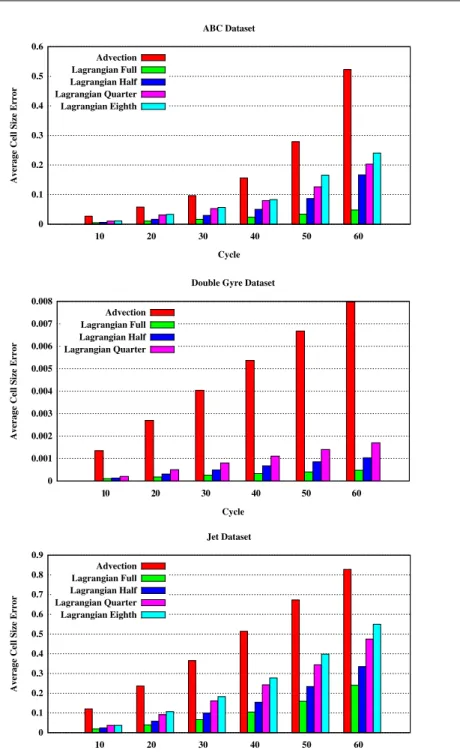
3.3. Experiments
Here, we describe experiments comparing Lagrangian and Eulerian techniques. The results presented extend the previous study done by Agranovsky et al.
Three data sets were considered:
• Arnold-Beltrami-Childress (ABC): A three-dimensional analytic vector field from
dynam-ical systems theory, on a regular grid of dimensions 256×256×256 with 3000 time steps.
• Double Gyre: A common two-dimensional benchmark of two counter-rotating gyres with
perturbations over time, on a regular grid of dimensions 512×256 with 3000 time steps.
• Jet: A three-dimensional simulation of a high-speed jet entering a medium at rest, on a
regular grid of dimensions 260×520×260 with 2000 time steps.
Although the frequency a simulation saves state can vary based on many factors, our exper-iments made the simplifying assumption that a simulation would save at regular intervals, i.e.,
“every Nth cycle.” We then considered six different scenarios for how often the simulation code
saved state: 10, 20, 30, 40, 50, and 60 cycles. We refer to the rate a simulation saves its data as the “storage frequency.”
For a given data set and a given storage frequency, we calculated the following information:
• Lagrangian basis trajectories. Particles were placed at even spatial intervals and allowed
to advect for the duration of the storage frequency. The resulting displacement (from start to end) was then saved.
• Eulerian time slices, i.e., traditional vector field information at the current time slice.
• Baseline particles. Particles were placed in the flow and their trajectory was calculated.
These particles, although calculated in the same way as the Lagrangian basis trajectories, were kept separate, to serve as a baseline.
Then we wanted to compare error between the Lagrangian and Eulerian techniques against the baseline particles. We defined an error metric, which was set to be the difference between the calculated end position (whether Lagrangian or Eulerian) versus the actual end position for that baseline particle. The distances were normalized by the scale of the mesh into units of cells of sizes.
0 0.1 0.2 0.3 0.4 0.5 0.6
10 20 30 40 50 60
Average Cell Size Error
Cycle ABC Dataset Advection Lagrangian Full Lagrangian Half Lagrangian Quarter Lagrangian Eighth 0 0.001 0.002 0.003 0.004 0.005 0.006 0.007 0.008
0 0 0 0 0 0
Average Cell Size Error
Cycle Double Gyre Dataset
Advection Lagrangian Full Lagrangian Half Lagrangian Quarter
1 2 3 4 5 6
0 0.1 0.2 0.3 0.4 0.5 0.6 0.7 0.8 0.9
10 20 30 40 50 60
Average Cell Size Error
Cycle Jet Dataset Advection Lagrangian Full Lagrangian Half Lagrangian Quarter Lagrangian Eighth
Figure 2. Comparison of Eulerian and Lagrangian techniques
Summary
The new paradigm of transforming and reducing simulation datain situ and then exploring
datapost hoc has received increased attention for the research community in recent years. This
paradigm appears to be responsive to the fundamental drivers in high-performance computing, and has the potential to retain the important use case of data exploration, which is often the activity that realizes the value of a simulation. Further, the access to increased temporal resolu-tion creates the opportunity to do better analysis than was previously possible. The Lagrangian technique described in this paper shows that the benefits from incorporating increased temporal resolution can be substantial. For this example, the traditional method was unable to take ad-vantage of increased spatio-temporal data, but the new method was — and the increased access led to superior results.
Hank Childs is grateful for the support of the U.S. Department of Energy Early Career Award, Contract No. DE-FG02-13ER26150, Program Manager Lucy Nowell. Further, this work was supported by the Director, Office of Advanced Scientific Computing Research, Office of Science, of the U.S. Department of Energy under Contract No. DE-AC02-05CH11231.
This paper is distributed under the terms of the Creative Commons Attribution-Non Com-mercial 3.0 License which permits non-comCom-mercial use, reproduction and distribution of the work without further permission provided the original work is properly cited.
References
1. Alexy Agranovsky, David Camp, Christoph Garth, E. Wes Bethel, Kenneth I. Joy, and Hank
Childs. Improved Post Hoc Flow Analysis Via Lagrangian Representations. In Proceedings
of the IEEE Symposium on Large Data Visualization and Analysis (LDAV), pages 67–75, Paris, France, November 2014. DOI: 10.1109/ldav.2014.7013206.
2. Sean Ahern, Arie Shoshani, Kwan-Liu Ma, Alok Choudhary, Terence Critchlow, Scott Klasky, Valerio Pascucci, Jim Ahrens, E. Wes Bethel, Hank Childs, Jian Huang, Kenneth I. Joy, Quincey Koziol, Jay Lofstead, Jeremy Meredith, Ken Moreland, George Ostrouchov, Mike Papka, Venkat Vishwanath, Matthew Wold, Nick Wright, and K. John Wu. Scien-tific Discovery at the Exascale: Report for the DOE ASCR Workshop on Exascale Data Management, Analysis, and Visualization, July 2011.
3. James Ahrens, S´ebastien Jourdain, Patrick O’Leary, John Patchett, David H. Rogers, and Mark Petersen. An image-based approach to extreme scale in situ visualization and analysis.
In Proceedings of the International Conference for High Performance Computing,
Network-ing, Storage and Analysis, SC ’14, pages 424–434, Piscataway, NJ, USA, 2014. IEEE Press. DOI: 10.1109/sc.2014.40.
4. David M. Butler, James C. Almond, R. Daniel Bergeron, Ken W. Brodlie, and Robert B.
Haber. Visualization reference models. InProceedings of the 4th conference on Visualization
’93, VIS ’93, pages 337–342, Washington, DC, USA, 1993. IEEE Computer Society.
5. Brian Cabral and Leith Casey Leedom. Imaging vector fields using line integral
convolu-tion. In Proceedings of the 20th Annual Conference on Computer Graphics and
6. Hank Childs, Kwan-Liu Ma, Hongfeng Yu, Brad Whitlock, Jeremy Meredith, Jean Favre, Scott Klasky, Norbert Podhorszki, Karsten Schwan, Matthew Wolf, Manish Parashar, and
Fan Zhang. In Situ Processing. InHigh Performance Visualization—Enabling Extreme-Scale
Scientific Insight, pages 171–198. October 2012. DOI: 10.1201/b12985-12.
7. Hank Childs, David Pugmire, Sean Ahern, Brad Whitlock, Mark Howison, Prabhat, Gunther Weber, and E. Wes Bethel. Extreme Scaling of Production Visualization Software on Diverse
Architectures. IEEE Computer Graphics and Applications (CG&A), 30(3):22–31, May/June
2010. DOI: 10.1109/mcg.2010.51.
8. Nathan Fabian, Kenneth Moreland, David Thompson, Andrew Bauer, Pat Marion, Berk
Geveci, Michel Rasquin, and Kenneth Jansen. The paraview coprocessing library: A
scalable, general purpose in situ visualization library. In Large Data Analysis and
Visualization (LDAV), 2011 IEEE Symposium on, pages 89–96. IEEE, 2011. DOI:
10.1109/ldav.2011.6092322.
9. G. Haller. Distinguished material surfaces and coherent structures in three-dimensional
fluid flows. Physica D: Nonlinear Phenomena, 149(4):248 – 277, 2001. DOI:
10.1016/s0167-2789(00)00199-8.
10. J. P M Hultquist. Constructing stream surfaces in steady 3d vector fields. InVisualization,
1992. Visualization ’92, Proceedings., IEEE Conference on, pages 171–178, Oct 1992. DOI: 10.1109/visual.1992.235211.
11. Henry Lehmann and Bernhard Jung. In-situ multi-resolution and temporal data compression for visual exploration of large-scale scientific simulations. In Hank Childs, Renato Pajarola,
and Venkatram Vishwanath, editors, 4th IEEE Symposium on Large Data Analysis and
Visualization, LDAV 2014, Paris, France, November 9-10, 2014, pages 51–58. IEEE, 2014. DOI: 10.1109/ldav.2014.7013204.
12. Jay F. Lofstead, Scott Klasky, Karsten Schwan, Norbert Podhorszki, and Chen Jin. Flex-ible io and integration for scientific codes through the adaptable io system (adios). In Proceedings of the 6th international workshop on Challenges of large applications in dis-tributed enviro nments, CLADE ’08, pages 15–24, New York, NY, USA, 2008. ACM. DOI: 10.1145/1383529.1383533.
13. Tony McLoughlin, Robert S. Laramee, Ronald Peikert, Frits H. Post, and Min Chen. Over
Two Decades of Integration-Based, Geometric Flow Visualization. In EuroGraphics 2009
-State of the Art Reports, pages 73–92, April 2009.
14. Kenneth Moreland, Ron Oldfield, Pat Marion, Sebastien Jourdain, Norbert Podhorszki, Venkatram Vishwanath, Nathan Fabian, Ciprian Docan, Manish Parashar, Mark Hereld,
et al. Examples of in transit visualization. InProceedings of the 2nd international workshop
on Petascal data analytics: challenges and opportunities, pages 1–6. ACM, 2011. DOI: 10.1145/2110205.2110207.
15. A. Tikhonova, C. Correa, and Kwan-Liu Ma. Visualization by Proxy: A Novel Framework for
Deferred Interaction with Volume Data. IEEE Transactions on Visualization and Computer
Graphics, 16(6):1551–1559, 2010. DOI: 10.1109/tvcg.2010.215.
16. A. Tikhonova, Hongfeng Yu, C. Correa, and Kwan-Liu Ma. A Preview and Exploratory
Sym-17. V. Vishwanath, M. Hereld, and M.E. Papka. Toward simulation-time data analysis and i/o
acceleration on leadership-class systems. InLarge Data Analysis and Visualization (LDAV),
2011 IEEE Symposium on, pages 9–14, 2011. DOI: 10.1109/ldav.2011.6092178.
18. Chaoli Wang, Hongfeng Yu, and Kwan-Liu Ma. Importance-Driven Time-Varying Data
Visualization. IEEE Transactions on Visualization and Computer Graphics, 14(6):1547–
1554, 2008. DOI: 10.1109/tvcg.2008.140.
19. Chaoli Wang, Hongfeng Yu, and Kwan-Liu Ma. Application-Driven Compression for
Visual-izing Large-Scale Time-Varying Data.IEEE Computer Graphics and Applications, 30(1):59–
69, January/February 2010. DOI: 10.1109/mcg.2010.3.
20. Brad Whitlock, Jean M Favre, and Jeremy S Meredith. Parallel in situ coupling of simulation
with a fully featured visualization system. InProceedings of the 11th Eurographics conference
on Parallel Graphics and Visualization, pages 101–109. Eurographics Association, 2011.