1332 | P a g e
State-wise basic amenities among poor households in rural
areas of India
Saroj Kumar Rana
Research Scholar, Desh Bhagat University, Mandi Gobindgarh, Punjab, (India)
ABSTRACT:
Poverty is defined as the position where households is deprived of minimum basic requirements of living..
Poverty is a predominant rural phenomenon, as majority of poor live in rural areas. Rural people regularly face
geographically disadvantage, being in rural area where the access to basic amenities is inadequate.Access to
basic amenities such as decent house, sanitation, drinking water, cooking fuel, electricity and drainage is
necessity for good quality of life on earth. The need for these basic amenities has been world-wide recognised
and has been a major concern in the formulation of policies and programmes in India. While rural households
in India showed gradual improvement in the access to basic amenities, but still continue to face high levels of
deprivation. The objective is based on States-wise availability of basic households amenities and its different
sources among poor households in rural area of India. The present study is based on data collected on the basis
of basic household amenities such as decent house, sanitation, drinking water, cooking fuel, electricity and
drainage in rural poor houses in all states of India extracted from the from the study conducted by NSSO,
Government of India. The study adopted the two-stages sampling for data collection in all states. First stage
sampling, the selection of census village in the rural areas and urban frame survey block in the urban sector. In
second stage, household was selected by using random sampling. Survey covered 65,932 households and
333,104 persons were interviewed all over 36 states of India. The study result revealed that Majority 40.4%
rural house belong self employed in agriculture, by casual labour in agriculture (20.1%), casual labour in
non-agriculture (17.3%), self-employed in non-non-agriculture (12.0%), regular wage/salary earning (6.6%) and other
(3.1%) respectively. 34.6% houses have latrine and Pit (21.3%and septic tank/ flush system (13.3%) were the
main sources of latrine. 49% houses have drainage system and open katcha (30.1%) was the main source. Tap
(27.3%) and tube-well/hand pump (57.0%) were the main sources of water and firewood and chips (82%) was
1333 | P a g e
Keywords:
Availability of types of house, Basic household’s amenities, Improved Latrine, Improved
water, Poor houses
I.INTRODUCTION
The United Nations and its agencies such as the World Health Organisation (WHO), Office of the United
Nations High Commissioner for Human Rights, UN-HABITAT, United Nations Human Rights Programme
(UNHRP), International Committee on Economic Social and Cultural Rights (ICESCR), and International
Labour Organisation (ILO) have highlighted the role and relationship between right to adequate standard of
living and access to adequate housing, water and sanitation
.
Poverty is the root cause of socioeconomicinequality that hinders regional development. Rural poverty is quite a common phenomenon as most of the
populations in rural areas are dependent on agriculture as their prime source of income earning. Poverty is an
extremely complex phenomenon, which manifests itself in a range of overlapping and interwoven economic,
political and social deprivations. Poverty is a state of deprivation and can be defined in term of social
phenomenon where a section of area did not meet even minimum requirements of living [1]. Many study
revealed that households who have a low income may not have the same status as status of the section of
population that is most materially deprived[2-5]. Therefore, income not only criteria to judge the deprivation but
we need addition other factors like housing conditions, sanitation facilities, basic amenities and assets [6]. The
elimination of poverty is not merely a question of economic upliftment but is a social and a political issue
related to the level of the politico-social awareness of people [7]. We agreed that poor does not simply mean not
having more money, moreover generally, a lack of access to resources enabling a minimum style of living and
participation in the society within which one belongs [8]. From the equity perspective every peoples of a India
has same right to live a good life, irrespective of his/her location, caste, gender, religion, occupation etc. But in
reality inequality is a persistent phenomenon in everyday life of people especially those living in developing
countries such as India.Particularly in case of location, the standards of living of people living in rural and urban
location differ widely
.
Rural people regularly face problem in order to access their basic amenities due to theirbeing in rural area, where lacking of resources being found. The deprivation of 3 basic amenities causes the
rural life most vulnerable to insecurities. Lack of proper institutional measures for social security provisions
ensures the continuation of deprivation of the people in the countryside.
The access needs of rural people can be grouped in three broad categories: (i) those associated with basic needs
such as water supply, firewood and food security;(ii) those associated with the social welfare aspects of rural life
such as health and education; (iii) those associated with the economic welfare aspects of rural life such as
agriculture, livestock, cottage industry. Access can be improved in three fundamental and complementary ways:
1334 | P a g e
health centers, markets); and (ii) through improving the mobility of rural people so that they can travel faster,easier, more convenient and less expensive (rural roads, tracks, trails, footbridges, waterways); and (iii) through
promoting and stimulating the use of communication technology so that rural people have improved access to
information related to health, education and market prices (rural telephones, e-mail and internet connections).
For the development of India’s rural areas, the Bharat Nirman (2005) was launched. Under Bharat Nirman
project, action is proposed in the areas of irrigation, road construction (Pradhan Mantri Gram Sadak Yojana),
rural housing (Indira Awaas Yojana), rural water supply, rural electrification (Rajiv Gandhi Grameen
Vidyutikaran Yojana) and rural telecommunication connectivity. There are also programmes of Ministry of
Rural Development, Drinking Water and Sanitation, etc. such as Rajiv Gandhi National Rural Drinking Water
Programme, Total Sanitation Campaign (which is renamed as Nirmal Bharat Abhiyan in May 2012) and others
.
Objective:
States-wise availability of basic households amenities and its different sources among poor households in rural
area of India.
Study design
The present study is based on secondary data source collected by the National Sample Survey Organisation
(NSSO), India.
Data source
The data based on basic households amenities in different states of India and unit level data was extracted from
the 25th schedule of the 71st round of the cross-sectional collected by the National Sample Survey Organization
(NSSO) on ‘Health’ and ‘Education’. NSSO is a national organisation under the Ministry of Statistics In India.
The data was collected in all states of India from January to June 2014.
Methodology
For this study, a stratified two-stage sampling design was adopted. First stage sampling based on the selection of
census village in the rural areas and urban frame survey blocks in the urban sector. In second stage, household
was selected by using random sampling. Survey covered total of 4577 villages and 3720 urban blocks surveyed
from which 36,480 and 29,452 households were sampled in rural and urban areas respectively. Survey covered
65,932 households and 333,104 persons were interviewed all over 36 states of India. The face-to-face interviews
were conducted using an interview schedule, on morbidity (self-reported), utilization of health care services
(including types) and household expenditure on health care.
Data analysis
Data was analysed using SPSS version 21.0 for analysis (SPSS Inc. SPSS Statistics for Windows, Version 21.0.
Chicago). Based on per capita monthly expenditure, all over households is divided in poor and non poor
1335 | P a g e
II.RESULT:
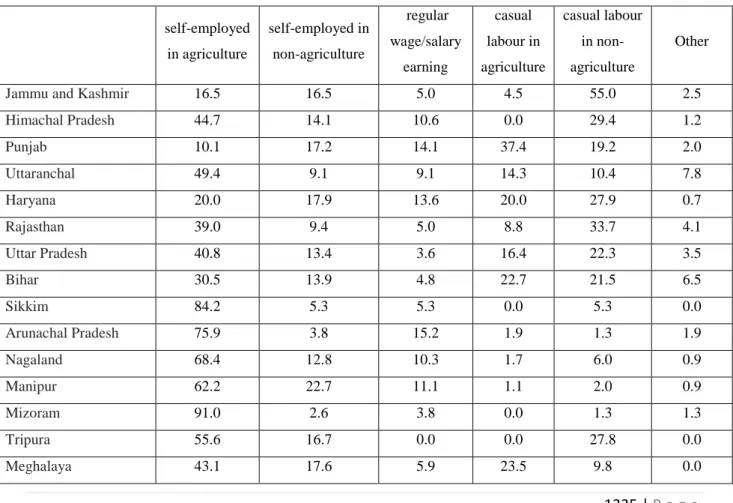
Majority of rural households have self-employed in agriculture (40.4%) followe by casual labour in agriculture
(20.1%), Casual labour in non-agriculture (17.3%), self-employed in non-agriculture (12.0%), regular
wage/salary earning (6.6%) and other (3.1%) respectively. Mizoram (91%), Sikkim (84.2%), Arunachal Pradesh
(75.9%), Nagaland (68.4%) showed more self-employed in agriculture houses, majority of self-employed in
non-agriculture houses found in Manipur (22.7%), Kerala (18.8%), Pondicherry (18.8%) and west Bengal
(18%), majority of regular wage/salary earning houses found in Daman and Diu (100%), Goa (41.7%) and
Lakshadweep (38.9%) and Dadar and Nagar Haveli (28.6%), casual labour in agriculture housed found in
Pondicherry (50%), Andhra Pradesh (45.9%), Punjab (37.4%) and West Bengal (36.8%) respectively, casual
labour in non-agriculture houses found in Dadar and Nagar Haveli (57.1%), Jammu and Kashmir (55%), Kerala
(35.9%), Rajasthan (33.7%) and Himachal Pradesh (29.4%) where as other type of houses found in
Lakshadweep (11.1%), Goa (8.3%), Kerala (7.8%) and Uttaranchal (7.8%) respectively (Table 1).
Table 1: Availability of types of house in poor households in India
self-employed
in agriculture
self-employed in
non-agriculture
regular
wage/salary
earning
casual
labour in
agriculture
casual labour
in
non-agriculture
Other
Jammu and Kashmir 16.5 16.5 5.0 4.5 55.0 2.5
Himachal Pradesh 44.7 14.1 10.6 0.0 29.4 1.2
Punjab 10.1 17.2 14.1 37.4 19.2 2.0
Uttaranchal 49.4 9.1 9.1 14.3 10.4 7.8
Haryana 20.0 17.9 13.6 20.0 27.9 0.7
Rajasthan 39.0 9.4 5.0 8.8 33.7 4.1
Uttar Pradesh 40.8 13.4 3.6 16.4 22.3 3.5
Bihar 30.5 13.9 4.8 22.7 21.5 6.5
Sikkim 84.2 5.3 5.3 0.0 5.3 0.0
Arunachal Pradesh 75.9 3.8 15.2 1.9 1.3 1.9
Nagaland 68.4 12.8 10.3 1.7 6.0 0.9
Manipur 62.2 22.7 11.1 1.1 2.0 0.9
Mizoram 91.0 2.6 3.8 0.0 1.3 1.3
Tripura 55.6 16.7 0.0 0.0 27.8 0.0
1336 | P a g e
Assam 41.3 12.5 16.6 17.2 10.3 2.2
West Bengal 21.7 18.0 5.3 36.8 12.7 5.6
Jharkhand 48.9 11.4 3.7 5.9 25.1 5.0
Odisha 50.3 11.0 1.5 16.9 16.5 3.7
Chhattisgarh 51.2 4.1 5.1 29.5 8.3 1.8
Madhya Pradesh 37.4 6.4 4.5 32.5 18.5 0.6
Gujarat 32.4 10.8 9.5 29.7 14.2 3.4
Daman and Diu 0.0 0.0 100.0 0.0 0.0 0.0
Dadar and Nagar
Haveli 14.3 0.0 28.6 0.0 57.1 0.0
Maharashtra 38.2 8.6 3.9 36.0 11.1 2.2
Andhra Pradesh 29.7 8.1 5.4 45.9 9.5 1.4
Karnataka 44.7 11.4 5.7 26.1 10.2 1.9
Goa 25.0 8.3 41.7 8.3 8.3 8.3
Lakshadweep 27.8 0.0 38.9 22.2 0.0 11.1
Kerala 15.6 18.8 9.4 12.5 35.9 7.8
Tamil Naidu 18.9 10.1 11.5 30.4 25.7 3.4
Pondicherry 0.0 18.8 18.8 50.0 6.3 6.3
A & N Island 66.7 0.0 5.6 11.1 16.7 0.0
Telengana 44.4 14.8 3.7 27.8 3.7 5.6
India 40.4 12.0 6.6 20.1 17.8 3.1
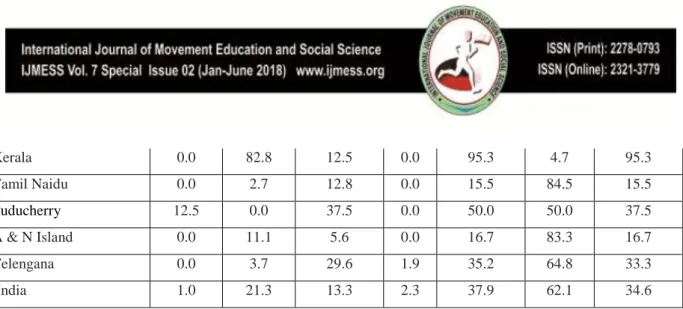
Overall majority of availability of houses in India have Pit(21.3%) and. Septic tank/ Flush system (13.3%)
latrine system. Majority of states showed more 100% availability of latrine in Meghalaya, Nagaland, Daman and
Diu, Sikkim, Lakshadweep and where minimum availability of latrine found in Rajasthan (9.7%), Chhattisgarh
(8.8%), Jharkhand (7.8%), Odisha (6.4%), Dadar and Nagar Haveli (3.6%) respectively. Majorities of states
have latrine services found in Puducherry (12.5%), Arunachal Pradesh (9.5%), Jammu and Kashmir (5%) and
Himachal Pradesh (2.4%), Pit Latrine found in Tripura (94.4%), Kerala (82.8), Lakshadweep (77.8%), Manipur
(76.4%) and Mizoram (73.1%) respectively. Septic tank/ Flush system found in Daman and Diu (100%),
Himachal Pradesh (57.6%), Nagaland (48.7%), Puducherry (37.5%), other found in Meghalaya (52.9%),
1337 | P a g e
Table 2: Availability of Improve latrine in poor households In India
latrine:
service Pit
septic tank/
flush
system
others Availability of Latrine
No
Latrine
Availability
of Improve
Latrine
Jammu and Kashmir 5.0 49.5 24.0 1.5 80.0 20.0 73.5
Himachal Pradesh 2.4 11.8 57.6 0.0 71.8 28.2 69.4
Punjab 1.0 24.2 37.4 1.0 63.6 36.4 61.6
Uttaranchal 0.0 66.2 11.7 0.0 77.9 22.1 77.9
Haryana 0.7 46.4 11.4 0.0 58.6 41.4 57.9
Rajasthan 0.0 7.3 2.3 0.0 9.7 90.3 9.7
Uttar Pradesh 0.7 6.7 10.5 0.2 18.1 81.9 17.3
Bihar 0.8 8.2 8.6 0.4 18.1 81.9 16.8
Sikkim 0.0 63.2 36.8 0.0 100.0 0.0 100.0
Arunachal Pradesh 9.5 39.2 23.4 22.2 94.3 5.7 62.7
Nagaland 0.0 46.2 48.7 5.1 100.0 0.0 94.9
Manipur 1.7 76.4 16.2 5.1 99.4 0.6 92.6
Mizoram 0.0 73.1 23.1 0.0 96.2 3.8 96.2
Tripura 0.0 94.4 0.0 0.0 94.4 5.6 94.4
Meghalaya 0.0 45.1 2.0 52.9 100.0 0.0 47.1
Assam 0.6 68.8 15.0 12.5 96.9 3.1 83.8
West Bengal 0.3 26.7 9.0 3.2 39.2 60.8 35.7
Jharkhand 0.5 1.4 5.9 0.0 7.8 92.2 7.3
Odisha 0.7 4.4 1.1 0.2 6.4 93.6 5.5
Chhattisgarh 2.3 0.5 6.0 0.0 8.8 91.2 6.5
Madhya Pradesh 0.8 7.0 6.6 0.2 14.6 85.4 13.6
Gujarat 0.0 3.4 14.2 0.0 17.6 82.4 17.6
Daman and Diu 0.0 0.0 100.0 0.0 100.0 0.0 100.0
Dadar and Nagar Haveli 0.0 3.6 0.0 0.0 3.6 96.4 3.6
Maharashtra 0.4 4.7 27.2 0.7 33.0 67.0 31.9
Andhra Pradesh 1.4 4.1 13.5 0.0 18.9 81.1 17.6
Karnataka 0.4 22.0 5.7 0.4 28.4 71.6 27.7
Goa 0.0 41.7 16.7 0.0 58.3 41.7 58.3
1338 | P a g e
Kerala 0.0 82.8 12.5 0.0 95.3 4.7 95.3
Tamil Naidu 0.0 2.7 12.8 0.0 15.5 84.5 15.5
Puducherry 12.5 0.0 37.5 0.0 50.0 50.0 37.5
A & N Island 0.0 11.1 5.6 0.0 16.7 83.3 16.7
Telengana 0.0 3.7 29.6 1.9 35.2 64.8 33.3
India 1.0 21.3 13.3 2.3 37.9 62.1 34.6
Overall availability of drainage (49 %) in India and difference type of drainage found as Open kutcha (30.1%),
Open pucca (13.6%), covered pucca (2.9%), underground (2.4%) respectively. Majorities of states showed open
kutcha drainage in Puducherry (87.5%), Meghalaya (76.5%), Sikkim (68.4%), Manipur (63.4%), and Nagaland
(59%) respectively. Open drainage found in Punjab (61.6%), Haryana (55%), Karnataka (29.9%), Telengana
(29.6%) and Nagaland (21.3%), Covered pucca drainage found in Kerala (28.1%), Goa (8.3%), Andhra Pradesh
(8.3%) and Karnataka (77.2%) respectively (Table 3).
Table 3: Availability of drainage in poor households In India
Open
kutcha
Open
pucca
Covered
pucca
Under
Ground
Availability
of Drainage
No
Drainage
Jammu and Kashmir 48.0 14.5 2.5 2.5 67.5 32.5
Himachal Pradesh 45.9 11.8 3.5 2.4 63.5 36.5
Punjab 17.2 61.6 2.0 11.1 91.9 8.1
Uttaranchal 32.5 15.6 1.3 0.0 49.4 50.6
Haryana 32.9 55.0 1.4 1.4 90.7 9.3
Rajasthan 16.1 7.0 2.1 0.9 26.1 73.9
Uttar Pradesh 41.8 20.2 6.9 5.8 74.6 25.4
Bihar 42.5 9.1 1.5 0.6 53.7 46.3
Sikkim 68.4 5.3 0.0 0.0 73.7 26.3
Arunachal Pradesh 33.5 7.6 1.3 0.0 42.4 57.6
Nagaland 59.0 29.1 2.6 0.0 90.6 9.4
Manipur 63.4 21.3 0.0 0.0 84.7 15.3
Mizoram 37.2 1.3 0.0 0.0 38.5 61.5
Tripura 5.6 0.0 5.6 0.0 11.1 88.9
Meghalaya 76.5 2.0 2.0 0.0 80.4 19.6
1339 | P a g e
West Bengal 8.7 1.9 0.3 0.5 11.4 88.6
Jharkhand 16.0 0.9 0.0 1.4 18.3 81.7
Odisha 3.7 0.7 0.9 0.4 5.7 94.3
Chhattisgarh 12.9 6.9 0.5 0.0 20.3 79.7
Madhya Pradesh 38.1 7.6 2.3 0.6 48.6 51.4
Gujarat 1.4 1.4 0.0 14.9 17.6 82.4
Daman and Diu 0.0 0.0 0.0 100.0 100.0 0.0
Dadar and Nagar Haveli 0.0 0.0 0.0 0.0 0.0 100.0
Maharashtra 17.7 21.1 4.3 5.0 48.2 51.8
Andhra Pradesh 23.0 10.8 8.1 5.4 47.3 52.7
Karnataka 28.0 29.9 7.2 1.1 66.3 33.7
Goa 25.0 8.3 8.3 8.3 50.0 50.0
Lakshadweep 0.0 5.6 5.6 0.0 11.1 88.9
Kerala 9.4 4.7 28.1 4.7 46.9 53.1
Tamil Naidu 23.6 16.9 3.4 1.4 45.3 54.7
Puducherry 87.5 12.5 0.0 0.0 100.0 0.0
A & N Island 5.6 0.0 0.0 0.0 5.6 94.4
Telengana 31.5 29.6 1.9 1.9 64.8 35.2
India 30.1 13.6 2.9 2.4 49.0 51.0
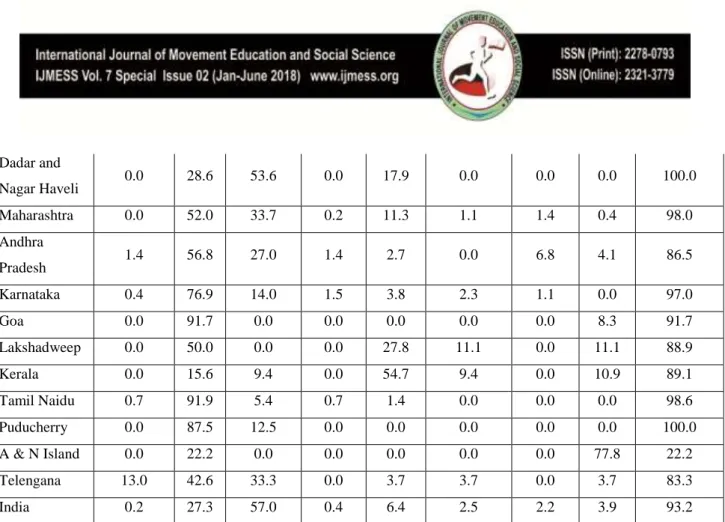
Different type of sources of drinking water in India were found as bottles water (0.2%), tap (27.3%),
tube-well/hand pump (57%), tanker (0.4%), pucca well (6.4%), tank/ pond reserved for drinking (2.5%), river/canal
(2.2%) and river (3.9%) respectively. With in state, bottle water sources shown in Telengana (13%), Andhra Pradesh (1.4%), Tamil Naidu (0.7%) and Rajasthan (0.6%) where as remaining states showed almost zero
proportion, Tap sources of drinking water is showed maximum proportion in Daman and Diu (100%), Tamil Naidu (91.9%), Goa (91.7%), Sikkim (89.5% and Puducherry (87.5%), tube-well/hand pump found in Bihar (97.9%), Uttar Pradesh (93.2%), Odisha (86.2%), west Bengal (85.4%) and Chhattisgarh (82%), Tanker found in Haryana (3.6%), Gujarat (3.4%), Karnataka (1.5%), Andhra Pradesh (1.2%) and Himachal Pradesh (1.2%),
pucca well found in Kerala (54.7%), Lakshadweep (27.8%), Jharkhand (21.5%), Madhya Pradesh (17.9%) and Dadar and Nagar Haveli (17.9%), tank/ pond reserved for drinking found in Nagaland (38.5%), Meghalaya (23.5%), Mizoram (16.7%), Manipur (16.5%) and Lakshadweep (11.1%). River/Canal found in Mizoram
(43.6%),Manipur (14.8%), Andhra Pradesh (6.8%), Jammu and Kashmir (5.5%). Other sources found in A & N Island (77.8%), Mizoram (33.3%), Manipur (31%), Meghalaya (21.6%) and Uttaranchal (15.6%) respectively
1340 | P a g e
Table 4 : Availability of different source of drinking water and improve water in poor
households in India
Bottled
water Tap
Tube-well/hand
pump
Tankers Pucca well
Tank/ pond
reserved
for
drinking
River/
canal Others
Availability
of Improve
water
Jammu and
Kashmir 0.0 77.0 6.5 0.0 0.5 1.0 5.5 9.5 85.0
Himachal
Pradesh 0.0 84.7 3.5 1.2 3.5 0.0 0.0 7.1 91.8
Punjab 0.0 46.5 51.5 0.0 0.0 0.0 0.0 2.0 98.0
Uttaranchal 0.0 62.3 19.5 0.0 0.0 1.3 1.3 15.6 83.1
Haryana 0.0 62.1 30.7 3.6 2.9 0.0 0.0 0.7 95.7
Rajasthan 0.6 23.2 58.9 0.9 11.1 3.5 1.2 0.6 96.8
Uttar Pradesh 0.1 4.8 93.2 0.0 1.6 0.1 0.1 0.2 99.6
Bihar 0.0 0.2 97.9 0.2 1.7 0.0 0.0 0.0 99.8
Sikkim 0.0 89.5 0.0 0.0 0.0 0.0 0.0 10.5 89.5
Arunachal
Pradesh 0.0 65.8 25.9 0.0 0.0 0.0 0.6 7.6 91.8
Nagaland 0.0 45.3 8.5 0.0 7.7 38.5 0.0 0.0 100.0
Manipur 0.3 32.1 4.3 0.3 0.9 16.5 14.8 31.0 53.7
Mizoram 0.0 1.3 3.8 0.0 1.3 16.7 43.6 33.3 23.1
Tripura 0.0 33.3 55.6 0.0 0.0 0.0 0.0 11.1 88.9
Meghalaya 0.0 33.3 17.6 0.0 3.9 23.5 0.0 21.6 78.4
Assam 0.0 4.4 80.3 0.0 5.3 1.3 1.9 6.9 91.3
West Bengal 0.3 10.3 85.4 0.0 4.0 0.0 0.0 0.0 99.7
Jharkhand 0.0 0.9 75.8 0.5 21.5 0.0 0.9 0.5 98.2
Odisha 0.0 7.0 86.2 0.2 4.2 0.0 2.4 0.0 97.4
Chhattisgarh 0.0 8.3 82.0 0.0 8.3 0.5 0.9 0.0 99.1
Madhya
Pradesh 0.2 9.3 70.0 0.0 17.9 0.0 1.9 0.8 97.1
Gujarat 0.0 59.5 27.0 3.4 10.1 0.0 0.0 0.0 96.6
Daman and
1341 | P a g e
Dadar andNagar Haveli 0.0 28.6 53.6 0.0 17.9 0.0 0.0 0.0 100.0
Maharashtra 0.0 52.0 33.7 0.2 11.3 1.1 1.4 0.4 98.0
Andhra
Pradesh 1.4 56.8 27.0 1.4 2.7 0.0 6.8 4.1 86.5
Karnataka 0.4 76.9 14.0 1.5 3.8 2.3 1.1 0.0 97.0
Goa 0.0 91.7 0.0 0.0 0.0 0.0 0.0 8.3 91.7
Lakshadweep 0.0 50.0 0.0 0.0 27.8 11.1 0.0 11.1 88.9
Kerala 0.0 15.6 9.4 0.0 54.7 9.4 0.0 10.9 89.1
Tamil Naidu 0.7 91.9 5.4 0.7 1.4 0.0 0.0 0.0 98.6
Puducherry 0.0 87.5 12.5 0.0 0.0 0.0 0.0 0.0 100.0
A & N Island 0.0 22.2 0.0 0.0 0.0 0.0 0.0 77.8 22.2
Telengana 13.0 42.6 33.3 0.0 3.7 3.7 0.0 3.7 83.3
India 0.2 27.3 57.0 0.4 6.4 2.5 2.2 3.9 93.2
Majority of fuel in rural poor households found was firewood and chips (82%) followed by coke, coal (1.1%),
LPG (6.9%), Gobar Gas (0.3%), Dung cake (8%), Charcoal (0.1%), Kerosene (0.3%) and Electricity and other
each (0.1%) respectively. Within states, different sources of fuel; Coke caol found inJharkhand (8.7%), Assam (6.3%), West Bengal (4%), Telengana (3.7%) and Punjab (1%), firewood and chips found inTripura (100%) , Daman and Diu (100%), Dadar and Nagar Haveli (100%), Rajasthan (97.9%) and Himachal Pradesh (95.3%),
LPG found inPuducherry (43.8%), Goa (33.3%),Tamil Naidu (31.8%),Telengana (22.2%) and Sikkim (21.1%),
Gobar gas found inHaryana (2.1%), Telengana (1.9%),UP (0.8%) and Maharashtra (0.8%), Dung cake found inBihar (28.8%), Punjab (27.3%), UP(26.5%), Haryana (23.6%) and Madhya Pradesh (4.9%), Charcoal found inMeghalaya (3.9%), Kerala (1.6%), Madhya Pradesh (0.8%) and West Bengal (0.3%), Kerosene found in Lakshadweep (11.1%), Nagaland (1.7%), Gujarat (1.4%) and Himachal Pradesh (1.2%), Electricity found in Meghalaya (15.7%), Punjab(1%) and Jammu and Kashmir (0.5%) and Others sources found in West Bengal (9.5%), A & N Island (5.6%), Bihar (4.2%) and UP (1.2% ) respectively (Table 5).
Table 5: Availability of different source of cooking fuel and improve cooking fuel in poor
households in India
coke,
coal
firewood
and
chips
LPG Gobar gas
Dung
cake Charcoal Kerosene Electricity Others
no cooking
arrangement
Improve
fuel
Jammu and
Kashmir 0.0 80.0 19.0 0.0 0.5 0.0 0.0 0.5 0.0 0.0 19.5
1342 | P a g e
Pradesh
Punjab 1.0 60.6 10.1 0.0 27.3 0.0 0.0 1.0 0.0 0.0 11.1
Uttaranchal 0.0 93.5 5.2 0.0 1.3 0.0 0.0 0.0 0.0 0.0 5.2
Haryana 0.0 71.4 2.9 2.1 23.6 0.0 0.0 0.0 0.0 0.0 5.0
Rajasthan 0.3 97.9 1.8 0.0 0.0 0.0 0.0 0.0 0.0 0.0 1.8
Uttar Pradesh 0.9 66.8 3.7 0.8 26.5 0.0 0.1 0.0 1.2 0.0 4.5
Bihar 0.6 63.8 2.1 0.4 28.8 0.0 0.0 0.0 4.2 0.0 2.5
Sikkim 0.0 78.9 21.1 0.0 0.0 0.0 0.0 0.0 0.0 0.0 21.1
Arunachal
Pradesh 0.0 89.9 10.1 0.0 0.0 0.0 0.0 0.0 0.0 0.0 10.1
Nagaland 0.0 82.1 16.2 0.0 0.0 0.0 1.7 0.0 0.0 0.0 16.2
Manipur 0.0 79.8 19.9 0.0 0.0 0.0 0.3 0.0 0.0 0.0 19.9
Mizoram 0.0 82.1 17.9 0.0 0.0 0.0 0.0 0.0 0.0 0.0 17.9
Tripura 0.0 100.0 0.0 0.0 0.0 0.0 0.0 0.0 0.0 0.0 0.0
Meghalaya 0.0 80.4 0.0 0.0 0.0 3.9 0.0 15.7 0.0 0.0 15.7
Assam 6.3 83.1 10.3 0.0 0.0 0.0 0.3 0.0 0.0 0.0 10.3
West Bengal 4.0 80.2 1.3 0.0 3.7 0.3 1.1 0.0 9.5 0.0 1.3
Jharkhand 8.7 90.9 0.0 0.0 0.5 0.0 0.0 0.0 0.0 0.0 0.0
Odisha 0.4 93.8 0.7 0.2 4.0 0.0 0.2 0.0 0.7 0.0 0.9
Chhattisgarh 0.0 94.9 1.8 0.0 3.2 0.0 0.0 0.0 0.0 0.0 1.8
Madhya
Pradesh 0.0 92.6 1.2 0.2 4.9 0.8 0.2 0.0 0.0 0.0 1.4
Gujarat 0.0 91.9 6.1 0.0 0.0 0.0 1.4 0.0 0.0 0.7 6.1
Daman and
Diu 0.0 100.0 0.0 0.0 0.0 0.0 0.0 0.0 0.0 0.0 0.0
Dadar and
Nagar Haveli 0.0 100.0 0.0 0.0 0.0 0.0 0.0 0.0 0.0 0.0 0.0
Maharashtra 0.2 87.8 10.6 0.5 0.0 0.0 0.9 0.0 0.0 0.0 11.1
Andhra
Pradesh 0.0 90.5 9.5 0.0 0.0 0.0 0.0 0.0 0.0 0.0 9.5
Karnataka 0.0 88.3 11.7 0.0 0.0 0.0 0.0 0.0 0.0 0.0 11.7
Goa 0.0 66.7 33.3 0.0 0.0 0.0 0.0 0.0 0.0 0.0 33.3
Lakshadweep 0.0 88.9 0.0 0.0 0.0 0.0 11.1 0.0 0.0 0.0 0.0
1343 | P a g e
Tamil Naidu 0.0 67.6 31.8 0.0 0.0 0.0 0.7 0.0 0.0 0.0 31.8
Puducherry 0.0 56.3 43.8 0.0 0.0 0.0 0.0 0.0 0.0 0.0 43.8
A & N Island 0.0 94.4 0.0 0.0 0.0 0.0 0.0 0.0 5.6 0.0 0.0
Telengana 3.7 72.2 22.2 1.9 0.0 0.0 0.0 0.0 0.0 0.0 24.1
India 1.1 82.0 6.9 0.3 8.0 0.1 0.3 0.1 1.1 0.0 7.4
Overall 49% availability of drainage was found in rural poor households in India. Daman and Diu (100%),
Puduchery (100%), Punjab (91.9%), Haryana (90.7%), Nagaland (90.6%) showed maximum drainage and West
Bengal (11.4%), Tripura (11.1%), Lakshadweep (11.1%), Odisha (5.7%), A&N Island (5.6%), Dadar and Nagar
Hawali (0.0%) showed minimum availability of drainage whereas remaining states showed availability of
drainage between 17.6% and 84.7% (Fig 1).
Fig1: State-wise availability of drainage in India
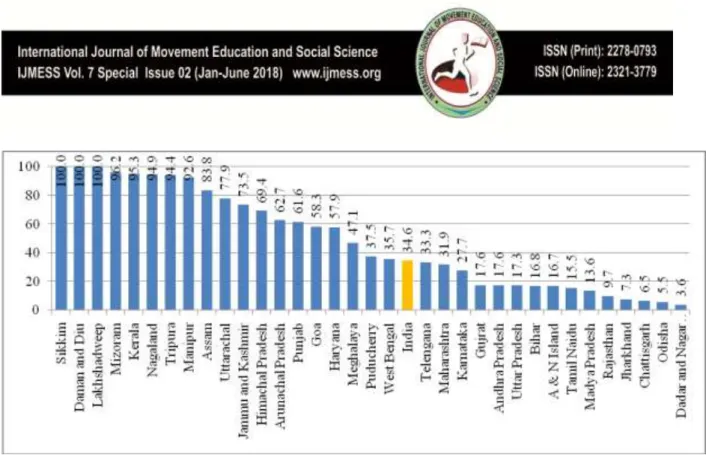
Overall 34.6% availability of improved latrine was seen in rural poor household in India. Sikkim (100%),
Daman and Diu (100%), Lakshadweep (100%) Mizoram (96.2%), Kerala (95.3%), Nagaland (94.9%), Tripura
(94.4%), Manipur (92.6%) showed maximum of availability of improved latrine and Rajasthan (9.7%),
Jharkhand (7.3%), Chhattisgarh (6.5%), Odisha (5.5%) and Dadar and Nagar Hawali (3.6%) showed minimum
of availability of improved latrine whereas remaining states showed availability of improved latrine between
1344 | P a g e
Fig 2: State-wise availability of improve Latrine in India
Overall 93.2% availability of improved water was seen in rural poor household in India. Nagaland (100%),
Daman and Diu (100%), Dadar and Nagar Hawali (100%), Puducherry (100%), Bihar (99.8%) showed
significant of availability of improved water and Manipur (53.71%), Mizoram (23.1%),Rajasthan (9.7%) and
A& N Island (22.2%) showed minimum of availability of improved water whereas remaining states showed
availability of improved latrine between 78.4% and 99.7% (Fig 3).
1345 | P a g e
Overall 7.4% availability of improved cooking fuel was seen in rural poor household in India. Puducherry(43.8%), Goa (33.3%), Tamil Naidu (31.8%), Telengana (24.1%), Sikkim (21.1%) showed significant of
availability of improved cooking fuel and Chhattisgarh (1.8%), Rajasthan (1.8%), Madhya Pradesh (1.4%),West
Bengal(1.3%) and Odisha (0.9%) showed minimum of availability of improved cooking fuel (Fig 4).
Fig 4: State-wise availability of Improve cooking fuel in India
Discussion:
Study reveals that in India 40.4% houses belong to self employed in agriculture, and Mizoram (91%),Sikkim
(84.2%), Arunachal Pradesh (75.9%), Nagaland (68.4%) showed houses belong to self-employed in agriculture.
6.6 % housed found of regular wage/salary earning. This showed that in rural area most of houses belongs to
self employed and casual labour working in agriculture – non agriculture fields.
Overall 34.6% house has availability of latrine system in their houses. 21.3% houses have Pit Latrine and 13.3%
houses have Septic tank/ Flush system. Meghalaya, Nagaland, Daman and Diu, Sikkim, Lakshadweep showed
maximum 100% availability of latrine in their houses. In 2011, of the 30.7% of households with latrine facility
within the premises, 19.4% had water closets and 11.3% had pit and other latrine facilities. Of the 69.3% of
households without latrine facility within the premises in 2011, 1.9% used public latrines and 67.3% used open
defecation [10]. The study revealed that 62.1% rural poor houses have no latrine. The proportion of households
with no latrine facility in the house were 87.3%, 78.3%, 66.4%, and 59.4% during 1993, 2002, 2008-09, and
2012, respectively [11]. The compounded annual rate of decline in the proportion of households with no latrine
facility in the house were found to be 1.1%, 2.6% and 3.0% between 1993-2002, 2002-08-09 and 2008-09-12,
respectively. Overall 49% houses showed availability of open kutcha drainage system in India whereas
1346 | P a g e
system. 93.2 % houses have improved water whereas 27.3% have tap and 57% have Tube-well/hand pump mainsource of water in India. Nagaland (100%), Daman and Diu, Dadar and Nagar Hawali, Puducherry, Bihar
showed significant of availability of improved water. In 2015, 88% of the total population had access to at least
basic water, or 96% in urban areas and 85% in rural areas. In India in 2015, 44% had access to "at least basic
sanitation", or 65% in urban areas and 34% in rural areas. In 2015, there were still 150 million people without
access to "at least basic" water and 708 million without access to "at least basic" sanitation [12]. Only 7.4 %
houses have improve cooking fuel in India and 82% houses have firewood and chips as the main sources of
cooking where as Tripura , Daman and Diu, Dadar and Nagar Haveli, Rajasthan and Himachal Pradesh showed
firewood and chips as the main sources of cooking. Goa, Puducherry,Telengana and Sikkim showed LPG as
source of cooking. According to census 2011 where 12.0% rural houses using LPG gas.The most widely used
cooking fuel remains firewood, used by 72 per cent of households. Dung cakes are the second most common
cooking fuel, used by 39 per cent of households [13].
III.CONCLUSION
Household assets and amenities reflect a households quality of life. Provision of electricity, clean drinking
water, road condition, sanitary condition, health and hygiene, accessibility to cleaner fuel and smokeless stove
for domestic use in households determines the overall development of a region. The position of housing in rural
poor areas mainly belongs to self employed and casual labour in agriculture and non-agriculture. Need to
government to create intension toward the employment in rural area, so that poor uplift from deprivation. Rural
Domestic Cooking Energy with its two components i.e., Improved Chulha and rural Fuelwood Plantation have
helped the rural women in overcoming the problem of non-commercial use of cooking energy. But it has been
found that in our country about half of our population is without safe drinking water. The number of poor
households with amenities like L.P.G connection, toilet facility and drainage system need attention in rural areas
of India.
Acknowledgements
None.
Competing interests
The authors declare that they have no competing interests.
Consent for publication
1347 | P a g e
REFERENCE
1] K.C Singhal, and H.S. Gill,1991, Poverty Per Capita Income and Per Worker Sectoral Incomes, Indian
Journal of Regional Science, Vol.223(2),p.1.
[2] R.Berthoud, M.Bryan, and E.Bardasi,The Relationship Between Income and Material Deprivation Over
Time, Department for Work and Pensions Research Report 219, Corporate Document Services, Leeds,2004.
[3] J.Bradshaw, N.Finch , Overlaps in Dimensions of Poverty, Journals of Social Policy, Vol. 32, pp.
513-25,2003.
[4]T.Callan, B.Nolan, and C.T. Whelan, Resources, Deprivation and the Measurement of Poverty, Journal of
Social Policy, Vol. 22, pp. 141-172,1993.
[5] B.Nolan, and C.TWhelen, On the Multidimensionality of Poverty and social Exclusion, Oxford University
Press, New York, p.146,2007
[6] A.B. Atkinson, B.Cantillon, E.Marlier,and B.Nolan , Social Indicators, The EU and Social Inclusion,
Oxford, Oxford University Press,2002.
[7]M.U.Qureshi, India’s Social Problems in Twenty First Century, New Delhi, Anmol Publications Pvt. Ltd.,
pp. 65-112,2004.
[8] L.Cappellari, S.P.Jenkins, Summarizing Multiple Deprivation Indicators, In S. P. Jenkins and J.
Micklewright (eds.), Inequality & Poverty Reexamined, New York, Oxford University Press, p. 166,2007.
[9] Report of the expert group to review the methodology for measurement of poverty, Government of India
Planning Commission June, 2014, Annexure- B, Page 28.
[10] Census of India 2011
[11] Kumar, Arjun, Access to Basic Amenities, Aspects of Caste, Ethnicity and Poverty in Rural and Urban
India – 1993 to 2008-09”, Journal of Land and Rural Studies, 2(1), 127-48, (2014a).
[12] WASHwatch.org-India, Wikipedia