Bull. Mater. Sei., Vol. 15, No. 2, April 1992, pp. 183-188, 9 Print_ed in India,
Damage threshold determination of hulk polymer samples using pulsed
photothermal deflection technique
K RAJASREE, A V RAVIKUMAR, P RADHAKRISHNAN, V P N N A M P O O R I and C P G VALLABHAN
Department of Physics, Cochin University of Science and Technology, Cochin 682022, India MS received 17 June 1991; revised 4 January 1992
Abstract. Photothermal deflection technique was used for determining the laser damage threshold of poIymer samples of teflon (PTFE) and rJylon. The experiment was conducted using a Q-switched Nd-YAG laser operating at its fundamental wavelmlgth (l'06#m, pulse width 10nS FWHM) as irradiation source and a He-Ne laser as the probe beam, along with a position sensitive detector. The damage threshold values determined by phototherrnal deflection method were in good agreement with those determined by other methods. Keywords. Pbotothermal deflection technique; damage threshold; polymer, Nd-YAG laser; He-Ne laser.
1. Introduction
D a m a g e threshold studies of polymers have gained considerable significance in recent years because of their applications in photolithography (Dyer and Sidhu 1985; Sriaivasan et al 1986; Sell et a! 1989; Srinivasan and Braren 1989), in the choice of optical components in laser systems (Milam 1977; Dyumaev et al 1983) and in the selection of polymer-based nonlinear optical elements (Lipscomb et al t981). There are various methods like surface morphological studies, visual observation of plasma emission from the target and reflectivity variation studies from the target to evaluate the laser-induced damage threshold of materials. Techniques based on photoaeoustic effect have proved to be very effective in determining the laser damage thresholds of both transparent and opaque samples (Roseencwaig and Willis 1980). The present paper describes the use of transverse photothermal deflection technique (TPTD) to evaluate damage threshold of bulk polymer samples of teflon (PTFE) and nylon.
2. Photothermal deflection process
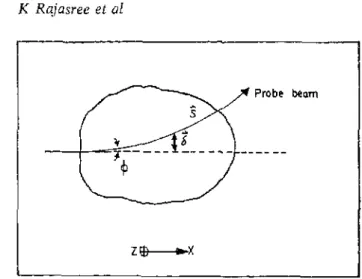
Absorption of laser radiation (pump beam) by a sample surface generated heat due to various non-radiative de-excitation processes occurring in the sample. The heat thus generated was transferred to the surrounding medium in close vicinity of the irradiated surface resulting in a temperature increase of the former, This increase in temperature led to density variations which brought about a refractive index gradient in the medium adjacent to the surface. A probe laser beam propagating through this refractive index gradient perpendicular to the direction of the pump beam suffered refraction and consequently deviated from its originai path (figure 1) corresponding to ambient condition. The effect was termed as transverse phototherrnal deflection (TPTD). The magmtude of the beam deflection depended on the amount of heat transferred from the sample to the medium. Such heat transfer depended strongly on 183
184 K Rq]asree et aI
z ~---~•
Figure l. Deflection of the probe beam propagating in an inhomogeneous medium due to mirage effect.
the thermal procezses induced on the surface by laser beam and generally it was round to increase for pump energies above the optical breakdown. As a result, at laser fluences above the damage threshold a noticeable enhancement in PTD was found. The propagation of an optical beam (probel in an inhomogeneous medium w a s governed by the equation
d/ds(n o dd/ds) = n(r, t), (1)
where s was the beam path, ~ the perpendicular displacement from the original p a t h which depend on the angle of detleetion r and the position of the detector and n(r, t)
the gradient of refractive index perpendicular to the beam path. If no, T~t and p,~ were the refractive index, temperature and density respectively under a m b i e n t conditions, the perturbed refractive index was written as
n(r,t) = n o + On/Otlr ~ T(r, t) + ~n/Oplp,p(r,t) (2) a M
dS/ds =
1/,,oOn/OTf Va
T(r,t)ds. (3)dpaLh
For small deflections we can write 95 (x, y, t) = d3/dS where q5 is the angle of deflection. Therefore (3) may be written as
i
ck (x, t) = 1/n o On/8 T O T/ax (x, y, t) dy, (4) where T(x, y, t)was the temperature distribution created by the heated sample s u r f a c e The details of soDing (4) were given by Tam (1986) and Rose and Gupta (1 986). S i n c e the probe beam profile was gaussian, the beam deflection was measured u s i n g a position sensitive detector (PSD).
To compute the thermal energy of a heated region by processing a detector s i g n a l one has to correlate the temperature distribution of the investigated region w i t h the optical beam propagation through the adjacent non-homogeneous m e d i u m a n d the detector response. The theoretical calculation of the probe beam deflection w a s verified using quadrant detector as the PSD (Jackson et al 1980). In the present i n v e s t i g a t i o n
Laser damage threshold of bulk polymer 185
Storage
I
Figure 2,
PSD
fibre
APD power unit
_~[ Nd:YAG
laserSampLe
X
[He-N e
laser]Schematic diagram
of
the experimental set-tip.the polished tip of an optical fibre coupled to an avalanche photodiode (APD) acts as the position sensitive detector (Rajasree et al 1990).
3, Experimental technique
The schematic diagram of the experimental set-up for the determination of the damage threshold of the polymer samples using the PTD technique is given in figure 2.
The sample in the shape of a disc of 205 cm dia and 0"55 cm thickness was mounted on a mlcropositional XYZ translator. The pump beam used to irradiate the surface was l'061zm radiation from a Q-switched Nd-YAG laser (Quanta ray DCRll). A short focal length convex lens focussed the pump laser beam on to the sample surface. The laser fluence incident on the sample surface wa~ varied by adjusting the position of the lens in front of the sample. A 5 mW H e - N o laser beam passing parallel to and grazing the sample surface was used as the probe beam. A fibre optical sensor which acts as the position sensitive detector (PSD) (Rajasree er al t990) located at. about 50cm away from the sample measured the magnitude of the probe beam deflection. A 100 MHz storage oscilloscope (Tektronix 466) coupled'to the PSD recorded the transient deflection. The laser energy was monitored for each pulse using a pulsed energy meter (Delta developments) triggered in ~synehronization with the laser pulse. 4, Results and discussion
A typical oscilloscope trace of the PTD signal recorded for nylon is shown in figure 3. The peak-to-peak value of the signal was taken as the signal amplitude. Damage threshold values evaluated for nylon and teflon using PTD technique are given in
186 K Raja~ree et aI
Figaro 3. Oscilloscope trace of the fignal from teflon at (a) 1.884 mJ (0.2 V/div.; I rns/dJv.), (h) 2-3 mj (0,] V/'di~.; ] ms,,'d/v,) andre) 3-35mJ (0"1 V/d/v.; ! ms/div.).
Talkie I. Energy densities at regions A and B for nylon and teflon.
Region (A) Region (B)
J/era ~ j/ere2
Pxe~ent AllerrJate Pre~ent Alternate
Sample method method* method method*
Nylon I "8 1 "53 2.5 2"25
Teflon 2'2 1.78 3'25 2'85
Esti~aated Error ",- 20~; *Ravi Kumar et al (1991)
table 1. For comparison the results obtained with alternate methods (Ravi K u m a z
et ai I99t) are also included here. These values showed close agreement with the results ob~ined from the PTD measurement.
Figures 4 and 5 show the plot of the measured signal amplitude against the energy density of the pump beam ineide~lt on the sample and these graphs exhibit two distinct regions of different slopes corresponding to two dLfferent kinds of thresholds for the laser-induced surface damage (b/arada et al/989; Ravi Kurnar et al/991). An a b r u p t increase in signal amplitude was found to occur in the regions near the threshold in agreement with earlier observations (Roscencwaig at~d Willis 1980; Srinivasan and
Laser dama.qe threshold of bulk polymer 187
1 , &
1.2
v l , 0
Ill
0,8
~ . o . 6 E
< O,Z,
0,2
0 . 0
Figure 4.
' i i ' . . . .
1.2 ! ~ iS ~-s 2 2.2 2.4 2-6 z,a 3
Energy Density (Jlcm 2)
Plot of laser energy density vs PT amplitude for nylon in aft.
0.6 ~ ' o - 5
i11
9 "u o,~, -&0.3
g
0.2
I--
0,1 0.o
Figure 5,
1-3 1-6 1.9 2.~ 2.5 2 8 3.1 3.z. E n e r g y Density( Jlcm 2)
Plot o[ laser energy, density vs PT amplitude for teflon in air.
Braren 1989; Ravi Kumar e~ al 1991). The two distinct threshold values explained in terms of different mechanisms operative in producing the damage-like impurity initiated damage, bond breaking and melting processes took place at different laser energy densities.
Although the mechanism of laser-induced damage in polymeric materials is not well understood, it has been observed that the damage is very sensitive to sample surface condition. The dependence of damage threshold on possible absorptive inclusions and surface polishing of the sample was earlier reported (Golberg et al
1983). Results showed that polymers with rough or opaque surfaces had lower values for damage threshold than those for thb same material having polished or transparent surfaces at the same wavelength. Therefore, of the two distinct regions observed, the first region (A) corresponded to the damage due to inclusions, impurities and surface inhomogeneity, while the second (B) occurring at higher fluences were assigned to initiation of bond breaking process in the sample. It must be mentioned here that in the second case (B), in addition to the surface layer, the bulk of the material immediately below the surface also got affected in a substantial way due to the action of the laser pulse.
188 K Rajasree el. aI
5. Conclusions
The suitability of PTD technique to estimate the damage threshold of a polymer sample has been illustrated. Damage threshold values evaluated by this method for nylon and teflon are in agreement with previous results but tend to be higher.
Acknowledgements
Authors are thankful to the Council of Scientific and Industrial Research, the Department of Science and Technology and the Ministry of H u m a n Resource Development, New Delhi for financial assistance. One of the authors (RK) is grateful to the University Grants Commission for a research fellowship.
References
Oyumaev K M, Manenkov A A, Maslyukov A P, Matyushin G A, Nechitaito V S and. P r o k h o r o v A M 1983 So~'. J. Quamum Electrott. 13 503
Dyer P E and Sidhu J 1985 J. Appl. Phys. 57 1420
Golberg S M. Matyushin G A. Pilipetsky N F, Yu Savanin S, Suda.rkin A N and Triblesky M I 1983 Appl. Phys. !t31 85
Harada Y, Kanemhsu Y, Tanaka Y, Nakano N, Kuroda N and Yamanaka K 1989 J. Phys. D22 569 Jackson W B, Amer N M, Boccara A C and Foamier D 1980 Appt. Opt. 20 1333
Lipscomb O F, Grim A F and Narang P S 1981 d. Chem, Phys. 75 1509 Milam D I977 AppI. Opt. 16 1204
Rajasree K, RaviKumar A V, Radhakrishnaa P, Nampoori V P N and Valtabhan C P G 1990 d. Acoustic Soc, India 18 24
Ravi Kumar A V, Padmaja G, Radhakrishnan P, Nampoori V P N and Va]labhan C P G 1991 Pramana - j , Phys. 3'7 345
Rosceaewaig A and Willis J B 1980 Appl. Phys. Lett. 36,667 Rose A aug Gupta R 1986 Opt, Cumin,re. 56 303
Sell J A, F1effelfinger D M, Ventzek P and Gilgenbaeh It M 1989 Appl. Phys. Lett, 55 2435 Srlrti~asan V, Smertic M A and Babu S V 1986 J_ Appl, Phys, 59 3681
Sdnivasan R and Braren B 1989 Chem, Reo, 89 1303 Tam A C 1986 Rev. Mad. Phys, 58 381