S
A J
o
u
rn
a
l of I
n
d
u
s
tr
ia
l P
s
y
c
h
o
lo
g
y
T
he
consTrucTion
and
evaluaTion
of
a
generic
W
ork
P
erformance
Q
uesTionnaire
for
use
WiTh
adminisTraTive
and
oPeraTional
sTaff
AbstrAct
The principal objective of the study was the construction and evaluation of a work performance questionnaire for use with administrative and operational staff. Work performance is a multidimensional construct that indicates how well a worker performs in his/her work, the degree of initiative he/she takes, the ingenuity he/she shows in the finding of solutions for problems, and the manner in which he/she uses the human resources at his/her disposal. Two questionnaires were constructed – one for staff performing managerial functions (the full scale) and one for staff in non-managerial positions (the shortened scale). The sample consisted of 278 staff at a South African university. The full scale yielded a reliability of 0,983 and the shortened scale a reliability of 0,978. The implications of the findings are discussed.
Keywords: performance, halo error, citizenship, orientation, counterproductive
Well-developed psychometric instruments (aptitude tests, personality tests, attitude scales, interest inventories, etc.) have been in use in the selection and training context for the best part of fifty years, but as far as the assessment of work performance is concerned there has been a paucity of suitable measuring instruments, particularly prior to 1990 (Campbell, McCloy, Oppler & Sager, 1993, pp. 36–37).
Prior to the publication of Campbell et al.’s “theory of job performance”, job performance was simply defined as “that which is to be predicted, the dependent variable” (Schmitt & Chan, 1998, p. 71). With this restricted definition of job performance in mind the following techniques were used to assess the work performance of staff: ratings by superiors, peers and subordinates; standardised job samples in which the content of the job was simulated; direct task observation; and outcome measures (Campbell et al., 1993, pp. 53–56). Most of these procedures were developed in-house for the assessment of performance in specific positions. They could therefore not be extended for use in other positions without first doing the necessary research.
Each of the approaches mentioned above suffer from their own limitations: Raters are inclined to rate others highly only if they perceive them to be like themselves. All raters have their own unit of measurement (mean and standard deviation). Some are very lenient while others are very strict. Halo errors occur when raters do not “discriminate among different facets of performance” (Ployhart, Schneider & Schmitt, 2006, p. 184). Raters must be thoroughly trained before making any ratings (Guilford, 1954; Cronbach, 1970, pp. 571–607). Performance in a simulated job negates the motivational factor that operates in real jobs. Direct task observation is closely linked to specific positions – one cannot generalise the findings to all jobs. Outcome measures are not always under the full control of a worker, particularly when teamwork is being done. His/her true performance might then not be visible (Schmitt & Chan, 1998, p. 79).
To overcome the deficiencies of graphic rating scales (low reliability and poor discriminability), Behaviourally Anchored Rating Scales (BARS) were developed. Firstly,
the major dimensions of job performance (five to ten performance dimensions) were determined. Thereafter, each of the dimensions was anchored by five to seven behavioural statements (Ployhart et al., 2006, pp. 180–181).
In practice it was found that “although BARS require much effort and time to construct, they surprisingly do not result in scales with better measurement properties” (Ployhart et al., 2006, p. 181).
Schmitt and Chan (1998, pp. 91–92) critically examined the structure of BARS. They developed ten behaviourally anchored scales and applied them to 467 investigative officers. The ratings were done by their immediate supervisors. The ten behaviourally anchored scales plus an overall dimension of effectiveness were intercorrelated and subjected to a factor analysis. Two factors accounted for 65% of the common variance. Recording and Writing, Making Presentations, Gathering Information, Analysing Information, Planning and Organising and Monitoring Work/Detail had substantial loadings on the first factor, which was identified as Core Technical Proficiency. The second factor had substantial loadings on Develops Relationships, Effort and Initiative, Professional Image and Overall Effectiveness. This factor was identified as Effort (Schmidt & Chan, 1998, p. 92). The authors found that “most of the correlations are in the .40s and .50s”, and concluded that it is “evidence of halo error” (Schmidt & Chan, 1998, p. 91).
In order to further improve the properties of graphic rating scales, Behavioural Observation Scales (BOS) were developed. They retained “the behavioral specificity of BARS”, but raters were required to indicate “how often each behavior occurred”. They were not required to evaluate the behaviour of the person (Ployhart et al., 2006, p. 182).
Another variant of behavioural rating scales is the Mixed Standard Scales (MSS). The rater “checks which one of three statements in a set is most like the person rated” (Ployhart et al., 2006, p. 182).
“Research to explore differences among rating scale formats in their ability to eliminate halo, central tendency, and leniency
JOHAnn M SCHEPERS
Department of Human Resource ManagementUniversity of Johannesburg South Africa
S
A J
o
u
rn
a
l of I
n
d
u
s
tr
ia
l P
s
y
c
h
o
lo
g
y
indicates that the more involved attempts (BARS, BOS, MSS) yield little improvement in measurement” (Ployhart et al., 2006, p. 186).
The status of research on work performance radically changed following the publication of Campbell et al.’s (1990) model of work performance: new research concerning the content, structure and metrical properties of work performance measures emerged (Campbell et al., 1993; Viswesvaran & Ones, 2000), and several generic work performance scales were produced.
Campbell et al. (1993, pp. 40–41) defined performance as “goal-relevant actions that are under the control of the individual, regardless of whether they are cognitive, motor, psychomotor, or interpersonal”. Their model consists of eight factors, viz.
Job-specific task proficiency. This factor refers to the degree to which an individual can perform the “core substantive or technical tasks that are central to the job” (p. 46).
Non-job-specific task proficiency. This factor refers to tasks that individuals have to perform “that are not specific to their particular job” (p. 47).
Written and oral communication task proficiency. This factor entails the making of “formal, oral or written presentations to audiences” (p. 47).
Demonstrating effort. This factor relates to “the degree to which individuals commit themselves to all job tasks, work at a high level of intensity, and keep working when it is cold, wet, or late” (p. 47).
Maintaining personal discipline. This factor entails the avoidance of negative behaviour such as “alcohol and substance abuse at work, law or rule infractions, and excessive absenteeism” (p. 47).
Facilitating peer and team performance. This factor relates to the degree to which the individual “supports his or her peers, helps them with job problems, and acts as a de facto trainer” (p. 47).
Supervision/leadership. This factor includes “all the behaviors directed at influencing the performance of subordinates through face-to-face interpersonal interaction” (p. 48).
Management/administration. This factor includes “the major elements in management that are distinct from direct supervision” (p. 48).
The performance assessment model of Campbell et al. (1993) is a very comprehensive model, and should fit most jobs. However, not all eight factors are relevant to all jobs. A proper job analysis ahead of time would indicate which of the factors are relevant. It needs to be stressed that the job analysis indicates “what work is being done”, and that the performance assessment indicates “how well the work gets done” (Schmitt & Chan, 1998, p. 72).
Viswesvaran (1993) identified ten dimensions of job performance by studying the measures (486 of them) that were used in published articles over the years by having two raters group conceptually similar measures together (Viswesvaran & Ones, 2000, p. 220). “The ten dimensions were: overall job performance, job performance or productivity, effort, job knowledge, interpersonal competence, administrative competence, quality, communication competence, leadership, and compliance with rules” (pp. 220–221).
The ten dimensions listed above largely overlap with the eight dimensions of Campbell et al. (1993): overall job performance is essentially “the sum of all the individual dimensions rated” (Viswesvaran & Ones, 2000, p. 221), and productivity was not listed because it is not always under the full control of an individual worker. For the rest they cover the same content as the dimensions of Campbell et al. (1993).
As far as the factor structure of the ten dimensions is concerned, Viswesvaran (1993) accumulated results across more than
1.
2.
3.
4.
5.
6.
7.
8.
300 studies and found that over 50% of the variance is shared across the different dimensions. “There is a general factor in job performance assessments” (Viswesvaren & Ones, 2000, p. 223). Furthermore, “this general factor is substantively meaningful and not just a manifestation of halo error” (Viswesvaran & Ones, 2000, p. 223). Their final conclusion is that “research to date suggests that ability and conscientiousness predict both task and contextual performance” (p. 224).
Rotundo and Sackett (2002) identified three broad components in job performance, namely task, citizenship and counterproductive performance (p. 66). Their prime objective was to examine “the relative importance of each component to ratings of overall performance” by managers (p. 66). Hypothetical profiles describing employees’ task, citizenship and counterproductive performance were prepared, and managers in five different jobs were asked to read these profiles and give their global ratings of the performance of the workers represented (p. 66).
They identified the three broad performance components after studying the research on the structure of job performance over the past 20 years. According to them, “task performance includes actions and behaviors related to the production of a good or the provision of a service”, “citizenship performance describes actions and behaviors that further the goals of the organization by contributing to its social and psychological environment”, and “counterproductive performance includes voluntary actions and behaviors that harm the well-being of the organization or its members” (p. 69).
Using hierarchical cluster analysis it was found that “raters’ policies could be grouped into three homogeneous clusters” (p. 66). For the first cluster “task performance weighted highest”. For the second cluster “counterproductive performance weighted highest”, and for the third “equal and large weights [were] given to task and counterproductive performance” (p. 66).
Following the publication of Campbell et al. (1993), several generic work performance scales were produced. Most of these scales incorporated four or more of Campbell et al.’s eight components. One such device, published recently by nikolaou (2003), will be briefly reviewed.
nikolaou (2003) developed a measure of generic work competencies, but his instrument is very narrow in scope. It basically covers four major elements of work performance, viz. task orientation, action-leadership, people and communication skills (p. 312). Tett, Guternamn, Bleier and Murphy’s taxonomy (2000) is much wider and includes personality constructs such as open-mindedness, emotional maturity and dependability.
Nikolaou (2003) identified 40 items covering the four clusters mentioned. He asked 24 managers from several Greek firms to rate their immediate subordinates on an eight-point scale in respect of each of the items in the scale. Complete records were obtained in respect of 107 participants. The supervisors also rated their subordinates on a job performance scale comprising six items.
A principal components analysis of 17 of the items yielded three components, which were rotated to simple structure by means of a Direct Oblimin rotation. The three components were identified as Action-leadership, People and Communication Skills (p. 315).
From a hierarchical regression analysis it was found that Action-leadership predicted job performance very well [R = 0,706, F (1, 105) = 104,629; p < 0,001] (nikolaou, 2003, p. 316).
S
A J
o
u
rn
a
l of I
n
d
u
s
tr
ia
l P
s
y
c
h
o
lo
g
y
from 22 Greek organisations. 57 managers were asked to rate their subordinates on the Competencies Scale, and also to assess their overall job performance.
Using a principal components analysis, followed by a Direct Oblimin rotation, he obtained three well-defined factors that explained 84,9% of the total variance. The three factors that were obtained were very similar to those of the first study and were identified as Action-leadership, People Orientation and Communication Skills.
A hierarchical regression analysis was also done with overall job performance as dependent variable. It was found that Action-leadership predicted job performance very well [R = 0,57; F (1,216) = 104,59; p < 0,01] (nikolaou, 2003, pp. 316–318).
The following competencies were included under Action-leadership (nikolaou, 2003, p. 317):
Acts as leader in group activities Motivates colleagues at work Behaves dynamically at work
Looks for new activities within work environment Seeks stimulation at work
Commits himself/herself to new tasks
These competencies partly overlap with three of Campbell
et al.’s factors (Factors 4, 6 and 7).
Apart from the narrow scope of the instrument the study can be criticised on methodological grounds:
It is not entirely clear whether a principal factor analysis or a principal components analysis was done (nikolaou, 2003, p. 314–315). From the results obtained it appears more like a principal components analysis.
no attempt was made to standardise the ratings of the various judges (managers). It is well known that every judge maintains his/her own unit of measurement (different means and standard deviations) when rating subordinates. Furthermore, there are now two sources of variance – one associated with differences in the attributes of the participants being rated, and one associated with differences in the units of measurement of the judges. These two sources of variance combine and result in artificially high reliabilities.
The job performance ratings and the Action-leadership ratings were done by the same judges, thereby inflating the relationship between the two sets of scores.
The intercorrelations between the three factors that were obtained are not given. A single higher-order factor would probably fit the data very well.
Bartram (2005) and his associates Kurz and Baron, formerly of SHL, developed the Great Eight model. They performed a meta-analysis of 29 validation studies, based on a total sample of 4861 participants. They identified 112 component competencies, and combined them into eight general factors. These factors subsequently became known as the Great Eight Competencies (pp. 1185–1187). next, the average intercorrelations of the Great Eight Competencies manager ratings were calculated and subjected to a principal components analysis. Two factors were extracted and rotated to simple structure by means of a Varimax rotation. The first factor had high loadings on Leading and Deciding, Interacting and Presenting, Analysing and Interpreting, Creating and Conceptualising, Organising and Executing and Enterprising and Performing. This factor broadly represents the Task. The second factor had high loadings on Supporting and Co-operating and Adapting and Coping. It also had moderate loadings on Leading and Deciding and Interacting and Presenting. The second factor was identified as Contextual Behaviours. The two factors accounted jointly for
1. 2. 3. 4. 5. 6.
1.
2.
3.
4.
65,03% of the total variance (p. 1192). Strictly speaking these are principal components (rotated) and not principal factors.
According to Bartram (2005, p. 1199), the first principal component is “closely tied to task performance” and is “best predicted by motivation, general ability, conscientiousness, and openness to new experience”. “The second principal component is related to competencies associated with supporting and cooperating with others and coping and adapting to change.”
According to Bartram’s study (2005), the two principal components (rotated) underlying the Great Eight Competencies correspond very closely with Rotundo and Sackett’s Task Performance and Citizenship Performance (2002, pp. 67–69). Furthermore, Bartram found that predictors of the Great Eight Competencies, based essentially on personality scales, showed “moderate to good correlations with line-manager ratings for all eight of the competencies” (2005, p. 1185). The ability tests alone correlated with four of the eight competencies. Jointly, the ability and personality scales correlated from 0,20 to 0,44 with the eight competencies (p. 1185).
The 112 competency components, listed in SHL’s Universal Competency Framework, form the basis of “a well-articulated model of the domain of workplace behaviors” (p. 1186), however, the various instruments of SHL need to be applied to well-structured samples, and analysed statistically. Furthermore, the line managers must first be trained before they rate their subordinates.
In a study of the work performance of black managers and supervisors, Bothma and Schepers (1997) made use of an unpublished work performance questionnaire (Schepers, 1994) called the Performance Appraisal Questionnaire (PAQ). It consists of 33 items and covers three broad areas of work, viz. the task, initiative/creativity and managerial abilities (leadership, interpersonal relations, social intelligence, etc.). The items are all in the form of questions and have to be completed by the superiors of the staff that have to be assessed. They must particularly be guided by work-anchored behaviour which they have observed themselves.
The Locus of Control Inventory (LCI) of Schepers (2004, pp. 31- 40) and the Achievement Motivation Questionnaire (AMQ) of Pottas, Erwee, Boshoff and Lessing (1988) were applied jointly with the PAQ to 102 black managers and supervisors from a geographically dispersed chemical company in South Africa (Bothma & Schepers, 1997, pp. 44–52). Their level of seniority was based on the Peromnes Job Evaluation System. Fifty per cent of the respondents were between Peromnes level 12 and 10 and 50% between Peromnes level 9 and 5, the latter representing the more senior positions (Bothma & Schepers, 1997).
next, the LCI, AMQ and the PAQ were subjected to a joint factor analysis and yielded three factors. The obtained factor matrix was rotated to simple structure by means of a Direct Oblimin rotation.
The first factor had high loadings on Work Performance (0,764), Initiative/Creativity (0,895), Management Skills (0,764) and Autonomy (0,534), and very low loadings on the five measures of the AMQ (cf. Bothma & Schepers, 1997, p. 49).
The second factor had high loadings on Persistence, Awareness of Time, Action Orientation and Personal Causation of the AMQ and a low negative loading on Work Performance (-0,392) (Bothma & Schepers, 1997, p. 49).
S
A J
o
u
rn
a
l of I
n
d
u
s
tr
ia
l P
s
y
c
h
o
lo
g
y
next, canonical correlations were calculated between the LCI and AMQ (independent variables) and the three measures of the PAQ (dependent variables). Two canonical variates were computed and yielded canonical correlations of 0,622 and 0,544 respectively. The first canonical variate had moderate to high negative loadings in respect of Persistence, Awareness of Time, Action Orientation and Personal Causation, and a positive loading of 0,653 in respect of Work Performance. All the other loadings were very low. Internal Control and Autonomy had moderate to high loadings in respect of all three measures of the PAQ. The loadings in respect of Internal Control and Autonomy were 0,482 and 0,785 respectively, and the loadings of Work Performance, Initiative/Creativity and Management Skills were 0,748; 0,984 and 0,802 respectively (cf. Bothma & Schepers, 1997, p. 51). Internal Control and Autonomy thus appear to be good predictors of work performance as measured by the PAQ (Tabachnick & Fidell, 1989).
Rotundo and Sackett (2002) identified organisational citizenship as an important component of job performance. They described it as “actions and behaviors that further the goals of the organization by contributing to its social and psychological environment” (p. 69). Porteous and Sutherland (1997), working in South Africa, identified the following behaviours as organisational citizenship behaviour: “exceeding job requirements, having a positive attitude, being pro-active, taking the lead, having respect for others, being trustworthy and discrete, being honest about everything, being innovative, being proud of your organization, being ethical, frank, and direct, and volunteering to help others” (Joubert, Crafford & Schepers, 2004, p. 2).
Based on the classification of Porteous and Sutherland, Joubert
et al. (2004) constructed the Locus of Organisational Citizenship
Inventory (LOCI) to determine the locus of organisational citizenship. They applied the LOCI, jointly with the LCI of Schepers (1999), to 151 students at tertiary institutions in South Africa. The majority of the participants (57,6%) had an African language as vernacular.
The LOCI was subjected to a principal factor analysis and yielded two factors, which were interpreted as Situational Locus and Dispositional Locus. Two scales were formed corresponding to the two factors. The reliability of the first scale was 0,946 and that of the second scale 0,908. The first scale consists of two subscales, viz. Avoidance of Punishment (SAP) and Seeking for Reward (SSR). The second scale consists of Avoidance of Punishment (Dispositional) (DAP) and Seeking for Reward (Dispositional) (DSR). Scale I correlated 0,560 with External Control and 0,949 and 0,932 with SAP and SSR respectively. Scale II correlated 0,375 with Autonomy and 0,569 with Internal Control. It correlated 0,883 with DAP and 0,885 with DSR. All the correlations referred to above are statistically highly significant (p < 0,01) (Joubert et al., 2004, pp. 4–7).
From the foregoing it is clear that the LOCI can be used as a valuable adjunct to any scale of work performance to measure organisational citizenship.
From the review of literature it should be clear that despite all the research that has been done, there is still need for a well-developed generic scale of work performance. Special attention should be paid to the structure, metrical properties and content validity of the instrument.
In the light of the foregoing it was decided to examine the factor structure and metrical properties of the Work Performance Questionnaire that was created in 1994. It was applied to 278 administrative and operational staff at an Afrikaans-medium university in 1994, but never published.
Statement of the problem
The principal objective of the study was the construction and evaluation of a generic work performance questionnaire for use with administrative and operational staff.
Postulates
In the light of the stated objective of the study the following postulates were formulated:
Postulate 1:
It is postulated that the Work Performance Questionnaire (WPQ) will yield three or four components of work performance. In the light of Campbell et al.’s (1993) theoretical model the following dimensions are expected:
Quantity and quality of work produced by the workers. Initiative and creativity of the workers manifested in the work situation.
Managerial qualities of workers exhibited in the work situation (leadership, motivation of subordinates, good interpersonal skills and good communication skills).
Postulate 2:
It is postulated that the various dimensions obtained will be positively correlated with one another yielding a single second-order factor.
Postulate 3:
It is postulated that two separate scales can be formed – one for managerial staff and one for non-managerial staff.
Postulate 4:
It is postulated that the reliabilities of both scales will be highly acceptable.
RESEARCH DESIGN
Research approach
A quantitative approach was followed in the analysis of the data. In particular, principal factor analysis and item analysis were used. The data were collected by means of a field survey.
Participants
The WPQ was completed by 18 different judges in respect of 278 administrative and operational staff at an Afrikaans-medium university. The sample included all employees from post level 13 and higher. The post levels ranged from level 13 to 54 (cf. Figure 1). Approximately 93% of the employees lay between post levels 13 and 26 and the rest between levels 50 and 54. The average age of the participants was 41,90 years with a standard deviation of 9,75 years. Thirty-eight per cent of the sample was male and 62% was female (cf. Figure 2). The academic qualifications of the staff ranged from below matric to a doctor’s degree (cf. Figure 3). Approximately 25% of the staff had university degrees and 21% had diplomas. Approximately 13% had qualifications less than matric.
Six of the items in Section C of the WPQ were not applicable to all participants and were not completed by the judges for the full sample. Complete records were received in respect of 156 members.
Measuring instrument
For the purposes of the present study the definition of performance of Campbell et al. (1990) was accepted: “Performance is defined as the total population of behaviors and activities that are judged to be important for accomplishing the goals of the organization” (p. 278). Campbell et al. (1993, p. 40) emphasised the following aspects of performance: “Performance is what
• •
S
A J
o
u
rn
a
l of I
n
d
u
s
tr
ia
l P
s
y
c
h
o
lo
g
y
the organization hires one to do, and do well”. It is not “the consequence or result of action, it is the action itself”.
Thirty-eight items, covering most of the competencies of Viswesvaran (1993), were identified (Viswesvaran & Ones, 2000, p. 220). As indicated earlier, these items fall into three categories, viz. the quantity and quality of work produced by each worker; the initiative and creativity exhibited by the workers; and the managerial skills exhibited by the managers and supervisors (i.e. leadership, motivation of subordinates, interpersonal behaviour and communication skills). The items are all in the form of questions and had to be completed by the superiors of the administrative and operational staff. They had to rate all the members under their supervision on a nine-point scale in respect of all the items in the questionnaire. They had to be specifically guided by work-anchored behaviour which they have observed themselves. Two separate scales were constructed – one involving all 38 items (the full scale) and one based on 32 items (the shortened scale).
Procedure
All the raters were invited to attend a lecture on rating scales. Halo, central tendency, leniency, logical expectation and generosity were briefly highlighted.
ROOT EIGENVALUES
1 23,6235
2 2,2893
3 1,6153
4 1,4684
5 0,9337
6 0,8530
7 0,7558
8 0,5932
9 0,5155
10 0,4490
11 0,4031
12 0,3842
13 0,3532
14 0,3289
15 0,2918
16 0,2829
17 0,2770
18 0,2508
19 0,2306
20 0,2159
21 0,1897
22 0,1781
23 0,1581
24 0,1497
25 0,1428
26 0,1321
27 0,1264
28 0,1149
29 0,1052
30 0,0913
31 0,0904
32 0,0886
33 0,0757
34 0,0695
35 0,0537
36 0,0470
37 0,0399
38 0,0318
Trace 38,000 TAbLE 1
Work performance questionnaire: (full scale) eigenvalues of unreduced intercorrelation matrix (38 X 38)
FIGURE 1
Distribution of posts
FIGURE 2
Gender distribution
FIGURE 3
Academic qualifications
Statistical analysis
Six items involving managerial abilities were not completed in respect of the full sample. Accordingly, the full scale was analysed in respect of 156 participants and the shortened scale in respect of 278 participants.
One of the fundamental assumptions in test construction is that the scale to be constructed must be unidimensional. However, this assumption must be tested ahead of time. If the presumption exists that the vector space of test items is multidimensional, it would be necessary to first categorise the items according to the construct measured before an item analysis is undertaken. The categorisation of the test items can be done with the aid of factor analysis, but the procedure is not free of problems.
The crux of the problem is the differential skewness of test items. If items that are differentially skew are subjected to factor analysis it usually results in a multiplicity of factors, with the result that the true structure of the matrix of intercorrelations of test items is obscured (cf. Ferguson, 1941).
S
A J
o
u
rn
a
l of I
n
d
u
s
tr
ia
l P
s
y
c
h
o
lo
g
y
SUbSCORE 1
SUbSCORE 2
SUbSCORE 3
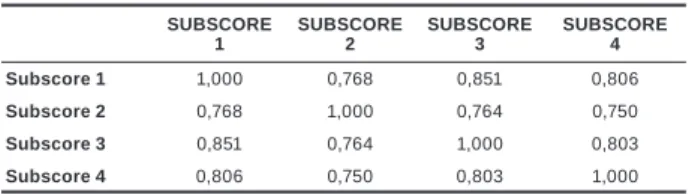
SUbSCORE 4 Subscore 1 1,000 0,768 0,851 0,806
Subscore 2 0,768 1,000 0,764 0,750
Subscore 3 0,851 0,764 1,000 0,803
Subscore 4 0,806 0,750 0,803 1,000
TAbLE 3
Matrix of intercorrelations of subscores
ROOT EIGENVALUE
1 3,3726
2 0,2683
3 0,2105
4 0,1485
Trace 4,0000
TAbLE 4
Eigenvalues of unreduced intercorrelation matrix
FACTOR I h2 j
Subscore 1 0,920 0,8458
Subscore 2 0,840 0,7052
Subscore 3 0,916 0,8392
Subscore 4 0,882 0,7771
VP 3,167
TAbLE 5
Factor matrix (full scale)
Table 2 shows that all four of the factors are well determined. Item 18 from Section B has a low communality (0,2774) indicating that it shares very little variance with the rest of the items. It was subsequently rejected during item analysis.
next, the items were grouped according to the factor where they had their highest loading. Subscores were then calculated for each participant in respect of each of the factors by adding the scores together of the items that have high loadings on a particular factor. The subscores were then intercorrelated and subjected to a principal factor analysis.
The intercorrelations of the subscores are given in Table 3. From an inspection of this table it is clear that all the subscores are mutually highly correlated. The WPQ is therefore essentially unidimensional.
The eigenvalues of the unreduced intercorrelation matrix of subscores were calculated and are given in Table 4.
Only one of the eigenvalues was greater than unity, and suggests a one-factor structure (Kaiser, 1961). Accordingly, one factor was extracted and is given in Table 5.
From Table 5 it is clear that all the subscores have high loadings on the obtained factor. The WPQ is therefore internally highly consistent, i.e. essentially unidimensional. Accordingly, an item analysis of the WPQ was done. For this purpose the nP50 program of the Human Sciences Research Council (HSRC) was used.
The means (Xg) and standard deviations (Sg) of the various items as well as the item-total correlations (rgx) and indices of
reliability of the items (rgxsg) are given in Table 6. These statistics are based on the first run before any items were rejected.
In the analysis of the items the nine-point response scales were linearly transformed by subtracting a constant of one from each participant’s score (a program requirement). The real means of the participants are therefore one higher than depicted in Table 6. From Table 6 it is clear that the participants obtained on average six points for most of the items, which is realistic
VARIAbLES FACTOR 1
FACTOR 2
FACTOR 3
FACTOR 4
h2 j
1
W
o
rk P
e
rf
o
rm
a
n
c
e
(
S
e
c
ti
o
n A
)
1 0,418 0,287 0,527 0,474 0,7585 2 2 0,446 0,277 0,649 0,358 0,8259 3 3 0,357 0,316 0,736 0,191 0,8053 4 4 0,428 0,362 0,710 0,113 0,8316 5 5 0,363 0,397 0,703 0,288 0,8663 6 6 0,276 0,296 0,502 0,549 0,7169 7 7 0,178 0,342 0,623 0,421 0,7146 8 8 0,245 0,228 0,214 0,656 0,5880 9 9 0,539 0,160 0,404 0,495 0,7236 10 10 0,113 0,352 0,475 0,477 0,5903
1
In
it
ia
ti
v
e
/C
re
a
ti
v
it
y
(S
e
c
ti
o
n
b
)
11 0,583 0,396 0,475 0,195 0,7607 2 12 0,675 0,165 0,273 0,540 0,8485 3 13 0,562 0,364 0,368 0,425 0,7652 4 14 0,540 0,223 0,178 0,552 0,6775 5 15 0,456 0,326 0,319 0,581 0,7539 6 16 0,217 0,226 0,137 0,604 0,4826
7 17 0,165 0,473 0,335 0,516 0,6284 8 18 0,051 0,434 0,207 0,208 0,2774
9 19 0,599 0,269 0,104 0,592 0,7932 10 20 0,808 0,244 0,253 0,211 0,8205 11 21 0,853 0,270 0,221 0,204 0,8913 12 22 0,506 0,459 0,360 0,274 0,6715 13 23 0,648 0,293 0,288 0,430 0,7448 14 24 0,829 0,287 0,249 0,230 0,8857 15 25 0,614 0,272 0,460 0,360 0,7925 16 26 0,521 0,150 0,363 0,343 0,5430
1
M
a
n
a
g
e
ri
a
l a
b
lit
ie
s
(S
e
c
ti
o
n C
)
27 0,348 0,623 0,357 0,125 0,6526 2 28 0,207 0,746 0,140 0,203 0,6604 3 29 0,342 0,778 0,237 0,239 0,8344 4 30 0,615 0,394 0,516 0,149 0,8219 5 31 0,612 0,373 0,517 0,164 0,8083 6 32 0,434 0,705 0,229 0,266 0,8093 7 33 0,374 0,684 0,317 0,289 0,7922 8 34 0,401 0,750 0,296 0,181 0,8432 9 35 0,312 0,566 0,246 0,502 0,7302 10 36 0,362 0,294 0,675 0,384 0,8203 11 37 0,129 0,743 0,153 0,146 0,6132 12 38 0,423 0,638 0,355 0,273 0,7872
TAbLE 2
Work performance questionnaire rotated factor matrix (varimax rotation)
A complete analysis of the full scale (38 items) was done first, after which the shortened scale (32 items) was dealt with.
rEsULts
The full scale
In order to determine the factor structure of the WPQ, the items were intercorrelated and subjected to a principal factor analysis. For this purpose the BMDP4M program (Dixon, 1990) was used.
The intercorrelation matrix (38 x 38) is too big for reproduction here, but is available on request.
To determine the number of factors underlying the intercorrelation matrix, the eigenvalues thereof were calculated and are given in Table 1.
S A J o u rn a
l of I
n d u s tr ia l P s y c h o lo g y
ITEM N Xg Sg rgx rgxSg 1 W o rk P e rf o rm a n c e ( S e c ti o n A )
156 5,686 1,463 0,843 1,233
2 156 5,417 1,528 0,860 1,315
3 156 5,378 1,534 0,801 1,228
4 156 5,455 1,644 0,817 1,343
5 156 5,494 1,736 0,871 1,511
6 156 5,462 1,580 0,796 1,258
7 156 5,455 1,724 0,771 1,329
8 156 5,404 1,869 0,663 1,239
9 156 5,154 1,607 0,796 1,279
10 156 5,449 2,120 0,704 1,492
1 In it ia ti v e /C re a ti v it y (S e c ti o n b )
156 5,135 1,646 0,846 1,393
2 156 5,154 1,520 0,826 1,256
3 156 5,224 1,470 0,866 1,273
4 156 5,449 1,388 0,749 1,040
5 156 5,295 1,469 0,833 1,224
6 156 5,442 1,627 0,587 0,954
7 156 5,590 1,485 0,738 1,096
8 156 4,962 1,653 0,412 0,681*
9 156 5,244 1,456 0,782 1,139
10 156 5,205 1,621 0,790 1,280
11 156 5,115 1,532 0,803 1,231
12 156 5,596 1,454 0,813 1,183
13 156 5,545 1,241 0,810 1,005
14 156 5,167 1,544 0,825 1,274
15 156 5,301 1,592 0,863 1,373
16 156 5,276 1,714 0,706 1,209
1 M a n a g e ri a l a b lit ie s (S e c ti o n C )
156 5,192 1,650 0,750 1,237
2 156 5,410 1,752 0,665 1,164
3 156 4,859 1,555 0,809 1,259
4 156 5,115 1,677 0,859 1,440
5 156 5,019 1,683 0,856 1,440
6 156 4,712 1,562 0,831 1,297
7 156 4,929 1,533 0,840 1,288
8 156 4,692 1,691 0,830 1,404
9 156 5,276 1,664 0,810 1,348
10 156 5,660 1,632 0,849 1,386
11 156 5,346 1,641 0,602 0,988
12 156 5,019 1,534 0,857 1,315
TAbLE 6
Item statistics of full scale
ITERATION CRITERION NUMbER OF ITEMS
Sg rgx rgxSg KR20 KR14
1 0,95 37 1,598 0,793 1,264 0,983 0,983
2 0,97 36 1,598 0,799 1,273 0,983 0,983
3 0,99 35 1,596 0,805 1,281 0,983 0,984
4 1,01 35 1,596 0,805 1,281 0,983 0,984
5 1,03 34 1,607 0,805 1,289 0,983 0,983
6 1,05 33 1,613 0,806 1,297 0,983 0,983
7 1,07 33 1,613 0,806 1,297 0,983 0,983
8 1,09 32 1,617 0,809 1,305 0,982 0,983
9 1,11 32 1,617 0,809 1,305 0,982 0,983
10 1,13 31 1,623 0,811 1,311 0,982 0,982
TAbLE 7
Means of item statistics (full scale)
for well-selected staff. Furthermore, it is clear that there was only one poor item, namely item 8 from Section B. It has an index of reliability of 0,681 compared to a mean of 1,264 for the scale as a whole (Gulliksen, 1950). Using the index of reliability as criterion, ten iterations were done. The mean of the item standard deviations, as well as the mean of the item-total correlations, and the mean of the indices of reliability of the items are given in Table 7 for each of the iterations. Kuder-Richardson Formulae 20 and 14 (extended for continuous data) are given in the last two columns of Table 7 (Cronbach, 1951).
From Table 7 it can be seen that the mean standard deviation (excluding item 8 from section B) is 1,598. The judges were therefore able to make rather fine differentiations. The mean item-total correlation is 0,793, indicating that each item is a miniature of the scale as a whole. The mean of the indices of reliability of the items is 1,264, suggesting a wide distribution
VARIAbLES FACTOR 1 FACTOR 2 FACTOR 3 FACTOR 4 h2 j 1 W o rk P e rf o rm a n c e ( S e c ti o n A )
1 0,555 0,037 0,345 0,066 0,7587 2 2 0,759 -0,006 0,159 0,097 0,8258 3 3 0,913 0,043 -0,096 0,029 0,8053 4 4 0,869 0,128 -0,187 0,127 0,8318 5 5 0,818 0,142 0,017 0,000 0,8668 6 6 0,511 0,048 0,430 -0,092 0,7166 7 7 0,708 0,082 0,207 -0,195 0,7151 8 8 0,091 0,064 0,689 -0,062 0,5884 9 9 0,404 -0,080 0,459 0,237 0,7235 10 10 0,480 0,150 0,326 -0,234 0,5904
1 In it ia ti v e /C re a ti v it y (S e c ti o n b )
11 0,481 0,255 0,012 0,325 0,7611 2 12 0,187 -0,028 0,577 0,401 0,8494 3 13 0,291 0,215 0,341 0,266 0,7653 4 14 0,036 0,089 0,602 0,281 0,6773 5 15 0,208 0,157 0,551 0,133 0,7541 6 16 -0,011 0,108 0,653 -0,047 0,4824 7 17 0,218 0,359 0,403 -0,167 0,6282 8 18 0,119 0,432 0,066 -0,240 0,2763
9 19 -0,102 0,172 0,675 0,344 0,7929 10 20 0,184 0,148 0,173 0,636 0,8218 11 21 0,127 0,194 0,170 0,694 0,8928 12 22 0,281 0,372 0,132 0,245 0,6710 13 23 0,209 0,084 0,416 0,391 0,7437 14 24 0,159 0,202 0,191 0,642 0,8836 15 25 0,468 0,067 0,252 0,323 0,7921 16 26 0,374 -0,043 0,289 0,287 0,5444
1 M a n a g e ri a l a b lit ie s (S e c ti o n C )
27 0,262 0,620 -0,103 0,113 0,6524 2 28 -0,106 0,863 0,036 -0,005 0,6603 3 29 0,007 0,852 0,045 0,088 0,8347 4 30 0,550 0,244 -0,058 0,356 0,8213 5 31 0,555 0,213 -0,035 0,354 0,8087 6 32 0,009 0,754 0,108 0,183 0,8094 7 33 0,147 0,685 0,100 0,092 0,7922 8 34 0,111 0,801 -0,036 0,151 0,8433 9 35 0,045 0,521 0,411 0,001 0,7300 10 36 0,793 0,001 0,169 -0,006 0,8202 11 37 -0,068 0,866 -0,046 -0,069 0,6134 12 38 0,219 0,610 0,082 0,140 0,7871
TAbLE 8
S
A J
o
u
rn
a
l of I
n
d
u
s
tr
ia
l P
s
y
c
h
o
lo
g
y
ROOT EIGENVALUE
1 19,3019
2 1,8803
3 1,5196
4 1,3720
5 0,8259
6 0,6799
7 0,5900
8 0,5217
9 0,4927
10 0,4524
11 0,3965
12 0,3699
13 0,3403
14 0,3295
15 0,3029
16 0,2728
17 0,2614
18 0,2386
19 0,2091
20 0,2008
21 0,1825
22 0,1724
23 0,1688
24 0,1551
25 0,1337
26 0,1274
27 0,1213
28 0,1050
29 0,0945
30 0,0791
31 0,0554
32 0,0466
Trace 32,000
TAbLE 10
Work performance questionnaire: (shortened scale) eigenvalues of unreduced intercorrelation matrix (32 X 32)
FACTOR 1 FACTOR 2 FACTOR 3 FACTOR 4 Factor 1 1,000
Factor 2 0,675 1,000
Factor 3 0,620 0,543 1,000
Factor 4 0,420 0,298 0,334 1,000
TAbLE 9
Factor intercorrelations
of scores [(∑rgxsg)2 = s2g] (cf. Schepers, 1992, pp. 28–32). From
Table 7 it is clear that the WPQ can be reduced to 31 items with retention of its reliability (rxx = 0,982), but with a possible loss in validity.
In order to inductively examine the construct validity of the WPQ, the factor matrix was rotated obliquely by means of a Direct Oblimin rotation. The rotated factor matrix is given in Table 8.
From Table 8 it is clear that all four factors are well determined with three or more high loadings.
The following variables (items) have moderate to high loadings on Factor 1:
Item Loading
A3: Maintains a high work tempo 0,913
A4: Is very energetic and active 0,869
A5: Does a great deal of work 0,818
C10: Is task-orientated 0,793
A2: Produces a lot of work of high quality 0,759
A7: Punctual in completing work 0,708
A1: Consistently produces work of high
quality 0,555
C5: Often takes initiative in matters 0,555 C4: Possesses the ability to take the
initiative 0,550
A6: Works purposefully and
systematically 0,511
B1: Often takes the lead if an instruction
has to be carried out 0,481
A10: needs very little encouragement or
supervision 0,480
B15: Applies creative thoughts, expertise
and proficiency in practice 0,468
B16: Is considered to be an authority in
some field or other 0,374
This factor deals with the quantity and quality of work produced – in other words task orientation.
The following variables have moderate to high loadings on Factor 2:
Item Loading
C11: Is person-orientated to a high degree 0,866 C2: Communicates with people at all levels 0,863 C3: Motivates subordinates to reach goals 0,852
C8: Inspires workers to follow his/her leadership 0,801
C6: Motivates people to realise their full potential, and manages them 0,754
C7: Obtains a high degree of productivity from workers 0,685
C1: Readily adapts to changing circumstances 0,620
C12: Succeeds very well in bringing the objectives of the organisation home to
the staff 0,610
C9: Commands respect from staff 0,521
B8: Consults his/her people 0,432
B12: Implements the creative ideas of others 0,372* B7: Knows when to consult other people 0,359*
This factor deals with managerial ability: good communication
skills, ability to motivate subordinates, adaptability and good interpersonal skills.
The following variables have moderate to high loadings on Factor 3:
Item Loading
A8: Produces a well-refined product 0,689
B9: Argues a matter logically 0,675
B6: Focuses on the gist of matters 0,653
B4: Behaves astutely and intelligently 0,602 B2: Penetrates to the crux of problems 0,416 B5: Makes sure that all facts are available before deductions are made 0,551
A9: Final product shows evidence of study and insight 0,459
A6: Works purposefully and systematically 0,430 B13: Synthesises theory and practice 0,416
S
A J
o
u
rn
a
l of I
n
d
u
s
tr
ia
l P
s
y
c
h
o
lo
g
y
crux of problems in a logical and systematic way and to produce a well-finished product.
The following variables have moderate to high loadings on Factor 4:
Item Loading
B11: Generates creative ideas 0,694
B14: Thinks creatively 0,642
B10: Produces resourceful ideas 0,636
B2: Penetrates to the crux of problems 0,401 This factor concerns creative thinking and resourcefulness.
From the foregoing it is clear that Postulate 1 was partially supported – the full scale yielded four factors instead of three as postulated. The competencies listed in Section B of the WPQ produced two factors, viz. analytical ability and creative thinking. As expected, the obtained factors were mutually highly intercorrelated and defined a single second-order factor (cf. Tables 5 and 9). Postulate 2 was therefore supported.
The shortened scale
In order to determine the factor structure of the shortened scale (K = 32), the items were intercorrelated and subjected to a principal factor analysis.
To determine the number of factors underlying the intercorrelation matrix, the eigenvalues of the unreduced intercorrelation matrix were calculated. The obtained eigenvalues are given in Table 10.
From Table 10 it is clear that there are four eigenvalues greater than unity. Accordingly, four factors were extracted and rotated to simple structure by means of a Varimax rotation. The rotated factor matrix is given in Table 11.
From an inspection of Table 11 it is clear that there are four well-determined factors. It is evident that the communality of item 8 from Section B is rather low (0,3009). This implies that item 8 shares very little of its variance with the rest of the items. This item will probably be rejected during item analysis.
The items were accordingly classified in terms of the factor where they had their highest loading. Subscores were calculated for each participant in respect of each factor by adding the scores together of the items that have high loadings on a particular factor. These subscores were intercorrelated and subjected to a principal factor analysis.
The intercorrelations of the subscores are given in Table 12. From Table 12 it is clear that all the subscores are mutually highly intercorrelated, suggesting a single underlying second-order factor.
The eigenvalues of the unreduced intercorrelation matrix are given in Table 13. There is only one eigenvalue greater than unity; accordingly, a single factor was extracted. This factor is given in Table 14.
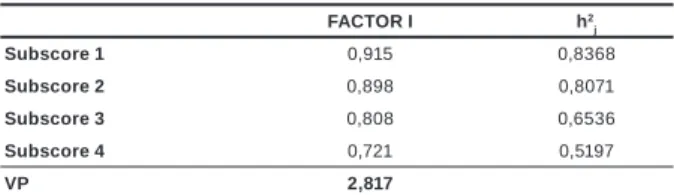
Table 14 shows that all the subscores have high loadings on this factor. It is therefore clear that the shortened form of the WPQ is essentially unidimensional. Accordingly, an item analysis of the shortened form of the WPQ was done.
The means (Xg) and standard deviations (Sg) of the various items, as well as the item-total correlations (rgx) and indices of
reliability (rgxsg), are given in Table 15. These statistics are based
on the first run before any items were eliminated.
From Table 15 it is evident that all the items have wide dispersions. The mean of the item standard deviations (excluding item 8 from Section B) is 1,538 (see Table 16). The judges were therefore able to differentiate well between the incumbents. From column five of Table 15 it is clear that each
VARIAbLES FACTOR 1
FACTOR 2
FACTOR 3
FACTOR 4
h2 j
1
W
o
rk P
e
rf
o
rm
a
n
c
e
(S
e
c
tio
n A
)
1 0,407 0,544 0,473 0,223 0,7347 2 2 0,422 0,674 0,366 0,189 0,8025 3 3 0,307 0,779 0,189 0,192 0,7744 4 4 0,397 0,753 0,109 0,285 0,8173 5 5 0,362 0,742 0,292 0,297 0,8552 6 6 0,300 0,564 0,535 0,188 0,7293 7 7 0,193 0,630 0,447 0,275 0,7095 8 8 0,316 0,183 0,588 0,136 0,4981 9 9 0,617 0,344 0,467 0,088 0,7243 10 10 0,190 0,540 0,481 0,219 0,6068
1
In
iti
a
tiv
e / C
re
a
tiv
ity
(
S
e
c
tio
n B
)
11 0,576 0,529 0,144 0,333 0,7442 2 12 0,754 0,261 0,436 0,159 0,8524 3 13 0,665 0,353 0,352 0,295 0,7776 4 14 0,650 0,194 0,403 0,216 0,6688 5 15 0,513 0,287 0,503 0,304 0,7182 6 16 0,313 0,254 0,531 0,193 0,4816 7 17 0,212 0,283 0,459 0,608 0,6822 8 18 0,023 0,111 0,237 0,481 0,3009
9 19 0,684 0,193 0,427 0,251 0,7506 10 20 0,827 0,316 0,158 0,184 0,8425 11 21 0,846 0,294 0,152 0,194 0,8629 12 22 0,490 0,379 0,282 0,385 0,6107 13 23 0,674 0,281 0,397 0,213 0,7367 14 24 0,841 0,305 0,185 0,207 0,8769 15 25 0,670 0,433 0,329 0,238 0,8001 16 25 0,612 0,249 0,220 0,154 0,5090
1 Ma
n
a
g
e
ria
l A
b
ili
tie
s
(S
e
c
tio
n C
)
27 0,408 0,397 0,113 0,576 0,6690 2 28 0,335 0,212 0,104 0,689 0,6428 4 30 0,627 0,572 0,064 0,316 0,8232 5 31 0,624 0,576 0,073 0,286 0,8077 10 36 0,348 0,689 0,381 0,222 0,7894 11 37 0,228 0,224 0,039 0,751 0,6686
Note: Items 3, 6, 7, 8, 9 and 12 were eliminated
TAbLE 11
Work performance questionnaire: (shortened scale) rotated factor matrix (varimax rotation)
SUbSCORE 1
SUbSCORE 2
SUbSCORE 3
SUbSCORE 4 Subscore 1 1,000 0,813 0,748 0,663
Subscore 2 0,813 1,000 0,729 0,657
Subscore 3 0,748 0,729 1,000 0,569
Subscore 4 0,663 0,657 0,569 1,000
TAbLE 12
Matrix of intercorrelations of subscores (shortened scale)
ROOT EIGENVALUE
1 3,0955
2 0,4475
3 0,2714
4 0,1856
Trace 4,0000 TAbLE 13
Eigenvalues of unreduced intercorrelation matrix
FACTOR I h2 j
Subscore 1 0,915 0,8368
Subscore 2 0,898 0,8071
Subscore 3 0,808 0,6536
Subscore 4 0,721 0,5197
VP 2,817
TAbLE 14
S
A J
o
u
rn
a
l of I
n
d
u
s
tr
ia
l P
s
y
c
h
o
lo
g
y
ITEM N xg Sg rgx rgxSg 1
W
o
rk P
e
rf
o
rm
a
n
c
e
(S
e
c
tio
n A
)
278 5,568 1,368 0,830 1,135 2 278 5,317 1,474 0,852 1,256 3 278 5,376 1,535 0,767 1,177
4 278 5,388 1,581 0,811 1,283 5 278 5,446 1,574 0,859 1,353 6 278 5,388 1,506 0,787 1,185 7 278 5,486 1,519 0,755 1,147 8 278 5,345 1,736 0,609 1,057 9 278 5,022 1,510 0,800 1,208 10 278 5,406 1,963 0,709 1,392
1
In
iti
a
tiv
e / C
re
a
tiv
ity
(
S
e
c
tio
n B
)
278 4,935 1,640 0,842 1,381 2 278 5,047 1,465 0,851 1,246 3 278 5,129 1,416 0,866 1,226 4 278 5,385 1,319 0,764 1,008 5 278 5,140 1,393 0,811 1,130 6 278 5,288 1,575 0,641 1,010
7 278 5,460 1,453 0,691 1,004 8 278 5,032 1,528 0,380 0,581
9 278 5,165 1,392 0,805 1,120 10 278 5,054 1,572 0,827 1,299 11 278 4,946 1,508 0,827 1,248 12 278 5,450 1,334 0,779 1,039 13 278 5,338 1,292 0,820 1,059
14 278 5,014 1,534 0,846 1,298 15 278 5,212 1,482 0,880 1,305 16 278 4,996 1,849 0,688 1,272
1 Ma
n
a
g
e
ria
l A
b
ili
tie
s
(S
e
c
tio
n C
)
278 5,119 1,604 0,747 1,199 2 278 5,353 1,667 0,643 1,072 4 278 4,957 1,654 0,853 1,411
5 278 4,788 1,681 0,848 1,425 10 278 5,590 1,514 0,834 1,262 11 278 5,288 1,556 0,578 0,900
TAbLE 15
Item statistics of shortened scale
Item Loading
C11: Person-orientated to a high degree 0,816 C2: Communicates with people at all
levels 0,700
C1: Readily adapts to changing
circumstances 0,565
B7: Knows when to consult other people 0,409
This factor is concerned with the maintenance of good interpersonal relationships and the ability to communicate with people at all levels.
The matrix of intercorrelations of the three factors is given in Table 19.
From Table 19 it is clear that a single second-order factor can be fitted to the factors of the shortened scale. The factors that were obtained correspond very closely with the factors proposed under Postulate 1. The single second-order factor presented in Table 14 is supportive of Postulate 2.
The factor structures of both the full scale and the shortened scale are well defined, and both scales have highly acceptable reliabilities (0,983 and 0,978 respectively). Postulates 3 and 4 are therefore supported.
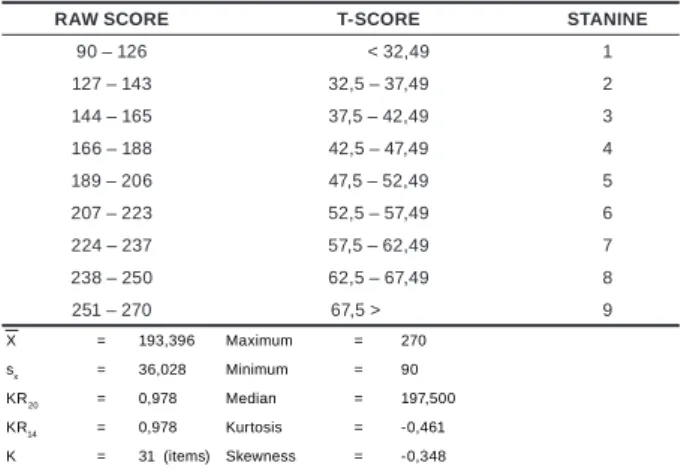
Standard scores (Flanagan, 1962) were prepared for the shortened scale after transforming the ratings of the various judges to a fixed mean (X = 193,388) and standard deviation (Sx = 37,133). The sample size of 278 was deemed adequate for item is a miniature of the scale as a whole. The mean
item-total correlation (rgx) is 0,782 (cf. Table 16). From column six of Table 16 it is clear that all the items (excluding item 8 from Section B) have high indices of reliability, the mean index being 1,198 (cf. Table 16). The reliability of the scale according to Kuder-Richardson Formulae 20 and 14 (adapted for continuous distributions) are given in the last two columns of Table 16. From this table it can be seen that the scale can be reduced to 21 items without a loss in reliability, but this could adversely affect its validity.
In order to examine the construct validity of the shortened form of the WPQ its factor matrix was rotated obliquely (Direct Oblimin). This was done for both four factors and three factors. The four-factor solution is given in Table 17 and the three-factor solution in Table 18.
From Table 17 it is clear that there are only three well-determined factors. The loadings of the fourth factor are essentially zero. The three-factor solution given in Table 18 thus offers a better fit of the factor model. The three-factor solution is accordingly interpreted.
The following variables (items) have moderate to high loadings on Factor 1:
Item Loading
B11: Generates creative ideas 0,977
B14: Thinks creatively 0,964
B10: Produces resourceful ideas 0,940
B2: Penetrates to the crux of problems 0,882
B9: Argues a matter logically 0,798
B4: Behaves astutely and intelligently 0,758 B13: Synthesises theory and practice 0,752 B16: Is considered to be an authority in some field or other 0,692
B3: Makes a big contribution to the solution of problems 0,687
A9: Final product shows evidence of study and insight 0,663
B15: Applies creative thoughts, expertise and proficiency in practice 0,662
B5: Makes sure that all facts are available before deductions are made 0,508
C4: Takes the initiative 0,507
C5: Often takes the initiative in matters 0,506
This factor relates to the incumbent’s ability to generate creative ideas and penetrate to the crux of problems in a logical and systematic way.
The following variables have moderate to high loadings on Factor 2:
Item Loading
A7: Punctual in completing work 0,863
A6: Works purposefully and systematically 0,803 A10: needs very little encouragement or supervision 0,796
C10: Is task-orientated 0,788
A3: Maintains a high work tempo 0,746
A5: Does a great deal of work 0,746
A2: Produces a lot of work of high quality 0,716 A1: Consistently produces work of high quality 0,656
A4: Is very energetic and active 0,584
This factor is essentially concerned with the quantity and quality of work produced, i.e. task orientation.
S
A J
o
u
rn
a
l of I
n
d
u
s
tr
ia
l P
s
y
c
h
o
lo
g
y
ITERATION CRITERION NUMbER
OF ITEMS Sg rgx rgxSg KR20 KR14 1 0,88 31 1,538 0,782 1,198 0,978 0,978 2 0,90 30 1,537 0,789 1,209 0,978 0,979 3 0,92 30 1,537 0,789 1,209 0,978 0,979 4 0,94 30 1,537 0,789 1,209 0,978 0,979 5 0,96 30 1,537 0,789 1,209 0,978 0,979
6 0,98 29 1,540 0,794 1,217 0,978 0,978 7 1,00 29 1,540 0,794 1,217 0,978 0,978 8 1,02 27 1,547 0,801 1,234 0,977 0,978 9 1,04 25 1,550 0,810 1,251 0,977 0,978 10 1,06 24 1,543 0,820 1,261 0,978 0,978 11 1,08 23 1,554 0,820 1,270 0,977 0,977
12 1,10 23 1,554 0,820 1,270 0,977 0,977 13 1,12 21 1,569 0,823 1,287 0,975 0,976
TAbLE 16
Means of Item Statistics (Shortened Scale)
VARIAbLES FACTOR 1
FACTOR 2
FACTOR 3
FACTOR 4
h2 j
A 1 1 0,269 0,580 0,045 0,155 0,7347 A 2 2 0,195 0,759 -0,029 0,019 0,8025 A 3 3 -0,062 0,944 -0,026 -0,144 0,7744 A 4 4 0,034 0,824 0,080 -0,245 0,8173 A 5 5 0,032 0,845 0,098 -0,064 0,8552 A 6 6 0,136 0,680 0,014 0,239 0,7293 A 7 7 -0,086 0,791 0,126 0,158 0,7095 A 8 8 0,412 0,141 0,044 0,397 0,4981 A 9 9 0,699 0,228 -0,106 0,166 0,7243 A 10 10 -0,015 0,682 0,080 0,221 0,6068 B 1 11 0,404 0,403 0,162 -0,201 0,7442 B 2 12 0,909 0,015 -0,022 0,117 0,8524 B 3 13 0,683 0,141 0,140 0,022 0,7776 B 4 14 0,789 -0,053 0,086 0,126 0,6699 B 5 15 0,558 0,138 0,190 0,244 0,7182 B 6 16 0,339 0,222 0,098 0,318 0,4816 B 7 17 0,099 0,114 0,631 0,238 0,6822 B 8 18 -0,095 0,033 0,549 0,131 0,3009
B 9 19 0,832 -0,078 0,122 0,137 0,7506 B 10 20 0,905 0,017 -0,010 -0,177 0,8425 B 11 21 0,939 -0,027 0,005 -0,182 0,8629 B 12 22 0,398 0,228 0,277 -0,014 0,6107 B 13 23 0,769 0,062 0,054 0,091 0,7367 B 14 24 0,930 -0,008 0,017 -0,155 0,8769 B 15 25 0,650 0,268 0,050 -0,017 0,8001 B 16 26 0,679 0,043 0,007 -0,042 0,5090 C 1 27 0,195 0,217 0,525 -0,174 0,6690 C 2 28 0,181 -0,052 0,724 -0,124 0,6428 C 4 29 0,432 0,435 0,124 -0,298 0,8232 C 5 30 0,434 0,453 0,087 -0,287 0,8077 C 10 31 0,083 0,807 0,020 0,045 0,7894 C 11 32 0,001 -0,008 0,819 -0,166 0,6686
TAbLE 17
Rotated factor matrix (direct oblimin) shortened scale
be extended to other positions without first doing the necessary research. Specific research was done on rating scales to try and improve their measurement properties. However, the more refined scales (BARS, BOS and MSS) did not produce better measurement properties than the normal rating scales. There was no improvement in halo errors, central tendency and leniency (Schmitt & Chan, 1998).
After the publication of Campbell et al.’s (1993) theoretical model the situation changed radically – new models were published (Viswesvaran, 1993), and several generic scales of work performance were produced (Rotundo & Sackett, 2002; nikolaou, 2003; and Bartram, 2005). Joubert et al. (2004), working in the field of organisational citizenship, produced a normative scale of organisational citizenship. A novel feature of the scale is that one can determine “where both the locus (i.e. internal versus external) of an individual’s proneness to exhibit organizational citizenship behaviour lies, as well as what motivates (i.e. seeking reward versus avoiding punishment) such behaviours” (p. 9). Organisational citizenship behaviour is of critical importance in assessing the work performance of staff: Will the workers exceed job requirements, have a positive attitude, be pro-active, take the lead, have respect for others, be trustworthy and discrete, be honest about everything, be innovative, be proud of the organisation, be ethical, frank and direct, and volunteer to help others? (p. 2).
From the foregoing it should be clear that the LOCI can be used fruitfully together with most work performance questionnaires.
preliminary norms. next, McCall (1922) T-scores and stanines were computed, which are given in Table 20.
DISCUSSION
From the literature survey it is evident that prior to 1990 there were no well-established theories of work performance or any generic scales of job performance. Job performance was largely assessed by means of in-house procedures such as rating scales, job simulation techniques, direct task observation and outcome measures. These techniques suit specific positions, but cannot
VARIAbLES FACTOR 1 FACTOR 2 FACTOR 3 h2 j A 1 1 0,246 0,656 0,009 0,7332 A 2 2 0,205 0,716 0,023 0,7906 A 3 3 0,011 0,746 0,120 0,6797 A 4 4 0,129 0,584 0,241 0,7052 A 5 5 0,072 0,746 0,180 0,8274 A 6 6 0,095 0,803 -0,049 0,7205 A 7 7 -0,106 0,863 0,098 0,7128 A 8 8 0,323 0,399 -0,117 0,3768 A 9 9 0,663 0,322 -0,162 0,7183 A 10 10 -0,048 0,796 0,020 0,5969 B 1 11 0,462 0,257 0,261 0,7094 B 2 12 0,882 0,100 -0,081 0,8421 B 3 13 0,687 0,165 0,117 0,7766 B 4 14 0,758 0,052 0,011 0,6438 B 5 15 0,508 0,321 0,062 0,6536 B 6 16 0,275 0,431 -0,040 0,4055 B 7 17 0,093 0,338 0,409 0,5206 B 8 18 -0,092 0,183 0,396 0,2156*
B 9 19 0,798 0,044 0,032 0,7167 B 10 20 0,940 -0,099 0,068 0,8193 B 11 21 0,977 -0,144 0,081 0,8424 B 12 22 0,415 0,232 0,265 0,6105 B 13 23 0,752 0,132 0,003 0,7288 B 14 24 0,964 -0,109 0,081 0,8639 B 15 25 0,662 0,247 0,066 0,8002 B 16 26 0,692 0,016 0,021 0,5095 C 1 27 0,256 0,132 0,565 0,6726 C 2 28 0,229 -0,063 0,700 0,6370 C 4 29 0,507 0,220 0,270 0,7382 C 5 30 0,506 0,240 0,234 0,7208 C 10 31 0,090 0,788 0,054 0,7850 C 11 32 0,062 -0,047 0,816 0,6759
VP 8,780 6,154 2,275 TAbLE 18