ORIGINAL ARTICLE
Validation of reference genes
for normalization of gene expression
by qRT-PCR in a resveratrol-producing
entophytic fungus (
Alternaria
sp. MG1)
Jin‑xin Che
1, Jun‑ling Shi
2*, Yao Lu
2and Yan‑lin Liu
1*Abstract
Alternaria sp. MG1, an endophytic fungus isolated from Vitis vinifera, can independently produce resveratrol, indicat‑ ing that this species contains the key genes for resveratrol biosynthesis. Identification of these key genes is essential to understand the resveratrol biosynthesis pathway in this strain, which is currently unknown in microorganisms. qRT‑PCR is an efficient and widely used method to identify the key genes related to unknown pathways at the level of gene expression. Verification of stable reference genes in this strain is essential for qRT‑PCR data normalization, although results have been reported for other Alternaria sp. strains. In this study, nine candidate reference genes including TUBA, EF1, EF2, UBC, UFD, RPS5, RPS24, ACTB and 18S were evaluated for expression stability in a diverse set of six samples representing different growth periods. We compared cell culture conditions and an optimized condition for resveratrol production. The comparison of the results was performed using four statistical softwares. A combination of TUBA and EF1 was found to be suitable for normalization of Alternaria sp. MG1 in different develop‑ mental stages, and 18S was found to be the least stable. The reference genes verified in this study will facilitate further research to explore gene expression and molecular mechanisms as well as the improvement of secondary metabolite yields in Alternaria sp. MG1. To our knowledge, this is the first validation of reference genes in Alternaria with the capa‑ bility to produce resveratrol. Additionally, these results provide useful guidelines for the selection of reference genes in other Alternaria species.
Keywords: qRT‑PCR, Reference genes, α‑Tubulin, Elongation factor 1, Alternaria sp.
© The Author(s) 2016. This article is distributed under the terms of the Creative Commons Attribution 4.0 International License (http://creativecommons.org/licenses/by/4.0/), which permits unrestricted use, distribution, and reproduction in any medium, provided you give appropriate credit to the original author(s) and the source, provide a link to the Creative Commons license, and indicate if changes were made.
Introduction
Many important bioactive compounds are widely used in medical services and health care (Khan 2016; Larsen and Matchkov 2016; Morata et al. 2015). Many of these com-pounds are either microbial metabolites or their semi-syn-thetic derivatives (Golinska et al. 2015; Sessitsch et al. 2013; Stepniewska and Kuzniar 2013). In the microbial popula-tion, endophytes are a large group which may contain mil-lions of different species, but only a minority of them have
been studied (Sessitsch et al. 2013). Several endophytic fungi (Alternaria sp.) were identified previously that are capable of independent resveratrol production (Shi et al.
2012). Although fundamental physiological research has been performed (Zhang et al. 2013a, b), the metabolic path-ways and cellular processes remain to be elucidated.
Gene expression profiling is an informative technique to investigate biological systems (Li et al. 2015). The method of qRT-PCR (quantitative real time PCR) can measure gene expression across different sample popula-tions (Derveaux et al. 2010; Wong and Medrano 2005). However, there are many factors that can influence the accuracy of the results such as the quality and quantity of mRNA templates or amplification efficiency. Gener-ally, normalizing expression of the target genes to one or
Open Access
*Correspondence: [email protected]; [email protected]
1 College of Food Science and Engineering, Northwest A & F University,
28 Xinong Road, Yangling 712100, Shaanxi, People’s Republic of China
2 Key Laboratory for Space Biosciences and Space Biotechnology, School
several reference genes provide an efficient way to reduce these effects and increase the relevance of the results (Huggett et al. 2005; Marabita et al. 2016). However, the use of inappropriate reference genes that change expres-sion levels under different conditions can cause interpre-tation errors. Thus, the choice of appropriate reference genes for normalization is a prerequisite for qRT-PCR assay.
In recent years, validation of reliable reference genes before their use for normalization has been performed for many species, such as Talaromyces marneffei (Dankai et al. 2015), Staphylococcus aureus (Sihto et al. 2014),
Beauveria bassiana (Zhou et al. 2012), Oenococcus oeni
(Sumby et al. 2012) and others. Commonly used reference genes for these fungi include the genes encoding the 18S
ribosomal RNA (18S), ubiquitin fusion degradation pro-tein (UFD), ribosomal protein (RPS), elongation factor (EF), β-actin (ACTB), α-tubulin (TUBA), ubiquitin-con-jugating enzyme (UBC), and glyceraldehyde-3-phosphate dehydrogenase (GAPDH) (Kozera and Rapacz 2013). The previously reported reference genes for normaliz-ing qRT-PCR data in fungi, especially in Alternaria sp. are β-tubulin (TUB) for A. alternata (Baez-Flores et al.
2011; Buzina et al. 2008) and A. brassicicola (Sellam et al.
2006), benA for A. alternata (Saha et al. 2012), 18S for
A. infectoria (Fernandes et al. 2014), and elongation fac-tor 1 (EF1) for A. brassicicola (Cho et al. 2014). Genes that show stable expression under many conditions may differ in microorganisms due to different organization structures and when different genes are expressed. There-fore, it is necessary to identify reliable reference genes in
Alternaria sp. MG1 for use in qRT-PCR assay.
The aim of this study was to identify the most stable reference genes in Alternaria sp. under different growth conditions and resveratrol production conditions. Genes that show relatively similar levels of expression under all conditions could serve as reference genes that would be appropriate for comparison in the qRT-PCR assay of genes whose expression may vary during changes in metabolism or during resveratrol biosynthesis. Several software applications were used for analysis of candidate reference genes. These programs allowed evaluation of appropriate reference genes under given experimental conditions using statistical methods, such as Bestkeeper (Pfaffl et al. 2004), geNorm (Vandesompele et al. 2002), and Normfinder (Andersen et al. 2004).
Materials and methods Microorganism
Alternaria sp. MG1 (code: CCTCC M 2011348), a strain previously isolated from the cob of Merlot grape (Shi et al. 2012), was used in the study. It was maintained at the China Center for Type Culture Collection (Wuhan,
China). For preparation of Alternaria sp. MG1 cells, the strain was inoculated into a 250-mL flask containing 100 mL PDB (liquid potato-dextrose broth, pot,ato 200 g with 20 g glucose in 1000 mL tap-water). The cultivation was carried out at 28 °C and 120 rpm in a rotary shaker. According to the growth curve analysis (Additional file 1: Figure S1), the cells were collected at points through-out lag phase, logarithmic growth phase, and station-ary phase after a cultivation of 2, 3, 4, 5 and 6 days by centrifugation at 1136×g for 10 min at 4 °C (HC-3018R, Anhui USTC Zonkia Scientific Instruments Co., Ltd., Anhui, China). Next, the collected cells were washed twice with sterile water and immediately stored in liquid nitrogen until further analysis. The resting cells were col-lected using the method reported by Zhang et al. (2013a) as follows: after cultivation for 4 days, the rinsed cells were resuspended in 0.2 mol/L pH 7.0 phosphate buffer containing 0.1 g/L MgSO4, 0.2 g/L CaSO4 and 4 mmol/L
phenylalanine for 21 h. After that, cells were washed twice with sterile water and stored for further analysis.
Total RNA extraction and cDNA synthesis
Extraction of the total RNA from the cells was performed using a Spin Column Fungal total RNA Purification Kit (Sangon Biotech (Shanghai) Co., Ltd., China). Quality and quantity of the RNA extraction were analyzed using a NanoDrop 2000 Spectrophotometer (Thermo Scien-tific, Waltham, Massachusetts, USA) gel electrophore-sis, and Agilent 2100 Bioanalyzer (Agilent Technologies, PaloAlto, California, USA). First-strand cDNA was syn-thesized using a PrimeScript™ RT reagent Kit with gDNA Eraser (Perfect Real Time) in strict accordance with the manufacturer’s operation manual (TAKARA Biotech-nology (Dalian) CO., LTD., China). The cDNA products were diluted fivefold and stored at −20 °C before further analysis.
Primer design of reference genes and qRT‑PCR amplification conditions
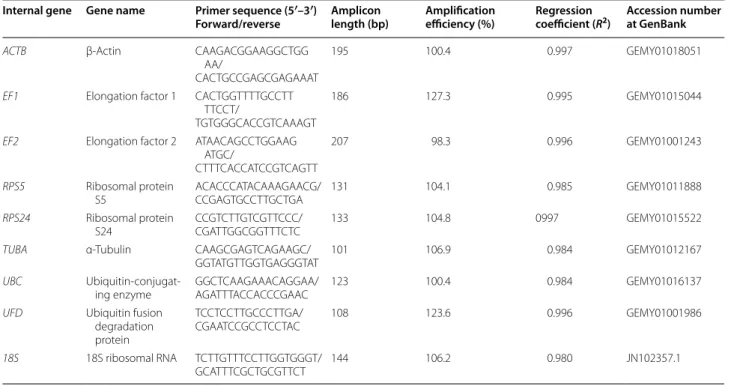
The nine candidate genes (Table 1), ACTB, EF1, EF2,
RPS5, RPS24, TUBA, UBC, UFD and 18S were selected based on the transcriptome database of Alternaria sp. MG1 (available through NCBI, SRA study accession number SRP060338) (Che et al. 2016b). The internal ref-erence genes had highly similar sequences with reported genes from previous studies (DiGuistini et al. 2011; Fara-jalla and Gulick 2007; Goodwin et al. 2011; Skora et al.
2015). The primer pairs of candidate genes were designed using the software Primer Premier (version 5.00) (http:// www.premierbiosoft.com/primerdesign/index.html) with an amplicon length ranging from 100 to 300 bp.
Real-Time PCR Detection System (Bio-Rad Laboratories, Inc., Hercules, California, USA) with the iQ™5 Optical
system Software Version 2.1. (http://www.bio-rad.com/ zh-cn/sku/1709753-iq5-optical-system-software?pare ntCategoryGUID=2). A total reaction system of 25 μL
contained SYBR Premix Ex TaqII (Tli RNase Plus) (2×
Conc.), 12.5 μL; PCR primer mix (10 μM), 2 μL; cDNA template, 1 μL; and DNase-free water, 9.5 μL. The qRT-PCR amplification program was 95 °C for 5 min, followed by 40 cycles of 94 °C for 30 s, the ideal annealing temper-ature for each primer pair for 30 s, and 72 °C for 1 min, and then 72 °C for 10 min. All reactions were conducted in triplicate and melting curve analysis was performed. The correlation coefficients (R2) and slope values of the
standard curve and efficiency (E) were calculated using the iQ 5 Optical system Software Version 2.1.
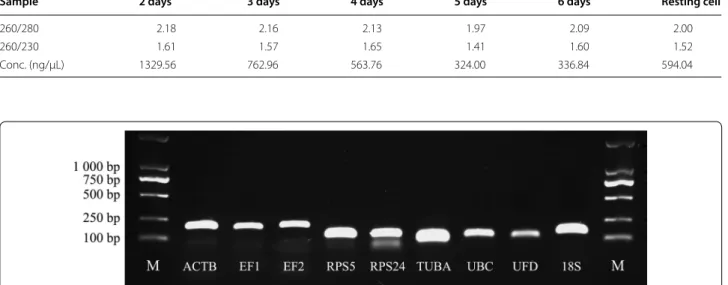
To confirm the accuracy of the amplified products, all the PCR products were analyzed by agarose gel elec-trophoresis using 2% agarose gels in Tris-borate-EDTA (TBE) buffer stained with ethidium bromide.
Determination of reference gene expression stability using data analysis software
The transcript abundance of the reference genes was determined by the Ct value. The expression stability of these candidate reference genes were evaluated using the four methods described below. The methods are Excel-based tool—Bestkeeper software (version 1) (http://
bioinformatics.gene-quantification.info/bestkeeper. html)using pair-wise correlations (Pfaffl et al. 2004), Genorm software (version 3.4) (https://genorm.cmgg. be/) (Vandesompele et al. 2002), NormFinder software (version 0.953) (http://moma.dk/normfinder-software/)
(Andersen et al. 2004), and the comparative ∆Ct method (Pfaffl 2001; Silver et al. 2006). To comprehensively ana-lyze the stability of these candidate genes, the web tool RefFinfer (http://fulxie.0fees.us/?type=reference) (Xie
et al. 2012) was used to compare and rank the outcomes of the results using the different analysis programs.
Results
RNA purity and concentration
The mean values of quantity and quality of the RNA sam-ples are shown in Table 2. The concentrations of RNA samples ranged from 324.00 to 1329.56 ng/μL. The mean values of 260/280 were close to 2.00.
Verification of primer specificity of selected reference genes
A total of nine candidate genes (Table 1) were selected for this study by referring to previous studies (DiGu-istini et al. 2011; Farajalla and Gulick 2007; Goodwin et al. 2011; Skora et al. 2015) and the Alternaria sp. MG1 transcriptome database. Agarose gel electropho-resis for preliminary PCR and melting curve analysis was performed and the results are shown in Fig. 1 and
Table 1 Relation of primers for the candidate genes to internal control
Internal gene Gene name Primer sequence (5′–3′)
Forward/reverse Amplicon length (bp) Amplification efficiency (%) Regression coefficient (R2) Accession number at GenBank
ACTB β‑Actin CAAGACGGAAGGCTGG AA/
CACTGCCGAGCGAGAAAT
195 100.4 0.997 GEMY01018051
EF1 Elongation factor 1 CACTGGTTTTGCCTT TTCCT/
TGTGGGCACCGTCAAAGT
186 127.3 0.995 GEMY01015044
EF2 Elongation factor 2 ATAACAGCCTGGAAG ATGC/
CTTTCACCATCCGTCAGTT
207 98.3 0.996 GEMY01001243
RPS5 Ribosomal protein
S5 ACACCCATACAAAGAACG/CCGAGTGCCTTGCTGA 131 104.1 0.985 GEMY01011888 RPS24 Ribosomal protein
S24 CCGTCTTGTCGTTCCC/CGATTGGCGGTTTCTC 133 104.8 0997 GEMY01015522 TUBA α‑Tubulin CAAGCGAGTCAGAAGC/
GGTATGTTGGTGAGGGTAT 101 106.9 0.984 GEMY01012167 UBC Ubiquitin‑conjugat‑
ing enzyme GGCTCAAGAAACAGGAA/AGATTTACCACCCGAAC 123 100.4 0.984 GEMY01016137 UFD Ubiquitin fusion
degradation protein
TCCTCCTTGCCCTTGA/
CGAATCCGCCTCCTAC 108 123.6 0.996 GEMY01001986
18S 18S ribosomal RNA TCTTGTTTCCTTGGTGGGT/
Additional file 1: Figure S1, respectively. We observed that the lengths of amplified fragment were consist-ent with the expected size, and no primer dimers were detected except for candidate gene RPS24. These results indicated the primers were specific and suitable for ref-erence gene validation.
PCR efficiency analysis was performed to validate the optimal of the reference gene. The regression coef-ficient (R2 value) and PCR amplification efficiency were
calculated by a standard curve generated using tenfold serial dilutions of pooled cDNA. The PCR amplification efficiency of these candidate genes ranged from 98.3 to 127.3%, and the regression coefficient (R2 value) of the
standard curve ranged from 0.980 to 0.997, well within the acceptable range of qRT-PCR (Table 1).
Expression profiling of the candidate reference genes
Six samples were chosen for each candidate reference gene in this study.
The average expression of the candidate genes during different growth stages was investigated by compari-son of Ct values and the results are shown as a box-plot (Fig. 2). In the figure, the interquartile values are shown in boxes. The median expression level and the total expression level are shown as a line and whisker, respec-tively. The expression level of the nine reference genes with Ct value ranged from 14.22 to 25.66. Lower Ct val-ues indicate higher expression level and vice versa. The
18S gene showed the highest expression level, and the
EF1 was the lowest. There was little difference among the other candidate reference genes with Ct values between
20.24 and 23.38. Genes that showed different ranges of expression (Ctmax−Ctmin) were ACTB (1.52), EF1 (0.91),
EF2 (2.55), RPS5 (2.19), RPS24 (3.48), TUBA (1.33), UBC
(2.52), UFD (3.13), and 18S (5.64).
Stability evaluation of candidate genes using different analysis programs
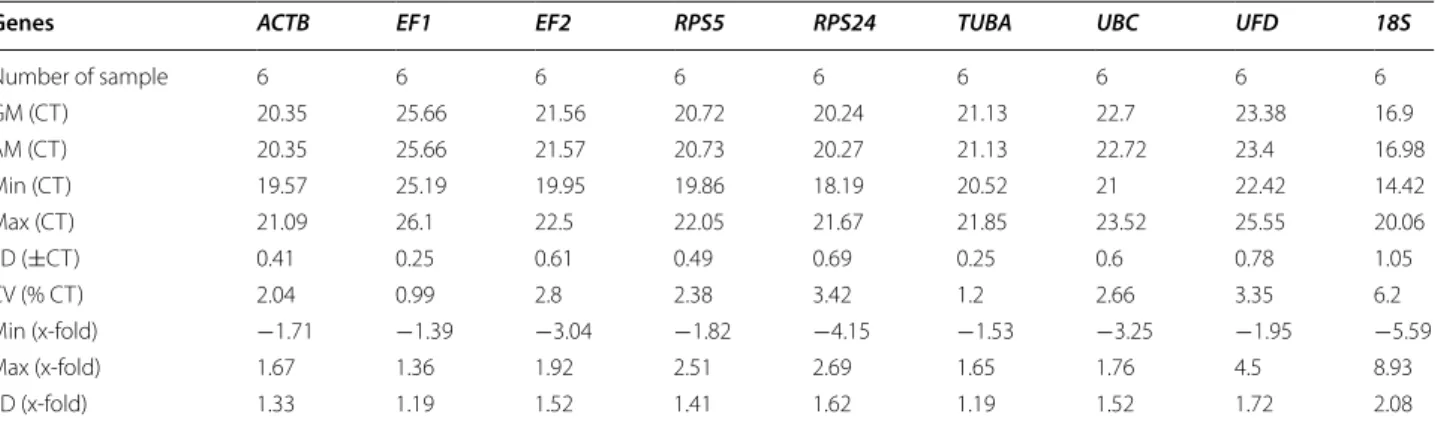
To validate the stability of these nine candidate genes, we used four evaluation methods. The Bestkeeper software was employed to validate and rank the stability evalu-ation of these candidate genes based on the standard deviation (SD) of Ct values and the coefficient of variance (CV) expressed as a percentage of the Ct values. In this approach, the most stable reference gene was identified by the comparison of SD value and CV value of these selected genes. The lowest SD and CV values represent the genes with a highest stability, and vice versa. Here, the descriptive statistics of these nine candidate genes were calculated based on the Ct values, and the statistical outcome is listed in Table 3.
The geometric mean (GM), arithmetic mean (AM), extremum (min and max) value, standard deviation (SD), and coefficient of variation (CV), were calculated. Sorted by SD values, the tested genes were in the order of EF1 < TUBA < ACTB < RPS5 < UBC < EF2 < RPS24 < UFD <
18S. The overall variation of EF1 and TUBA were lowest with a SD value of 0.25. The CV values of EF1 and TUBA
were lower than the others, 0.99 and 1.2%, respectively. Interrelated analysis provided by BestKeeper concluded that the most stable reference gene was EF1, and TUBA
was the second most stable.
Table 2 The quantity and quality of RNA samples isolated from Alternaria sp. MG1 during different growth stages
Sample 2 days 3 days 4 days 5 days 6 days Resting cell
260/280 2.18 2.16 2.13 1.97 2.09 2.00
260/230 1.61 1.57 1.65 1.41 1.60 1.52
Conc. (ng/μL) 1329.56 762.96 563.76 324.00 336.84 594.04
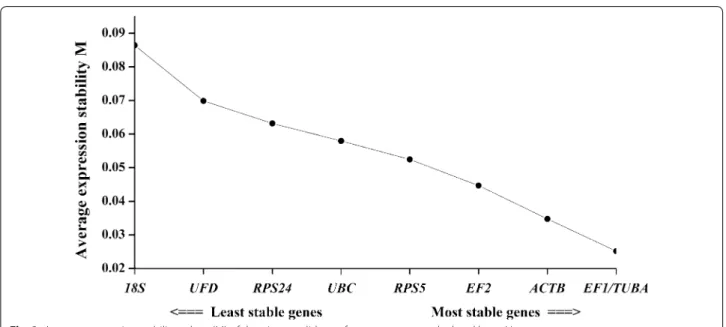
Another program, geNorm (Vandesompele et al.
2002), was used to calculate the average expression sta-bility of M value and analyze the stasta-bility of the can-didate reference genes. The calculated M values of the nine candidate reference genes are plotted in Fig. 3. The most stable expression genes had the lowest M value, and vice versa. Previous studies (Vandesompele et al.
2002; Wu et al. 2014), suggested selection of stable ref-erence genes with M values below the threshold of 1.5. As shown in Fig. 3, all the M values of the tested genes were less than 1.5. In the growth stage and the resting cells, the EF1 and TUBA showed the highest expression stability with the lowest M values (0.025). Sometimes, normalization with a single reference may produce sig-nificant errors and the more than one reference genes may be needed in some experiments. However, some
researchers (Kong et al. 2015; Li et al. 2015) have indi-cated that multiple reference genes could increase instability and experimental complexity. Thus, pair-wise variation (Vn/Vn + 1) was selected for assessing the optimal number of reference genes. The pairwise variation V value was calculated using geNorm, and a threshold V value of 0.15 was recommended to identify the number of the additional reference genes (Vandes-ompele et al. 2002). In Fig. 4, all the V values were below the cutoff value of 0.15. Pairwise variation analysis showed that the V2/3 value was 0.0126, which indicated two reference genes was sufficient for gene expression normalization and the two stability reference genes selected were EF1 and TUBA.
In an alternate approach, we used the Normfinder software program to evaluate these candidate reference
Fig. 2 Expression profiling of nine reference genes in the experimental set of Alternaria sp. MG1. Box represents 25/75 percentiles, whisker cap represents 10/90, the line in the box shows the median, and the dot indicates outlier of min and max value
Table 3 CT data of reference genes calculated using Bestkeeper
Genes ACTB EF1 EF2 RPS5 RPS24 TUBA UBC UFD 18S
Number of sample 6 6 6 6 6 6 6 6 6
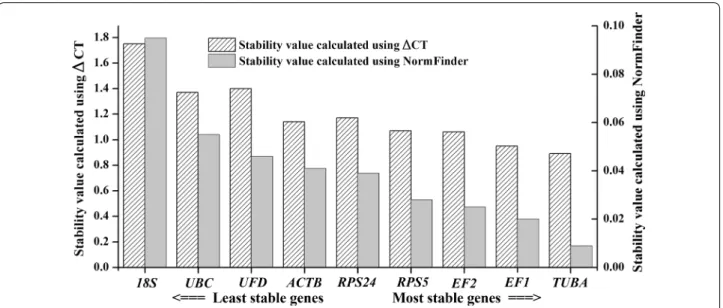
genes. As a model-based variance estimation approach, Normfinder is used to calculate stability values and evaluate the expression stabilities of the tested genes (Andersen et al. 2004; Maroufi et al. 2010). A lower aver-age expression stability indicated genes that were stably expressed gene. In Fig. 5, the stability value ranking of these candidate reference genes was slightly different from that calculated by geNorm software. However, the most stable reference gene was the same (TUBA), fol-lowed by EF1, EF2, RPS5, RPS24, ACTB, UFD, UBC and
18S. The comparative ΔCt method was used to assess gene expression stability. The stability results were the same as those calculated using Normfinder software, and these results are shown together in Fig. 5. Again, the most stable reference gene was TUBA.
Overall ranking order and selection of optimal reference genes
In the separate assessments, the most stable reference gene was the same, but the other genes were ranked dif-ferently in the different analyses. Next, we used the web tool (RefFinder) to arrange the comprehensive results by integration of the results of the four assessments to com-pare these potential reference genes. An overview of the expression stability of the nine candidate genes from dif-ferent growing stages and difdif-ferent treatment of Alter-naria sp. MG1 are shown in Fig. 6. The ranking of these candidate reference genes (from most stable to least sta-ble) were TUBA, EF1, EF2, ACTB, RPS5, RPS24, UBC,
UFD, and 18S.
Discussion
As a bioactive polyphenol, resveratrol has a variety of functions, such as preventing or slowing the occur-rence of cancer, acting as a powerful antioxidant, and extending life span. Pharmaceutical production and functional food processing present a high demand of resveratrol. To date, resveratrol was provided by extrac-tion from plant materials. This method of producextrac-tion is highly limited by plant growth times and low yields. Many resveratrol-producing Escherichia coli or yeasts have been constructed by genetic modification (Conrado et al. 2012; Krivoruchko and Nielsen 2015). However, these processes have low yield and have stability issues during production due to the use of the plant-derived genes. The problem of low yield results from a compli-cated metabolic pathway and a rate-limited enzyme. In a previous study, resveratrol production was increased
Fig. 3 Average expression stability values (M) of the nine candidate reference genes as calculated by geNorm
slightly by adding substrates or production in Alternaria
sp. MG1 resting cell culture (Zhang et al. 2013b). Thus, understanding the expression of the genes involved in resveratrol biosynthesis pathway is the key problem to be solved. As a newly characterized biological resource,
Alternaria sp. MG1 is able to produce resveratrol with-out limitation from plant resources (Che et al. 2016a; Shi et al. 2012). Study of this fungus may allow insight into the necessary pathways allowing engineering for increased production.
With several advantages, including the ability to quan-tify, reproducibility, sensitivity and accuracy, qRT-PCR is a preferred method to use for quantifying the gene expression, and assessing mRNA levels among differ-ent samples. Validation of appropriate reference genes is a prerequisite for accurate analysis of gene expression using qRT-PCR (Li et al. 2016). In the past research, the most traditional reference genes used in qRT-PCR assay were genes such as ACT, TUB, and 18S. In the past, many studies showed that the expression of these traditional
Fig. 5 Stability values of the nine candidate reference genes as calculated using ΔCt and NormFinder
reference genes was not always stable under all condi-tions (Dankai et al. 2015; Zhou et al. 2012). The identi-fication of the most stable reference genes in Alternaria
sp. MG1 has not been achieved until now, although some traditional reference genes have been used for qRT-PCR data normalization in some other Alternaria sp. (Dankai et al. 2015; Sihto et al. 2014).
Several methods have been recently used to deter-mine the stability of gene expression and to validate the best reference genes (Tong et al. 2009). However, there is no consensus on the ideal approach that should be used to examine the stability of reference gene expres-sion. The pairwise comparison strategy, accessible through the geNorm software, is a very popular option to verify the expression stability of candidate genes (Yu et al. 2016). However, co-regulated genes may confound the geNorm software and his would lead to an errone-ous choice of optimum normalizer pair (Andersen et al.
2004). To investigate whether the potential co-regulated genes affected the outcome of the results, researchers removed one of the co-regulated genes from analysis and reported that co-regulation did not influence the rank-ing of reference genes by stability (Tong et al. 2009); we similarly found no effect on the ranking by the inclu-sion of co-regulated genes (Additional file 1: Figure S2). Additionally, the reference genes that belonged to the same functional class were not top-ranked and did not occupy closed positions by geNorm software in previ-ous studies (Exposito-Rodriguez et al. 2008). Similarly, the co-regulated genes were not top-ranked and did not occupy closed positions in this research. As a result, use of these two pairs of co-regulated genes did not affect the final ranking of the reference genes by using geNorm software. Other methods such as NormFinder and Best-Keeper, were reported to be less sensitive to co-regula-tion, and might serve as appropriate statistical applets to further assess the stability for reference gene expression (Huang et al. 2014). In an effort to ensure the accuracy of the reference gene stability ranking and minimize bias introduced by the validation approach, four different statistical approaches, ∆Ct, geNorm, NormFinder, and BestKeeper, were used to identify the suitable reference genes for accurate normalization in this study. The over-all ranking of these four approaches was integrated using a web-based comprehensive tool (RefFinder) developed to identify the most reliable reference genes by integrat-ing these four evaluation methods (Xie et al. 2012).
Nine traditional reference genes (TUBA, UFD, RPS24,
RPS5, UBC, EF1, EF2, ACTB and 18S) were selected as candidate reference genes, and these genes were tested during different growth periods and during an optimized condition for resveratrol production. Different statisti-cal algorithms and analytistatisti-cal methods gave different
validation results. The overall ranking of these results was integrated using the RefFinder system. The comprehen-sive results of this research demonstrated that TUBA and
EF1 were the most stable reference genes, 18S was the least stable gene, and the other candidate reference genes were intermediate among all six sets of experiments. Interestingly, TUBA was shown to be a reliable reference gene for Penicillium expansum (De Clercq et al. 2016) and Valsa mali var. mali (Vmm) (Yin et al. 2013), and
EF1 was found to be suitable for Clonostachys rosea (Sun et al. 2015) and Tuber melanosporum (Cesare et al. 2015). However, TUBA and EF1 were unstable and unsuit-able for use as reference genes in Blumeria graminis
(Pennington et al. 2016), C. rosea (Sun et al. 2015), and
Pandora neoaphidis (Chen et al. 2016). Other candidate reference genes showed different stability in different fungi. For example, the most stable reference gene for
Talaromyces marneffei was GAPDH, followed by TUBA, and ACTB (Dankai et al. 2015). ACTB was identified as the reliable reference gene in Penicillium echinulatum
(Zampieri et al. 2014).
Additionally, normalization with the combination of more genes resulted in improved accuracy. Previous research indicated the application of individual or com-binations of 2, 3, and 4 reference genes would result in different levels of abundance, but qualitatively similar patterns (Hu et al. 2009). How many reference genes should be used is dependent on the purpose of research. One reference gene would be enough to show a rough expression mode of genes, if the reference gene was iden-tified as a stable expressed gene (Cho et al. 2014). Nev-ertheless, if the research purpose is to compare gene expression levels among different samples or to get an accurate expression level, the more reference genes used, the more accurate the result is. However, other researches have reported that multiple reference genes could increase instability and experimental complexity (Kong et al. 2015; Li et al. 2015). Thus, pairwise variation (Vn/Vn + 1) was selected to assess the optimal number of reference genes. The pairwise variation V value was calculated using geNorm, and a threshold V value of 0.15 was recommended to identify the number of the addi-tional reference genes (Sumby et al. 2012; Vandesompele et al. 2002). In this study, pairwise variation analysis (Fig. 4) showed that the V2/3 value was 0.0126, which indicated that two reference genes was sufficient for gene expression normalization and the two stability reference genes selected were EF1 and TUBA.
for future research to explore gene expression, molecular mechanisms, and improvement of secondary metabolite yields in Alternaria sp. MG1. To our knowledge, this was the first validation of reliable reference genes in Alter-naria. The results of this study provide useful guidelines for the selection of reference genes in other Alternaria
species.
Authors’ contributions
Planning and designing of study: JXC, JLS, YLL; experimentation: JXC, YL; result analysis: JXC, YL; manuscript drafting: JXC, JLS, YL. All authors contributed in the final approval of manuscript. All authors read and approved the final manuscript.
Acknowledgements
A special thanks to Cheng‑quan Yang and Yao‑hua You (College of Horticul‑ ture, Northwest A & F University) for their support and help with this research.
Competing interests
The authors declare that they have no competing interests.
Ethics approval
This article does not contain any studies with human participants or animals performed by any of the author.
Funding
This study was funded by the National Natural Science Fund (Grant No. 31471718), the Agriculture Department of China (Grant No. CARS‑30), and the Northwestern Polytechnical University (No. 201410699086 and No. 3102014GEKY1010).
Received: 31 October 2016 Accepted: 31 October 2016
References
Andersen CL, Jensen JL, Orntoft TF (2004) Normalization of real‑time quantita‑ tive reverse transcription‑PCR data: a model‑based variance estimation approach to identify genes suited for normalization, applied to bladder and colon cancer data sets. Cancer Res 64(15):5245–5250
Baez‑Flores ME, Troncoso‑Rojas R, Osuna MAI, Dominguez MR, Pryor B, Tiznado‑Hernandez ME (2011) Differentially expressed cDNAs in Alter-naria alternata treated with 2‑propenyl isothiocyanate. Microbiol Res 166(7):566–577
Buzina W, Raggam RB, Paulitsch A, Heiling B, Marth E (2008) Characterization and temperature‑dependent quantification of heat shock protein 60 of the immunogenic fungus Alternaria alternata. Med Mycol 46(6):627–630 Cesare P, Cesare P, Ragnelli AM, Aimola P, Leonardi M, Bonfigli A, Colafarina S,
Poma AM, Miranda M, Pacioni G (2015) Validation of reference genes for quantitative real‑time PCR in Perigord black truffle (Tuber melanosporum) developmental stages. Phytochemistry 116:78–86
Che J, Shi J, Gao Z, Zhang Y (2016a) A new approach to produce resveratrol by enzymatic bioconversion. J Microbiol Biotech 26(8):1348–1357 Che J, Shi J, Gao Z, Zhang Y (2016b) Transcriptome analysis reveals the genetic
basis of the resveratrol biosynthesis pathway in an endophytic fungus (Alternaria sp. MG1) isolated from vitis vinifera. Front Microbiol 7(1257):12 Additional file
Additional file 1.Figure S1. The growth curve of Alternaria sp. MG1 in liquid potato‑dextrose broth (PDB) at 28 °C and 120 rpm. Figure S2. Aver‑ age expression stability values (M) of reference genes removed one of the coregulated genes as calculated by geNorm.
Chen C, Xie TN, Ye SD, Jensen AB, Eilenberg J (2016) Selection of reference genes for expression analysis in the entomophthoralean fungus Pandora neoaphidis. Braz J Microbiol 47(1):259–265
Cho Y, Ohm RA, Devappa R, Lee HB, Grigoriev IV, Kim BY, Ahn JS (2014) Tran‑ scriptional responses of the Bdtf1‑deletion mutant to the phytoalexin brassinin in the necrotrophic fungus Alternaria brassicicola. Molecules 19(8):10717–10732
Conrado RJ, Wu GC, Boock JT, Xu HS, Chen SY, Lebar T, Turnsek J, Tomsic N, Avbelj M, Gaber R, Koprivnjak T, Mori J, Glavnik V, Vovk I, Bencina M, Hodnik V, Anderluh G, Dueber JE, Jerala R, DeLisa MP (2012) DNA‑guided assembly of biosynthetic pathways promotes improved catalytic effi‑ ciency. Nucleic Acids Res 40(4):1879–1889
Dankai W, Pongpom M, Vanittanakom N (2015) Validation of reference genes for real‑time quantitative RT‑PCR studies in Talaromyces marneffei. J Microbiol Methods 118:42–50
De Clercq N, Vlaemynck G, Van Pamel E, Van Weyenberg S, Herman L, Dev‑ lieghere F, De Meulenaer B, Van Coillie E (2016) Isoepoxydon dehydroge‑ nase (idh) gene expression in relation to patulin production by Penicillium expansum under different temperature and atmosphere. Int J Food Microbiol 220:50–57
Derveaux S, Vandesompele J, Hellemans J (2010) How to do successful gene expression analysis using real‑time PCR. Methods 50(4):227–230 DiGuistini S, Wang Y, Liao NY, Taylor G, Tanguay P, Feau N, Henrissat B, Chan SK,
Hesse‑Orce U, Alamouti SM, Tsui CKM, Docking RT, Levasseur A, Haridas S, Robertson G, Birol I, Holt RA, Marra MA, Hamelin RC, Hirst M, Jones SJM, Bohlmann J, Breuil C (2011) Genome and transcriptome analyses of the mountain pine beetle‑fungal symbiont Grosmannia clavigera, a lodge‑ pole pine pathogen. Proc Natl Acad Sci USA 108(6):2504–2509 Exposito‑Rodriguez M, Borges AA, Borges‑Perez A, Perez JA (2008) Selection
of internal control genes for quantitative real‑time RT‑PCR studies during tomato development process. BMC Plant Biol 8:12
Farajalla MR, Gulick PJ (2007) The α‑tubulin gene family in wheat (Triticum aestivum L.) and differential gene expression during cold acclimation. Genome 50(5):502–510
Fernandes C, Anjos J, Walker LA, Silva BMA, Cortes L, Mota M, Munro CA, Gow NAR, Goncalves T (2014) Modulation of Alternaria infectoria cell wall chitin and glucan synthesis by cell wall synthase inhibitors. Antimicrob Agents Chemother 58(5):2894–2904
Golinska P, Wypij M, Agarkar G, Rathod D, Dahm H, Rai M (2015) Endophytic actinobacteria of medicinal plants: diversity and bioactivity. Anton Leeuw Int J G 108(2):267–289
Goodwin SB, Ben M’Barek S, Dhillon B, Wittenberg AHJ, Crane CF, Hane JK, Foster AJ, Van der Lee TAJ, Grimwood J, Aerts A, Antoniw J, Bailey A, Bluhm B, Bowler J, Bristow J, van der Burgt A, Canto‑Canche B, Churchill ACL, Conde‑Ferraez L, Cools HJ, Coutinho PM, Csukai M, Dehal P, De Wit P, Donzelli B, van de Geest HC, Van Ham R, Hammond‑Kosack KE, Henrissat B, Kilian A, Kobayashi AK, Koopmann E, Kourmpetis Y, Kuzniar A, Lindquist E, Lombard V, Maliepaard C, Martins N, Mehrabi R, Nap JPH, Ponomarenko A, Rudd JJ, Salamov A, Schmutz J, Schouten HJ, Shapiro H, Stergiopoulos I, Torriani SFF, Tu H, de Vries RP, Waalwijk C, Ware SB, Wiebenga A, Zwiers LH, Oliver RP, Grigoriev IV, Kema GHJ (2011) Finished genome of the fungal wheat pathogen Mycosphaerella graminicola reveals dispensome struc‑ ture, chromosome plasticity, and stealth pathogenesis. PLoS Genet 7(6):17 Hu RB, Fan CM, Li HY, Zhang QZ, Fu YF (2009) Evaluation of putative reference
genes for gene expression normalization in soybean by quantitative real‑ time RT‑PCR. BMC Mol Biol 10:12
Huang LK, Yan HD, Jiang XM, Zhang Y, Zhang XQ, Ji Y, Zeng B, Xu B, Yin GH, Lee S, Yan YH, Ma X, Peng Y (2014) Reference gene selection for quantitative real‑time reverse‑transcriptase PCR in orchardgrass subjected to various abiotic stresses. Gene 553(2):158–165
Huggett J, Dheda K, Bustin S, Zumla A (2005) Real‑time RT‑PCR normalisation; strategies and considerations. Genes Immun 6(4):279–284
Khan MZ (2016) A possible significant role of zinc and GPR39 zinc sensing receptor in Alzheimer disease and epilepsy. Biomed Pharmacother 79:263–272
Kong FN, Cao M, Sun PP, Liu WX, Mao YX (2015) Selection of reference genes for gene expression normalization in Pyropia yezoensis using quantitative real‑time PCR. J Appl Phycol 27(2):1003–1010
Krivoruchko A, Nielsen J (2015) Production of natural products through meta‑ bolic engineering of Saccharomyces cerevisiae. Curr Opin Biotech 35:7–15 Larsen MK, Matchkov VV (2016) Hypertension and physical exercise: the role of
oxidative stress. Med Lith 52(1):19–27
Li XY, Cheng JY, Zhang J, da Silva JAT, Wang CX, Sun HM (2015) Validation of reference genes for accurate normalization of gene expression in Lilium davidii var. unicolor for real time quantitative PCR. PLoS ONE 10(10):17 Li MY, Wang F, Jiang Q, Wang GL, Tan C, Xiong AS (2016) Validation and
comparison of reference genes for qPCR normalization of Celery (Apium graveolens) at different development stages. Front Plant Sci 7:12 Marabita F, de Candia P, Torri A, Tegner J, Abrignani S, Rossi RL (2016) Normali‑
zation of circulating microRNA expression data obtained by quantitative real‑time RT‑PCR. Brief Bioinform 17(2):204–212
Maroufi A, Van Bockstaele E, De Loose M (2010) Validation of reference genes for gene expression analysis in chicory (Cichorium intybus) using quantita‑ tive real‑time PCR. BMC Mol Biol 11:12
Morata L, Mensa J, Soriano A (2015) New antibiotics against gram‑positives: present and future indications. Curr Opin Pharmacol 24:45–51
Pennington HG, Li LH, Spanu PD (2016) Identification and selection of normali‑ zation controls for quantitative transcript analysis in Blumeria graminis. Mol Plant Pathol 17(4):625–633
Pfaffl MW (2001) A new mathematical model for relative quantification in real‑ time RT‑PCR. Nucleic Acids Res 29(9):6
Pfaffl MW, Tichopad A, Prgomet C, Neuvians TP (2004) Determination of stable housekeeping genes, differentially regulated target genes and sample integrity: BestKeeper—excel‑based tool using pair‑wise correlations. Biotechnol Lett 26(6):509–515
Saha D, Fetzner R, Burkhardt B, Podlech J, Metzler M, Dang H, Lawrence C, Fischer R (2012) Identification of a polyketide synthase required for alter‑ nariol (AOH) and alternariol‑9‑methyl ether (AME) formation in Alternaria alternata. PLoS ONE 7(7):14
Sellam A, Poupard P, Simoneau P (2006) Molecular cloning of AbGst1 encod‑ ing a glutathione transferase differentially expressed during exposure of Alternaria brassicicola to isothiocyanates. FEMS Microbiol Lett 258(2):241–249
Sessitsch A, Kuffner M, Kidd P, Vangronsveld J, Wenzel WW, Fallmann K, Puschenreiter M (2013) The role of plant‑associated bacteria in the mobi‑ lization and phytoextraction of trace elements in contaminated soils. Soil Biol Biochem 60:182–194
Shi JL, Zeng Q, Liu YL, Pan ZL (2012) Alternaria sp. MG1, a resveratrol‑producing fungus: isolation, identification, and optimal cultivation conditions for resveratrol production. Appl Microbiol Biotechnol 95(2):369–379 Sihto HM, Tasara T, Stephan R, Johler S (2014) Validation of reference genes for
normalization of qPCR mRNA expression levels in Staphylococcus aureus
exposed to osmotic and lactic acid stress conditions encountered during food production and preservation. FEMS Microbiol Lett 356(1):134–140 Silver N, Best S, Jiang J, Thein SL (2006) Selection of housekeeping genes for
gene expression studies in human reticulocytes using real‑time PCR. BMC Mol Biol 7:9
Skora J, Otlewska A, Gutarowska B, Leszczynska J, Majak I, Stepien L (2015) Production of the allergenic protein Alt a 1 by Alternaria isolates from working environments. Int J Environ Res Public Health 12(2):2164–2183 Stepniewska Z, Kuzniar A (2013) Endophytic microorganisms‑promising
applications in bioremediation of greenhouse gases. Appl Microbiol Biotechnol 97(22):9589–9596
Sumby KM, Grbin PR, Jiranek V (2012) Validation of the use of multiple internal control genes, and the application of real‑time quantitative PCR, to study esterase gene expression in Oenococcus oeni. Appl Microbiol Biotechnol 96(4):1039–1047
Sun ZB, Li SD, Sun MH (2015) Selection of reliable reference genes for gene expression studies in Clonostachys rosea 67‑1 under sclerotial induction. J Microbiol Methods 114:62–65
Tong ZG, Gao ZH, Wang F, Zhou J, Zhang Z (2009) Selection of reliable refer‑ ence genes for gene expression studies in peach using real‑time PCR. BMC Mol Biol 10:13
Vandesompele J, De Preter K, Pattyn F, Poppe B, Van Roy N, De Paepe A, Spele‑ man F (2002) Accurate normalization of real‑time quantitative RT‑PCR data by geometric averaging of multiple internal control genes. Genome Biol 3(7):12
Wong ML, Medrano JF (2005) Real‑time PCR for mRNA quantitation. Biotech‑ niques 39(1):75–85
Wu JX, Su SY, Fu LL, Zhang YJ, Chai LJ, Yi HL (2014) Selection of reliable refer‑ ence genes for gene expression studies using quantitative real‑time PCR in navel orange fruit development and pummelo floral organs. Sci Hortic 176:180–188
Xie FL, Xiao P, Chen DL, Xu L, Zhang BH (2012) miRDeepFinder: a miRNA analysis tool for deep sequencing of plant small RNAs. Plant Mol Biol 80(1):75–84
Yin ZY, Ke XW, Huang DX, Gao XN, Voegele RT, Kang ZS, Huang LL (2013) Valida‑ tion of reference genes for gene expression analysis in Valsa mali var. mali
using real‑time quantitative PCR. World J Microb Biot 29(9):1563–1571 Yu SH, Yang P, Sun T, Qi Q, Wang XQ, Xu DL, Chen XM (2016) Identification
and evaluation of reference genes in the Chinese white wax scale insect
Ericerus pela. SpringerPlus 5:8
Zampieri D, Nora LC, Basso V, Camassola M, Dillon AJP (2014) Validation of ref‑ erence genes in Penicillium echinulatum to enable gene expression study using real‑time quantitative RT‑PCR. Curr Genet 60(3):231–236
Zhang JH, Shi JL, Liu YL (2013a) Bioconversion of resveratrol using resting cells of nongenetically modified Alternaria sp. Biotechnol Appl Biochem 60(2):236–243
Zhang JH, Shi JL, Liu YL (2013b) Substrates and enzyme activities related to biotransformation of resveratrol from phenylalanine by Alternaria sp. MG1. Appl Microbiol Biotechnol 97(23):9941–9954