Mon. Not. R. Astron. Soc.410,2662–2678 (2011) doi:10.1111/j.1365-2966.2010.17644.x
AMI Large Array radio continuum observations of
Spitzer
c2d small
clouds and cores
AMI Consortium: Anna M. M. Scaife,
1†
Emily I. Curtis,
2,3Matthew Davies,
2Thomas M. O. Franzen,
2Keith J. B. Grainge,
2,3Michael P. Hobson,
2Natasha Hurley-Walker,
2Anthony N. Lasenby,
2,3Malak Olamaie,
2Guy G. Pooley,
2Carmen Rodr´ıguez-Gonz´alvez,
2Richard D. E. Saunders,
2,3Michel Schammel,
2Paul F. Scott,
2Timothy Shimwell,
2David Titterington,
2Elizabeth Waldram
2and Jonathan T. L. Zwart
41Dublin Institute for Advanced Studies, 31 Fitzwilliam Place, Dublin 2, Ireland 2Astrophysics Group, Cavendish Laboratory, J J Thomson Avenue, Cambridge CB3 0HE 3Kavli Institute for Cosmology Cambridge, Madingley Road, Cambridge CB3 0HA
4Columbia Astrophysics Laboratory, Columbia University, 550 West 120th Street, New York 10027, USA
Accepted 2010 September 3. Received 2010 September 2; in original form 2010 August 3
A B S T R A C T
We perform deep 1.8-cm radio continuum imaging towards 13 protostellar regions selected from theSpitzer c2d small clouds and cores programme at high resolution (25 arcsec) in order to detect and quantify the cm-wave emission from deeply embedded young protostars. Within these regions we detect 15 compact radio sources which we identify as radio protostars including two probable new detections. The sample is in general of low bolometric luminosity and contains several of the newly detected VeLLO sources. We determine the 1.8-cm radio luminosity to bolometric luminosity correlation,Lrad −Lbol, for the sample and discuss the
nature of the radio emission in terms of the available sources of ionized gas. We also investigate theLrad −LIRcorrelation and suggest that radio flux density may be used as a proxy for the internal luminosity of low-luminosity protostars.
Key words: radiation mechanisms: general – stars: formation – ISM: clouds – ISM: general.
1 I N T R O D U C T I O N
The radio spectrum of dark clouds has recently come under scrutiny following the proposal that their centimetre-wave emission is due to spinning dust (Casassus et al. 2006; AMI Consortium: Scaife et al. 2009a,b, 2010). These observational studies have largely con-centrated on the arcminute scale emission, neglecting the known small-scale radio emission detected from a significant fraction of protostars (Rodr´ıguez et al. 1989; Anglada 1995). As these investi-gations become more detailed it is necessary to quantify correctly this emission in order to avoid confusing it with that arising from spinning dust when observing at resolutions where the two may not be easily distinguishable. Most radio protostar searches and surveys (e.g. Andr´e, Montmerle & Feigelson 1987; Anglada 1995; Stamatellos et al. 2007) are conducted at 3.6 and 6 cm wavelengths; however the spectrum of emission due to spinning dust is thought
We request that any reference to this paper cites ‘AMI Consortium: Scaife
et al. 2010’.
†E-mail: [email protected]
to peak at shorter wavelengths of 1–2 cm (Draine & Lazarian 1998) and this is the wavelength range where most spinning dust ob-servations are made. Although a few obob-servations towards spe-cific sources have been made at 2 cm (Rodr´ıguez & Canto 1983; Bieging, Cohen & Schwartz 1984; Pravdo et al. 1985; Rodr´ıguez & Reipurth 1998; Andr´e, Motte & Bacmann 1999, hereafter AMB99) their number is still limited, particularly in the case of low-luminosity protostars and Class O objects.
Longer wavelength radio emission is capable of escaping from the high column density envelopes which surround deeply embedded young protostars, making it an appropriate mechanism for searching for such objects. Very high sensitivity observations are required as the thermal (vibrational) dust spectrum falls off steeply in intensity at longer wavelengths. However, young and low-luminosity proto-stars are also known to produce additional radio emission which can make them more easily detectable. In general, this radio emission has been observed to possess a rising spectrum, indicating that it occurs as a consequence of free–free radiation from ionized gas. The spectral index of such emission (defined asα, whereSν ∝
α= −0.1 indicates optically thin free–free emission, whereasα= 2 indicates optically thick; values intermediate to these limits imply a medium which is partially optically thick (Reynolds 1986). In the case of a spherically symmetric shell of decreasing density with
ne∝r−2,α0.6. A number of mechanisms have been proposed
to produce free–free emission in the immediate vicinity of stellar objects: where a high enough ionizing flux is present, generally in later type T Tauri stars, photoionization can support an embedded HIIregion (Churchwell 1990); a fully ionized stellar wind, again
associated more often with later type stars, would produce an easily observable radio signal (Panagia & Felli 1975; Curiel et al. 1989), as could a partially ionized, collimated outflow (Reynolds 1986); the accretion shock on the surface of protostellar discs may heat and ionize infalling gas (Winkler & Newman 1980; Cassen & Moosman 1981); the molecular outflows from young, low-mass protostars and the neutral winds thought to initiate them can generate free–free emission through shock ionization as they impact on the surround-ing envelope (Curiel, Canto & Rodr´ıguez 1987; 1989; Rodr´ıguez & Reipurth 1996). In the case of low-luminosity protostars, it is the last of these mechanisms which is considered to be most plausible and indeed, where measured, the outflow force of most protostellar jets has been found to be energetically viable to explain the ob-served cm-wave radio emission (Anglada 1995). This theory is also supported by very high angular resolution observations of the radio emission from protostars (Simon et al. 1983; Anglada 1996), which find that the radio emission is elongated along the direction of the molecular outflows.
Recent measurements of the luminosity distribution of protostars from theSpitzerSpace Telescope (Dunham et al. 2008; Evans et al. 2009) have aggravated the ‘luminosity problem’ first articulated by Kenyon et al. (1990). The trend is increasing numbers of proto-stars at lower luminosities down to an internal luminosity, which describes the total luminosity of the central protostar and circum-stellar disc, ofLint 0.1 L, below which the numbers start to
decline. For young embedded protostars the accretion luminosity will dominate over that from the stellar photosphere. However, sim-ple star formation models, such as the spherical accretion model of Shu (1977), predict that a low-mass source on the stellar/brown dwarf boundary (M0.08 M) should have an internal luminosity
Lint1.6 Lfrom accretion alone (Evans et al. 2009). Non-steady
accretion, starting in the earliest protostellar stages, is currently the best solution to this discrepancy (Kenyon & Hartmann 1995; Young & Evans 2005; Enoch et al. 2007). The luminosity problem is most difficult to rectify in very low luminosity objects (VeLLOs; Young et al. 2004; Dunham et al. 2008) with extreme luminositiesLint≤
0.1 L. The nature of these objects is unclear, whether they are young Class O protostars which are just powering up, or are more evolved but in a low accretion state (Dunham et al. 2008; Evans et al. 2009).
The VeLLO IRAM 04191-IRS (AMB99) is a good example of this situation. IRAM 04191-IRS has a well-measured molecular outflow, from which the mass accretion on to the protostar can be calculated (AMB99; Dunham et al. 2008). The luminosity expected from this accretion, using steady accretion arguments, is found to be 25 times the measured value (Dunham et al. 2006). However, it is not the case that all VeLLOs are so well defined, and indeed many of their physical properties are often inconsistent (Bourke et al. 2006). The existing sample of VeLLO sources, although expanded bySpitzer(Dunham et al. 2008), is in no way complete. VeLLOs are difficult to confirm as protostars in the infrared due to their low luminosity and embedded nature, and measuring their molecular outflows may also be problematic as exemplified by the case of
L1014 (Bourke et al. 2005; Crapsi et al. 2005). It is also the case that VeLLOs are often found in cores which not only are assumed to be starless, but also were not believed to be approaching collapse (Bourke et al. 2006). Nevertheless, identifying a complete sample of these low-luminosity embedded protostars is vital for understanding low-mass star formation.
This paper presents high-resolution, high-sensitivity observations towards a sample of known or proposed protostellar objects all lo-cated within clouds targeted by a joint Arcminute Microkelvin Im-ager (AMI) and Sunyaev–Zel’dovich Array (SZA; Muchovej et al. 2007) spinning dust dark cloud sample (Scaife et al., in prepara-tion) which was selected from theSpitzersmall clouds and cores programme (Evans et al. 2003) and is designed to measure the emis-sion from the clouds on arcminute scales. The majority of the cores observed here have low bolometric luminosity, with a significant proportion being VeLLO. Since these studies are on differing scales but target the same regions we now explicitly define our nomencla-ture.Coresare defined as compact objects on scales of a few tenths of a parsec and are typically identified at sub-mm wavelengths. Cores can be protostellar or starless, a distinction made on the basis of their spectral energy distributions (SEDs), the presence of an IR source, a molecular outflow or a compact cm-wave source (Andr´e, Ward-Thompson & Barsony 2000). VeLLOs are a subset of cores, which until recently were often presumed to be starless but are in fact a low-luminosity embedded population. Cores identified in the sub-mm are suffixed ‘SMM’, whilst those identified in the infrared are suffixed ‘IRS’.Cloudsordark cloudsare regions of high visual extinction on scales of a few parsec. They contain large quantities of molecular gas, which often harbours cores and active star forma-tion. On larger scales of a few parsec to a few tens of parsec, we refer to extended regions of presumably interconnected clouds as
cloud complexes.
The organization of this paper is as follows. In Section 2, we describe the sample of targets to be observed, and in Section 3 we describe the AMI Large Array (AMI-LA) telescope, the observa-tions and the data reduction process. In Section 4, we comment upon the results of the observations and compare them to predictions. De-tailed notes on individual fields are given in Section 5. The nature of the radio emission is discussed in Section 6 and correlations with the IR properties of the sample are derived in Section 6.3. Finally we present our conclusions in Section 7.
2 S A M P L E
2664
A. M. M. Scaife et al.
Table 1.AMI-LA Fields. Column 1, name of field, (2) right ascension, (3) declination, (4) association, (5) flag on existing data from SCUBA, (6) flag on existing data from MAMBO, (7) flag on existing data from SHARC-II, (8) references for 5–7, (9) number of cores (confirmed and proposed) within the area covered by the AMI-LA observation.
Name RA Dec. Association SCUBA MAMBO SHARC-II Refs. Ncore
(J2000) (J2000) Y/N Y/N Y/N
IRAM 04191 04 21 57 15 29 46 Taurus Y N Y 1,6 2
L1521F 04 28 39 26 51 36 Taurus Y Y Y 1,5,6 1
B35A 05 44 29 09 08 57 - Y N Y 1,5,6 2
L673 19 20 26 11 22 19 Aquila Rift, Cloud B Y N N 2 3
CB188 19 20 15 11 36 08 Aquila Rift, Cloud B N Y Y 4,5,6 1
L673-7 19 21 35 11 21 23 Aquila Rift, Cloud B N Y Y 5,6 1
L723 19 17 44 19 15 24 - Y N Y 1,6 2
L1152 20 35 46 67 53 02 - Y N Y 1,6 1
L1148 20 40 57 67 23 05 Cepheus Flare N Y Y 3,5,6 2
BERN 48 20 59 15 78 22 60 Cepheus Flare Y Y Y 5,6 1
L1014 21 24 08 49 59 09 - Y Y Y 2,5,6 1
L1165 22 06 50 59 02 46 Cloud 157, Cyg OB7 N N Y 2,6 2
L1221 22 28 07 69 00 39 - Y N Y 1,6 2
(1) Young et al. (2006); (2) Visser, Richer & Chandler (2002); (3) Kirk, Ward-Thompson & Andr´e (2007); (4) Launhardt & Henning (1997); (5) Young et al. (2006) and (6) Wu et al. (2007).
04191 (Dunham et al. 2006), L1521F (Bourke et al. 2006; Terebey et al. 2009; Shinnaga et al. 2009), L673-7 (Dunham et al. 2008), L1148 (proposed; Kauffmann et al. 2005) and L1014 (Young et al. 2004; Bourke et al. 2005; Shirley et al. 2007). To this list we add two further potential VeLLO objects: L723-IRS ([DCE08]-026) and L1165-IRS ([DCE08]-039), which were included in the catalogue of Dunham et al. (2008) but ranked as Group 6.
All of the fields have been at least partially observed in the sub-mm, although three of the VeLLO objects (L723-IRS and L1165-IRS) are not covered by existing observations. Several fields also have data at lower radio frequencies: IRAM 04191 (AMB99), L1521F (Harvey et al. 2002), B35A (Rodr´ıguez et al. 1989), L723 (Anglada et al. 1991; Carrasco-Gonz´alez et al. 2008), L1014 (Shirley et al. 2007) and L1221 (Rodr´ıguez & Reipurth 1998; Young et al. 2009). The correspondence of the AMI-LA measurements to these observations is discussed in more detail in Section 6.2.
3 O B S E RVAT I O N S
AMI comprises two synthesis arrays, one of ten 3.7-m antennas (Small Array; SA) and one of eight 13-m antennas (Large Array; LA), both sited at Lord’s Bridge, Cambridge (AMI Consortium: Zwart et al. 2008). The telescope observes in the band 13.5– 17.9 GHz with cryostatically cooled NRAO indium–phosphide front-end amplifiers. The overall system temperature is approxi-mately 25 K. Amplification, equalization, path compensation and automatic gain control are then applied to the IF signal. The back-end has an analogue lag correlator with 16 indepback-endent correlations formed at twice Nyquist rate for each baseline using path delays spaced by 25 mm. From these, eight complex visibilities are formed in 0.75 GHz bandwidth channels. In practice, the two lowest fre-quency channels (1 and 2) are not generally used due to a lower response in this frequency range and interference from geostation-ary satellites. The data in this paper were taken with the AMI LA.
Observations of the 13 fields listed in Table 1 were made with the AMI LA between 2009 October and 2010 July. The clouds were ob-served as single pointings, with the exception of B35A and L1148. B35A was observed as a seven-field mosaic in order to cover the same sky area as earlier VLA observations (see Section 5), and L1148 was observed in two separate pointings as the two
embed-ded cores proposed by Dunham et al. (2008) for this cloud are separated by more than the AMI-LA primary beam full width at half-maximum (FWHM).
AMI-LA data reduction is performed using the local software toolREDUCE. This applies both automatic and manual flags for
in-terference, shadowing and hardware errors, Fourier transforms the correlator data to synthesize frequency channels and performs phase and amplitude calibrations before output to disc inuvFITS format suitable for imaging inAIPS. Flux (primary) calibration is performed using short observations of 3C286 and 3C48. We assume I+Q flux densities for this source in the AMI-LA channels consistent with the updated VLA calibration scale (Rick Perley, private communi-cation; see Table 2). Since the AMI-LA measures I+Q, these flux densities include corrections for the polarization of the calibrator sources. A correction is also made for the changing intervening airmass over the observation. From other measurements, we find the flux calibration is accurate to better than 5 per cent (AMI Con-sortium: Scaife et al. 2008; AMI ConCon-sortium: Hurley-Walker et al. 2009). Additional phase (secondary) calibration is done using in-terleaved observations of calibrators selected from the Jodrell Bank VLA Survey (JVAS; Patnaik et al. 1992). After calibration, the phase is generally stable to 5◦for channels 4–7, and 10◦for chan-nels 3 and 8. The FWHM of the primary beam of the AMI LA is
≈6 arcmin at 16 GHz.
Reduced data were imaged using theAIPSdata package.CLEAN
deconvolution was performed using the taskIMAGRwhich applies
a differential primary beam correction to the individual frequency channels to produce the combined frequency image. The broad spectral coverage of AMI allows a representation of the spectrum between 14.3 and 17.9 GHz to be made independently of other
Table 2. AMI-LA frequency channels and primary calibrator flux densities measured in Jy.
Channel no. 3 4 5 6 7 8
Freq. (GHz) 14.27 14.99 15.71 16.43 17.15 17.87
3C48 1.85 1.75 1.66 1.58 1.50 1.43
3C286 3.60 3.54 3.42 3.31 3.21 3.11
Table 3.AMI-LA observations. Column 1, name of field, (2) date of initial observation, (3) primary calibrator, (4) secondary calibrator,a(5) date of additional observation, (6) primary calibrator, (7) secondary calibrator,a(8) AMI-LA combined data synthesized beam FWHM major axis, (9) AMI-LA combined data synthesized beam FWHM minor axis and (10) rms noise fluctuations on the combined channel map.
Name Date 1◦ 2◦ Date 1◦ 2◦ θmaj θmin σrms
(yy-mm-dd) (yy-mm-dd) (arcsec) (arcsec) (µbmJy)
IRAM 04191 09-10-09 3C48 J0424+1442 09-11-07 3C286 J0424+1442 49.9 27.4 17
L1521F 09-10-17 3C147 J0426+2350 - - - 42.0 26.3 16
B35Ab 09-11-08 3C48 J0551+0829 - - - 53.6 28.0 67
L673 09-12-13 3C48 J1922+1530 - - - 36.5 31.2 31
CB188 09-12-27 3C48 J1922+1530 - - - 46.0 21.9 24
L673-7 09-10-18 3C286 J1922+1530 - - - 32.0 26.3 16
L723 09-12-14 3C286 J1905+1943 09-10-08 3C286 J1925+2106 42.9 24.0 29
L1152 09-12-26 3C286 J2035+5821 10-01-05 3C286 J2035+5821 38.8 22.6 49
L1148c 09-10-12 3C286 J2052+6858 09-10-20 3C286 J2052+6858 36.6 26.5 22
BERN 48 09-11-15 3C48 J2051+7441 - - - 30.0 27.4 23
L1014 09-10-14 3C48 J2123+4614 - - - 31.2 25.4 21
L1165 10-06-30 3C147 J2223+6249 10-07-02 3C48 J2223+6249 32.3 29.0 21
L1221 09-10-11 3C286 J2230+6946 - - - 27.4 25.1 19
aSecondary calibrators are selected from the JVAS catalogue (Patnaik et al. 1992).
bThe seven pointings of the B35A cloud mosaic were observed in an interleaved fashion during single run.
cThe two pointings towards the L1148 cloud were observed on separate dates, the later observation corresponds to the southern pointing.
telescopes when sufficient signal-to-noise ratio is present, and in what follows we use the convention:Sν ∝ να, whereSν is flux density (rather than flux,Fν =νSν),ν is frequency andαis the spectral index. All errors quoted are 1σ.
The observations towards the 13 fields listed in Table 1 and de-scribed in Section 2 are summarized in Table 3. The details of each individual observation including the date and both the primary and secondary calibration sources are listed, along with the resulting rms noise level in the map and the dimensions of the naturally weighted synthesized beam. The rms noise level varies between fields due to the different levels of data flagging required following periods of poor weather conditions or interference from non-astronomical sources, such as geostationary satellites. Where possible for obser-vations that were heavily flagged, a second observation was made and these are also indicated in Table 3.
4 R E S U LT S
Within the 13 fields observed by the AMI LA we detect 40 sources, and we identify 15 of these as being associated with the 21 possible cores in these areas. The combined channel maps from the AMI LA are shown in Figs 1–5. The rms noise on each map,σrms, is
found using theAIPS taskIMEANwhich fits a Gaussian profile to
the histogrammed pixel values for each field. These values may be found in Table 3 and in the figure captions. We identify all objects with peak flux densities greater than 5σrms, where that peak
lies within the FWHM of the AMI-LA primary beam, as being true sources and these are listed in Table 4. The two detection conditions are relaxed for some individual cases and where this occurs it is indicated in Table 4 and commented upon in Section 5.
Table 4 lists sources in order of increasing Right Ascension for each field, with peak positions given in Columns 3 and 4. Given the low signal-to-noise ratio in the individual channel data for these tar-gets, the reduced phase stability of AMI-LA Channel 3 was found to produce an rms noise too high relative to the other channels to contribute usefully to the combined data set, consequently it has not been used in this work. In addition, since channel 8 of the AMI LA is prone to satellite interference it is sometimes not used in mak-ing the final combined bandwidth images. As a rule, this channel
is only included when the resulting noise level in the combined channel map,σ4−8
rms, is lower than that of a map using only channels
4 to 7,σ4−7
rms. As this varies from field to field, changing the
nom-inal observation frequency slightly, Column 5 lists this frequency for each data set. For ease of notation AMI-LA measurements will henceforth be denoted as being made at 16 GHz (1.8 cm) when de-scribed in the text; for the more precise measurement frequency of individual fields we refer the reader to Table 4. Column 6 lists the primary beam corrected peak flux density for each detected source with no correction for the local background, and Column 7 the primary beam corrected integrated flux density. Integrated flux densities are found using theFITFLUXprogram (Green 2007). This
method calculates flux densities by removing a tilted plane fitted to the local background and integrating the remaining flux den-sity. This is done by drawing a polygon around the source and fitting a tilted plane to the pixels around the edge of the polygon. Where an edge of the polygon crosses a region confused by an-other source, the background is subjective and this edge is omitted from the fitting. Since the extracted flux density is dependent to some degree on the background emission, we repeat this process using five irregular polygons, each varying slightly in shape. The final flux density is the average of that extracted from these five polygons. The error on the integrated flux densities is calculated as
σS=
(0.05Sint)2+σfit2+σrms2 , whereσfitis the standard deviation
of the flux densities found from the five polygonal apertures,σrmsis
the rms noise determined usingIMEANand 0.05Sintis a conservative
5 per cent absolute calibration error. Where the 5 per cent calibration uncertainty is not dominant, errors determined for this sample are in general heavily dependent on the rms noise,σrms, rather than the
fitting error,σfit, which is found to be small. Column 8 of Table 4
then identifies which of the detected sources are associated with known cores.
4.1 A note on expected sources
2666
A. M. M. Scaife et al.
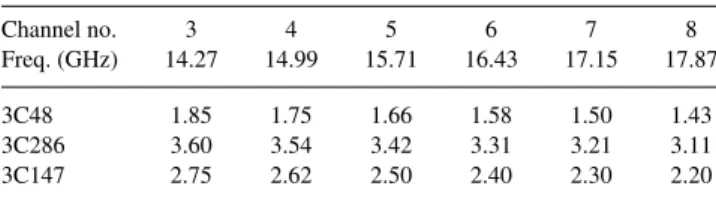
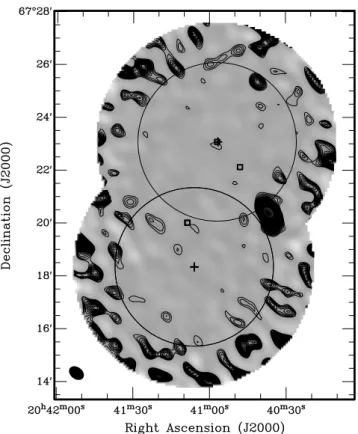
Figure 1. (a) IRAM 04191; (b) L1521F; (c) L673 and (d) CB188. AMI-LA data are shown as grey-scale and contours linearly from 3σ, whereσ=17, 16, 26 and 24µJy beam−1, respectively.Spitzerpositions and candidate embedded objects from Dunham et al. (2008) are indicated by crosses, and the positions of sub-mm cores are shown as unfilled squares, see text for details. The AMI-LA primary beam FWHM is shown as a circle and the AMI-LA synthesized beam is shown as a filled ellipse in the lower-left corner of each map.
this model we predict that we should see 0.07 sources arcmin−2, ≈2 radio sources within a 6 arcmin FWHM primary beam above a 5σ flux density of 125μJy, or 31±6 sources in total. On aver-age in our sample we see 0.09 sources arcmin−2. Since we identify
15 of our 40 sources with protostellar cores, not accounted for by the extragalactic radio source counts model, this is consistent with the discrepancy in the measured and predicted source counts. Since the short frequency coverage of the AMI-LA band makes spectral index estimates highly uncertain for low signal-to-noise ratio de-tections, and given this statistic, we tentatively identify any sources found in the target fields that do not have a known protostellar association as extragalactic.
5 N OT E S O N I N D I V I D UA L F I E L D S
5.1 IRAM 04191
IRAM 04191+1522 (IRAM 04191-IRS; see Fig. 1a) was identified as a Class O source by AMB99. It has a large extended molecular
outflow, seen in CO(2−1) (AMB99) and a flattened core mapped in N2H+(Dunham et al. 2006). AMB99 reported radio flux densities
for this object at 5, 8 and 15 GHz from the VLA, which they stated were consistent with a spectral index ofα=0.6, similar to that seen in the radio from VLA1623. We find a flux density ofS16=
0.173±0.020μJy for IRAM 04191-IRS, consistent with the earlier VLA measurement ofSVLA
15 =0.16±0.05μJy. Combining the VLA
and AMI-LA channel data gives a spectral index ofα16
4.85=0.45±
0.20. Across the AMI-LA band alone we measure a spectral index ofα17.8
14.9 =1.44± 1.09. The large error from the relatively small
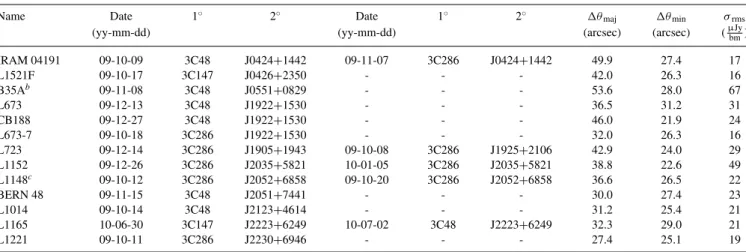
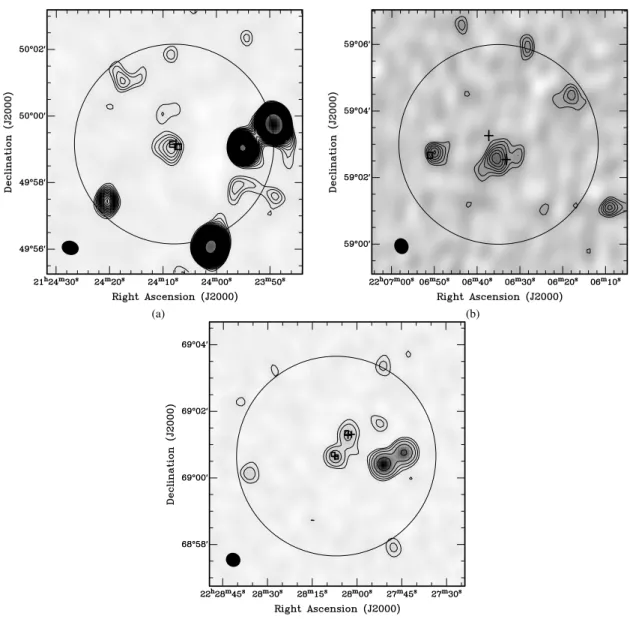
Figure 2.Primary beam corrected mosaic of B35A. AMI-LA data are shown as grey-scale and contours linearly from 3σ, whereσ =67µJy beam−1to 1 mJy beam−1 and then incrementally in units of 1 mJy beam−1.Spitzercandidate embedded objects from Dunham et al. (2008) are indicated by vertical crosses (+), and the positions of sub-mm cores are shown as unfilled squares, see text for details. The location of B35A SMM-1 is highlighted by a square frame to the north-west of the centre. Radio sources identified by RR98 are marked by rotated crosses (×). The AMI-LA primary beam FWHMs are shown as circles and the AMI-LA synthesized beam is shown as a filled ellipse in the lower-left corner.
above 5σ within the AMI-LA primary beam FWHM towards this field, and in the absence of further information we identify this as an extragalactic radio source.
5.2 L1521F
L1521F-IRS (see Fig. 1b) is thought to be a core in the very ear-liest stages of gravitational collapse (Terebey et al. 2009). Unlike the VeLLO sources IRAM 04191-IRS or L1014-IRS it does not possess a detected molecular outflow. Previous deep cm-wave ob-servations of the L1521F cloud (Harvey et al. 2002), which covered L1521F-IRS, at 3.6 cm wavelength did not find a coincident radio source and instead used a nearby object, which we identify as NVSS 042841+265355, to place an upper limit on the bolometric lumi-nosity of the core. In Fig. 1(b) the source NVSS 042841+265355 can be seen to the north of the phase centre, just within the primary beam FWHM. This source has a primary beam corrected flux den-sity ofS16=6.1±0.3 mJy and in combination withS1.4=37.3±
1.2 mJy (NVSS) andS8.35=10.8 mJy (Harvey et al. 2002) we find
this consistent with the presence of an extra-galactic non-thermal point source (as also concluded by Harvey et al.). However, in ad-dition to NVSS 042841+265355 we also detect a two-component radio structure more coincident with L1521F-IRS. Shinnaga et al. (2009) detected extended warm gas (30–70 K) towards L1521F-IRS and have suggested that it is highly likely this gas is heated through shocks produced by an outflowing/rotating component im-pacting on the surrounding cold dynamically collapsing medium. Such shocks would also be likely to produce radio emission from
shock ionization and it may be that the double radio structure we see here is a consequence of L1521F-IRS’s bipolar outflow, although we note that the radio emission is not aligned east–west following the morphology of the outflow as mapped by Bourke et al. (2006). This may be a consequence of the non-uniformity of the surround-ing interstellar medium, or as suggested by Shinnaga et al. (2009) be due to the outflows having rotated from the position of the shocks responsible for the radio emission. Of the three further sources in this field, none has known radio or protostellar counterparts and in the absence of further information we identify them as extragalactic sources.
5.3 B35A
2668
A. M. M. Scaife et al.
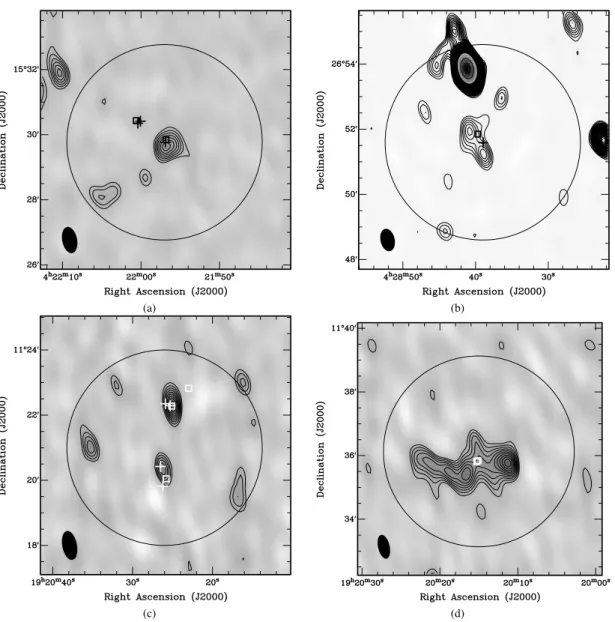
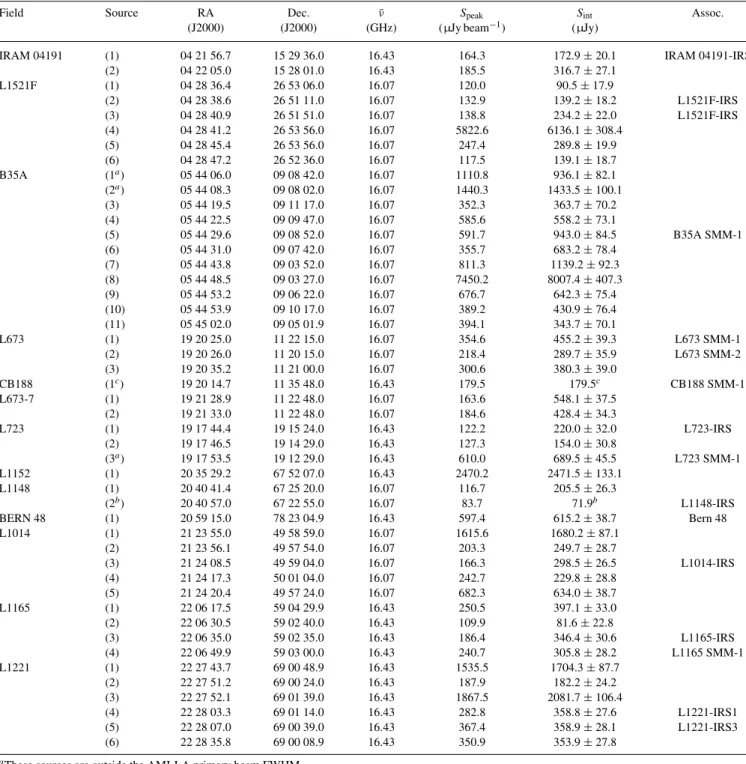
Figure 3. (a) L673-7; (b) L723; (c) L1152 and (d) BERN 48. AMI-LA data are shown as grey-scale and contours linearly from 3σ, whereσ =19, 22, 49 and 23µJy beam−1.Spitzercandidate embedded objects from Dunham et al. (2008) are indicated by crosses, and the positions of sub-mm cores are shown as unfilled squares, see text for details. The AMI-LA primary beam FWHM is shown as a circle and the AMI-LA synthesized beam is shown as a filled ellipse in the lower-left corner.
which we denote as B35A-IRS, is located in the most south-easterly AMI-LA pointing adjacent to a bright extragalactic radio source. Any emission from this source cannot be separately resolved by the AMI-LA synthesized beam. Of the three further sources detected in this field, none has known associations, and we identify them as extragalactic sources.
5.4 L673
L673 (see Fig. 1c) is a large star-forming region in the Aquila Rift and the field observed here covers only part of it. Radio counterparts are detected for the known sub-mm cores L673 SMM-1 and L673 SMM-2 (Visser et al. 2002). A third sub-mm core, identified as L673 SMM-7 in Visser et al. (2002), which lies to the north-west of L673 SMM-1 is not detected. This core has no detected molecular outflow (Visser et al. 2002) and is assumed starless. The two radio counterparts detected in the AMI-LA maps have been denoted as L673 SMM-1 and L673 SMM-2 in Table 4. However, we note that
although L673 SMM-1 is coincident with the sub-mm core detected in the SCUBA data of Visser et al. (2002), the radio counterpart to L673 SMM-2 is offset slightly to the north of the sub-mm posi-tion. The peak flux density of the L673 SMM-1 radio counterpart is also coincident with the candidate embedded object [DCE08]-027, which is a Group 1 candidate according to the classification of Dunham et al. (2008). A second candidate [DCE08]-028 (Group 5) is offset very slightly to the north-east, away from the peak. Al-though the sub-mm core L673 SMM-2 is very close in position to the candidate embedded object [DCE08]-029 (Group 1), the slight offset of the radio emission to the north makes the radio counterpart more coincident with [DCE08]-030 (Group 3). However the two candidate sources are separated by less than one synthesized beam, and it is difficult to correctly assign the radio emission to a single candidate with observations of this resolution.
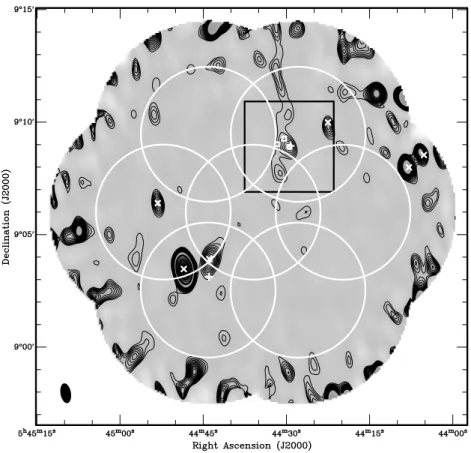
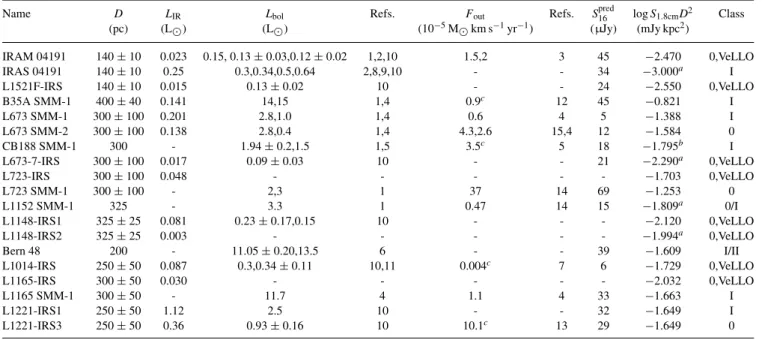
Figure 4. Primary beam corrected mosaic of L1148. AMI-LA data are shown as grey-scale and contours linearly from 3σ, where σ = 22µJy beam−1.Spitzercandidate embedded objects from Dunham et al. (2008) are indicated by crosses, and the positions of sub-mm cores are shown as unfilled squares (see text for details). The AMI-LA primary beams are shown as circles and the AMI-LA synthesized beam is shown as a filled ellipse in the lower-left corner.
5.5 CB188
CB188 (see Fig. 1d) shows an elongated radio structure with a slight localized enhancement at the position of the sub-mm core (CB188 SMM) as detected by the Max Planck Millimetre Bolometer (MAMBO; Kauffmann et al. 2008) and SHARC-II (Wu et al. 2007). CB188 SMM-1 is a known Class I source (Launhardt et al. 2010) and has molecular outflows which were measured by Yun & Clemens (1994). The radio emission seen at 16 GHz by the AMI LA shows the same spur of emission extending to the north away from the position of the sub-mm core, which is seen at 450, 850 and 1300μm (Launhardt et al. 2010). However, the bulk of the extended radio emission seen in the AMI-LA map of this object is extended east–west, whereas the molecular outflows associated with CB188 SMM-1 are seen to be almost exactly coincident with the core and therefore are thought to be ‘pole-on’, and to extend along the line of sight towards this object (Yun & Clemens 1994). It is consequently difficult to associate the localized enhancements of radio emission along this extension as being associated with the outflows. Given the unusual extended nature of this emission compared with the other fields in our sample we are hesitant to associate it entirely with CB188 SMM. Taking this into account, the complex radio morphology of this object prevents us from ex-tracting an integrated flux density for CB188 SMM-1 alone, and so instead we place a lower limit on the integrated radio flux density, corresponding to the peak flux density at the position of the core.
5.6 L673-7
Although L673-7-IRS (see Fig. 3a) has previously been assumed to be a starless core, Dunham et al. (2008) classified it as a Group 1 protostellar candidate based on itsSpitzerdata, albeit a low lumi-nosityLIR=0.017 Lone. In spite of this we detect no source at
the position of L673-7-IRS ([DCE08]-031). The two sources which are detected have no known associations and we tentatively identify them as extragalactic.
5.7 L723
L723 SMM-1 (see Fig. 3b) is a known Class O object with a very powerful molecular outflow (Bontemps et al. 1996). As its bolomet-ric luminosity is also quite low, this places it in the early stages of Class O evolution. We detect L723 SMM-1 just outside the AMI-LA primary beam FWHM coincident with its known sub-mm position. The AMI-LA field is centred on [DCE08]-026, which we shall de-note as L723-IRS, and which is classified as a Group 6 embedded protostellar candidate by Dunham et al. (2008). Group 6 candidates are known to benotassociated with regions of high volume density and are therefore considered to be unlikely candidates, with the caveat that most of the dust continuum surveys used to determine regions of high volume density are limited toM≥0.1–1.0 M. At 16 GHz, we see a clear radio association to L723-IRS, with a second object offset to the south which may also be associated.
5.8 L1152
We detect no source at the position of L1152-IRS (see Fig. 3c). Only one source is visible within the AMI-LA primary beam which we identify with NVSS 203529+675207. This source has a primary beam corrected flux density ofS16. =2.47±0.13 mJy, which
im-plies a spectral index ofα16
1.4=0.15±0.03. Due to its position offset
from L1152-IRS we do not associate it with the core. However, we note that observations in the direction of L1152-IRS with the AMI LA are heavily affected by radio interference and the noise level of this observation is high compared to the rest of the sample.
5.9 L1148
2670
A. M. M. Scaife et al.
Figure 5. (a) L1014, (b) L1165 and (c) L1221. AMI-LA data are shown as grey-scale and contours. In (a) and (b) contours are linear from 3σ, whereσ= 21µJy beam−1in both maps. In (c) contours are at 3, 6, 12, 24σ, whereσ=19µJy beam−1.Spitzercandidate embedded objects from Dunham et al. (2008) are indicated by crosses, and the positions of sub-mm cores are shown as unfilled squares (see text for details). The AMI-LA primary beam FWHM is shown as a circle and the AMI-LA synthesized beam is shown as a filled ellipse in the lower-left corner of each map.
5.10 Bern 48
Bern 48 (also known as RNO129 and HH198) is a borderline Class I/II object (Connelley, Reipurth & Tokunaga 2008; Wu et al. 2007). The AMI-LA observations towards Bern 48 (see Fig. 3d) show a slightly resolved compact source (src ≈ 5 arcsec) with a
ris-ing spectrum. The source is clearly extended in the sub-mm and on larger scales displays a cometary morphology in the 1.2 mm MAMBO maps (Kauffmann et al. 2008). The AMI-LA measures a flux density ofS16=615±39μJy, with a spectral index measured
across the AMI band, although poorly constrained, ofα17.9
14.9=1.25±
0.96. A spectral index of1 is consistent with that seen towards hypercompact HIIregions, or indeed which may be expected from
a stellar wind. If Bern 48 is a HCHIIregion of consistent density
this would imply an emission measure of>109pc cm−6and a mass
of≥100 M. Mass estimates for Bern 48, derived from MAMBO flux densities (Kauffmann et al. 2008), findMtot=2.06±0.02 M
inconsistent with this prediction.
5.11 L1014
The sub-mm core in L1014 was revealed not to be starless, as pre-viously thought (Visser et al. 2002), by theSpitzerc2d programme and became the first VeLLO object (L1014-IRS;LIR0.09 L;
Young et al. 2004). Deep VLA observations at 6 and 3.6 cm re-vealed a radio counterpart with a rising spectral index ofα8.46
4.86=
0.37±0.34. The AMI-LA measures a flux density ofS16=299±
27μJy towards L1014-IRS, constraining the spectral index to be
α16
4.86=0.71±0.11. We observe the emission from L1014-IRS to
be slightly extended (see Fig. 5a) suggesting once more that the radio emission arises not from the central engine itself but from the more extended envelope or associated outflow.
Table 4. Sources detected within the AMI-LA fields.
Field Source RA Dec. ν¯ Speak Sint Assoc.
(J2000) (J2000) (GHz) (µJy beam−1) (µJy)
IRAM 04191 (1) 04 21 56.7 15 29 36.0 16.43 164.3 172.9±20.1 IRAM 04191-IRS
(2) 04 22 05.0 15 28 01.0 16.43 185.5 316.7±27.1
L1521F (1) 04 28 36.4 26 53 06.0 16.07 120.0 90.5±17.9
(2) 04 28 38.6 26 51 11.0 16.07 132.9 139.2±18.2 L1521F-IRS
(3) 04 28 40.9 26 51 51.0 16.07 138.8 234.2±22.0 L1521F-IRS
(4) 04 28 41.2 26 53 56.0 16.07 5822.6 6136.1±308.4
(5) 04 28 45.4 26 53 56.0 16.07 247.4 289.8±19.9
(6) 04 28 47.2 26 52 36.0 16.07 117.5 139.1±18.7
B35A (1a) 05 44 06.0 09 08 42.0 16.07 1110.8 936.1±82.1
(2a) 05 44 08.3 09 08 02.0 16.07 1440.3 1433.5±100.1
(3) 05 44 19.5 09 11 17.0 16.07 352.3 363.7±70.2
(4) 05 44 22.5 09 09 47.0 16.07 585.6 558.2±73.1
(5) 05 44 29.6 09 08 52.0 16.07 591.7 943.0±84.5 B35A SMM-1
(6) 05 44 31.0 09 07 42.0 16.07 355.7 683.2±78.4
(7) 05 44 43.8 09 03 52.0 16.07 811.3 1139.2±92.3
(8) 05 44 48.5 09 03 27.0 16.07 7450.2 8007.4±407.3
(9) 05 44 53.2 09 06 22.0 16.07 676.7 642.3±75.4
(10) 05 44 53.9 09 10 17.0 16.07 389.2 430.9±76.4
(11) 05 45 02.0 09 05 01.9 16.07 394.1 343.7±70.1
L673 (1) 19 20 25.0 11 22 15.0 16.07 354.6 455.2±39.3 L673 SMM-1
(2) 19 20 26.0 11 20 15.0 16.07 218.4 289.7±35.9 L673 SMM-2
(3) 19 20 35.2 11 21 00.0 16.07 300.6 380.3±39.0
CB188 (1c) 19 20 14.7 11 35 48.0 16.43 179.5 179.5c CB188 SMM-1
L673-7 (1) 19 21 28.9 11 22 48.0 16.07 163.6 548.1±37.5
(2) 19 21 33.0 11 22 48.0 16.07 184.6 428.4±34.3
L723 (1) 19 17 44.4 19 15 24.0 16.43 122.2 220.0±32.0 L723-IRS
(2) 19 17 46.5 19 14 29.0 16.43 127.3 154.0±30.8
(3a) 19 17 53.5 19 12 29.0 16.43 610.0 689.5±45.5 L723 SMM-1
L1152 (1) 20 35 29.2 67 52 07.0 16.43 2470.2 2471.5±133.1
L1148 (1) 20 40 41.4 67 25 20.0 16.07 116.7 205.5±26.3
(2b) 20 40 57.0 67 22 55.0 16.07 83.7 71.9b L1148-IRS
BERN 48 (1) 20 59 15.0 78 23 04.9 16.43 597.4 615.2±38.7 Bern 48
L1014 (1) 21 23 55.0 49 58 59.0 16.07 1615.6 1680.2±87.1
(2) 21 23 56.1 49 57 54.0 16.07 203.3 249.7±28.7
(3) 21 24 08.5 49 59 04.0 16.07 166.3 298.5±26.5 L1014-IRS
(4) 21 24 17.3 50 01 04.0 16.07 242.7 229.8±28.8
(5) 21 24 20.4 49 57 24.0 16.07 682.3 634.0±38.7
L1165 (1) 22 06 17.5 59 04 29.9 16.43 250.5 397.1±33.0
(2) 22 06 30.5 59 02 40.0 16.43 109.9 81.6±22.8
(3) 22 06 35.0 59 02 35.0 16.43 186.4 346.4±30.6 L1165-IRS
(4) 22 06 49.9 59 03 00.0 16.43 240.7 305.8±28.2 L1165 SMM-1
L1221 (1) 22 27 43.7 69 00 48.9 16.43 1535.5 1704.3±87.7
(2) 22 27 51.2 69 00 24.0 16.43 187.9 182.2±24.2
(3) 22 27 52.1 69 01 39.0 16.43 1867.5 2081.7±106.4
(4) 22 28 03.3 69 01 14.0 16.43 282.8 358.8±27.6 L1221-IRS1
(5) 22 28 07.0 69 00 39.0 16.43 367.4 358.9±28.1 L1221-IRS3
(6) 22 28 35.8 69 00 08.9 16.43 350.9 353.9±27.8
aThese sources are outside the AMI-LA primary beam FWHM. bThese sources are detected at 3σ.
cLower limit on flux density, see text for details.
5.12 L1165
L1165-IRS ([DCE08]-039) is classified as a Group 6 source by Dunham et al. (2008), making it an unlikely candidate for an embed-ded object. In spite of this, we observe an extenembed-ded region of radio emission with a double-lobe structure, aligned east–west. Although the peak of neither lobe is exactly coincident with L1165-IRS we cautiously associate the larger lobe, which is nearer to the FIR source with this object. A second potential Group 6 core in L1165
([DCE08]-040), with very low IR-luminosity,LIR=0.008 L, is
listed by Dunham et al. (2008) to the north of L1165-IRS and we see no emission towards this object. The two detected sources which we do not associate with L1165-IRS do have any known radio or proto-stellar counterparts, and we therefore identify them as extragalactic sources.
2672
A. M. M. Scaife et al.
source slightly extended in the north–south direction. The spectrum of L1165 SMM-1 across the AMI band is relatively flat, suggesting that we seeing optically thin free–free emission.
5.13 L1221
The two sub-mm cores of the L1221 cloud (Young et al. 2006; Wu et al. 2007) were further resolved into three infrared sources by
Spitzer(Young et al. 2009). Centimetre radio observations of L1221 (Rodr´ıguez & Reipruth 1998; Young et al. 2009) at 3.6 and 6 cm revealed what appears to be optically thin free–free emission from L1221-IRS3 (SMM-1) (α= −0.16±0.54), but no detection in the direction of L1221-IRS1 and L1221-IRS2 (SMM-2). The AMI-LA 16 GHz observations (see Fig. 5c) clearly detect sources at both the location of L1221-IRS3 and towards L1221-IRS1 and L1221-IRS2 which are unresolved by the AMI-LA synthesized beam. The peak of the 16 GHz emission towards L1221 SMM-2 is more closely associated with L1221-IRS1, which is classified as a Class I object, than L1221-IRS2 which is thought to be a candidate YSO. The flux density measured from the AMI-LA observations for L1221-IRS3 isS16=359±28μJy, in excess of a flux density extrapolated from
the free–free model of the centimetre measurements by a factor of almost 2. The 3.3 mm measurements of Lee & Ho (2005) indicate that the vibrational dust spectrum of L1221-IRS3 does not possess a flattened tail, such as might be expected in the presence of a protoplanetary disc that could explain the excess in terms of dust emission. If, as suggested by Young et al. (2006), the centimetre emission observed towards L1221-IRS3 is due to shock ionization of the molecular outflow impacting on overdensities in the sur-rounding envelope (Curiel et al. 1987; 1989; Anglada 1995; Shang 2004), then it is possible that the extra flux density at 16 GHz is either indicative of a second shock component with a larger optical depth or may represent a steepening of the radio spectrum due to
thermal emission from the immediate envelope of the central source as predicted by the model of Konigl (1982). The two bright sources to the west of L1221 are coincident with a known radio source in the NVSS catalogue, the resolution of which does not resolve the two component sources, and we therefore identify them definitely as extragalactic objects. The two further sources detected in this field have no lower frequency radio counterpart, but also no known protostellar associations.
6 D I S C U S S I O N
6.1 The nature of the cm-wave radio emission: the thermal dust contribution
At 16 GHz we must be aware of the potential contribution to our measured flux densities from the vibrational, or Planckian, dust spectrum. Where available we use sub-mm flux densities from the literature at wavelengths from 350 to 1300μm to constrain the thermal dust emission at 1.8 cm. In general, we use flux densities extracted from 40 arcsec apertures, with notable exceptions being those objects measured by Visser et al. (2002) who used a 50 arcsec aperture, and IRAM 04191-IRS for which 60 arcsec apertures are assumed in order to accommodate the resolution of the 1.3 mm data (Dunham et al. 2006). We assume optically thin dust emission with
β=1.5 and fit SEDs with a single-temperature greybody spectrum:
Spred
16 ∝νβBν(Tdust). (1)
The flux densities predicted from these fits are listed in Column 8 of Table 5, which also lists the physical parameters of the cores taken from the literature. The predicted values of the vibrational dust emission are in general low compared to the rms noise in the data sets, detectable at 3σonly in a few fields.
Table 5. Physical properties of the AMI-LA protostar sample.
Name D LIR Lbol Refs. Fout Refs. Spred16 logS1.8cmD2 Class
(pc) (L) (L) (10−5M
km s−1yr−1) (µJy) (mJy kpc2)
IRAM 04191 140±10 0.023 0.15, 0.13±0.03,0.12±0.02 1,2,10 1.5,2 3 45 −2.470 0,VeLLO
IRAS 04191 140±10 0.25 0.3,0.34,0.5,0.64 2,8,9,10 - - 34 −3.000a I
L1521F-IRS 140±10 0.015 0.13±0.02 10 - - 24 −2.550 0,VeLLO
B35A SMM-1 400±40 0.141 14,15 1,4 0.9c 12 45 −0.821 I
L673 SMM-1 300±100 0.201 2.8,1.0 1,4 0.6 4 5 −1.388 I
L673 SMM-2 300±100 0.138 2.8,0.4 1,4 4.3,2.6 15,4 12 −1.584 0
CB188 SMM-1 300 - 1.94±0.2,1.5 1,5 3.5c 5 18 −1.795b I
L673-7-IRS 300±100 0.017 0.09±0.03 10 - - 21 −2.290a 0,VeLLO
L723-IRS 300±100 0.048 - - - −1.703 0,VeLLO
L723 SMM-1 300±100 - 2,3 1 37 14 69 −1.253 0
L1152 SMM-1 325 - 3.3 1 0.47 14 15 −1.809a 0/I
L1148-IRS1 325±25 0.081 0.23±0.17,0.15 10 - - - −2.120 0,VeLLO
L1148-IRS2 325±25 0.003 - - - −1.994a 0,VeLLO
Bern 48 200 - 11.05±0.20,13.5 6 - - 39 −1.609 I/II
L1014-IRS 250±50 0.087 0.3,0.34±0.11 10,11 0.004c 7 6 −1.729 0,VeLLO
L1165-IRS 300±50 0.030 - - - −2.032 0,VeLLO
L1165 SMM-1 300±50 - 11.7 4 1.1 4 33 −1.663 I
L1221-IRS1 250±50 1.12 2.5 10 - - 32 −1.649 I
L1221-IRS3 250±50 0.36 0.93±0.16 10 10.1c 13 29 −1.649 0
a3σupper limit.
bLower limit, see text for details.
cValue ofFoutfrom the literature corrected forD.
6.2 The nature of the cm-wave radio emission: free–free emission
Massive star formation regions have been known for a long time to produce radio emission, however the low-luminosity protostars in this sample do not produce a sufficient ionizing flux to maintain a photoionized HIIregion such as those found in hypercompact or
ultracompact HII. Instead, it is likely that an excess of radio flux
density relative to the thermal dust emission in these objects is due to either a shocked molecular outflow or a stellar wind. A completely ionized stellar wind (Panagia & Felli 1975) was shown to be feasible by Curiel et al. (1989) only for objects1 arcsec in size, as it would produce radio flux densities far in excess of those measured, e.g. at 16 GHz for a wind of 5 arcsec angular size and assuming an electron temperatureTe=104K, similar to Bern 48, we would observe a
flux density ofS16 50 Jy. Since the majority of our observed
sources are extended on scales of greater than an arcsec we find this possibility untenable. The alternatives are that we are seeing radio emission from a neutral wind or molecular outflow, which is being shock ionized as it impacts on overdensities within the surrounding interstellar medium or the infalling cold dynamically collapsing medium (Curiel et al. 1987), or we are seeing radio emission from a partially ionized and possibly collimated flow (Reynolds 1986).
The cm-wave flux density from regions of shock ionization has been shown to be (Curiel et al. 1987; 1989)
S
ν
mJy
=3.98×10⁻²
M˙ ∗
10−7Myr−1
V∗
100 km s−1 0.68
×
D
kpc
−2 T
104K
0.45
4π
ν
5 GHz
−0.1 .
(2) Following Anglada (1996) and Anglada et al. (1998) we may re-express this relation at 16 GHz as
F
out
Myr−1km s−1
= 2.97×η10−4ξ(τ)
S
νD2
mJy kpc2
, (3)
whereη=(/4π) is the fraction of the stellar wind being shocked,
Foutis the outflow force or momentum flux, equivalent to the rate
of outflow momentum and often computed asFout=(P/τdyn). We
also introduceξ(τ)=τ/(1−e−τ) to allow for the fact that the radio emission may not be optically thin (Anglada et al. 1998), although this dependence on the optical depth,τ, is very weak.
The parameterηmay be considered as the efficiency of the shock and, following Anglada (1995), a value of η = 1 allows us to estimate the minimum outflow force required to explain the cm-wave emission as shock ionization.
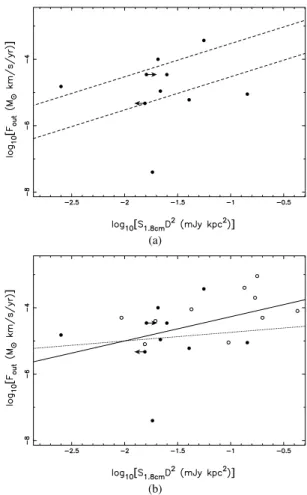
In Fig. 6(a) we plot the correlation of the radio luminosity as measured at 1.8 cm from this paper against the outflow force for each object where a value is available in the literature. For values and references see Table 5. We also plot the predicted outflow force from the Curiel model for an efficiency ofη=1 (minimum required force; lower line) and for an efficiency ofη=0.1.
There are considerable uncertainties in outflow force measure-ments and variations in how the force is estimated. Some estimates are derived from the total momentum observable in the outflow lobes, divided by a measure of the outflow dynamical time (e.g. B35A SMM-1 or CB188). Others use a measure of the force de-rived within an annulus around the outflow origin (Bontemps et al. 1996; e.g. L723 SMM-1, L1165 SMM-1), which provides a better estimate of the force for outflows which have been only partially mapped. Even the analyses which use similar methods can have variations, e.g. whether the maximum velocity in an outflow is used to compute the dynamical time or some average/typical velocity.
Figure 6. Distribution of radio luminosity versus outflow force (see Table 5 for references). (a) Data points are radio luminosities derived from the AMI-LA measurements at 16 GHz (see Table 5). The dashed lines show the theoretical relationship between 1.8 cm radio luminosity and outflow force (Curiel et al. 1989) for an efficiency ofη=1 (minimum required force; lower line) and an efficiency ofη=0.1 (see text for details). (b) Filled data points are radio luminosities derived from the AMI-LA measurements at 16 GHz as before; unfilled data points are from Anglada et al. (1998) extrapolated to 16 GHz. The dotted line shows a linear regression to the AMI-LA data alone, and the solid line shows the regression to the combined data sets.
Furthermore, missing flux density (in interferometric studies), high optical depths of CO emission in the outflow line wings and incli-nation effects which reduce the observed outflow velocities all tend to reduce the momentum actually observed.
Many studies follow the lead of Bontemps et al. (1996) and increase their outflow forces by a factor of 10 to account for optical depth and inclination effects (e.g. Visser et al. 2002). Other authors are able to correct for optical depth using observations of the rarer isotopologues of CO (e.g. L1221-IRS3; Umemoto et al. 1991) or note that the inclination corrections will be minimal (e.g. L1014-IRS; Bourke et al. 2005). A consistent approach for the outflows in our sample is not possible. Instead we use the values as stated in the literature, corrected only if we assume a different distance (Fout ∝ D). For a large enough sample of protostars, the trends
2674
A. M. M. Scaife et al.
However, even if the value were scaled upwards by an order of mag-nitude it would still fall below the predicted minimum force limit. A similar upwards scaling for B35A SMM-1 could be required, as optical depth and inclination were not accounted for, unlike L673 SMM-1, which has been scaled upwards following the prescription of Bontemps et al. (1996). If all the objects were treated in the same way it is likely that only L1014-IRS and L673 SMM-1 would re-main below the minimum line. Shirley et al. (2007) found the same situation for L1014-IRS at 3.6 and 6 cm and concluded that L1014 possessed an additional ionization mechanism aside from shock ionization. This additional component is most likely to be provided by a self-shocked spherical wind (Panagia & Felli 1975; Wright & Barlow 1975; Reynolds 1986). A caveat to this explanation is that spherical winds are usually associated with more evolved Class II objects.
As discussed earlier, a fully ionized spherical wind would be likely to produce a flux density far in excess of that which we mea-sure for L1014-IRS, particularly as the radio emission is slightly ex-tended. An alternative is to consider the model of Reynolds (1986), which allows for partially ionized, collimated winds. An advantage of this model above that of a spherical wind is that it allows for values of the radio spectral index from an unresolved outflow of
α >0.6, as has been observed in a number of cases. This model assumes power-law dependencies of physical parameters on the ra-dial distance, r, from the central source. The first of these is the jet half-width,w, which is assumed to obeyw=w0(r/r0)where
r0represents the ‘ionization radius’ at which the thermal emission
begins. For well-collimated flows, r0 and w0 are related by the
characteristic function θ0 =2w0/r0 ≤ 0.5. Reparametrizing the
equations of Reynolds (1986) in terms of the physical parameters observed here, we find that the predicted radio emission can be found using
Sν(mJy)=3.2×θ0 r
0
1015cm
2 ν
10 GHz
α ν m
10 GHz
2−α
× D
kpc
−2 T e
104K
FR(qτ, α)x0−2c(sini) 1+c
(4) where
ν m
10 GHz
2.1
=3.7×10⁻⁷θ−3 0
F
out
10−5Myr−1km s−1 2
× r0
1015cm
−3 V ∗
200 km s−1
−4 T e
104K −1.35
,
(5)
FR(qτ, α)= (2.1)
2
qτ(α−2)(α+0.1)
(6)
and
c=(1++qT)/qτ= α−2
2.1 . (7)
The parameters qT and qτ, corresponding to the notation of
Reynolds (1986), represent the power-law indices for temperature and optical depth, respectively. The values of these parameters for various models may be found in table 1 of Reynolds (1986), as may the predicted value ofα. The sinidependence in this formulation takes into account the inclination angle,i, of the outflow to the observer’s line of sight.x0is the fractional ionization of the gas,x,
at the ionization radius, which is a tunable parameter in the model and affects the optical depth through the free–free absorption coef-ficient,κν, in the standard way:τ ∝x2. A caveat to this model is
that there is no explanation of how the ionization is produced, and a value must simply be assumed.
By combining equations (4) and (5), we can see that this model predicts a correlation between the radio luminosity and the outflow force of
Fout∝L 2.1/2(2−α)
rad . (8)
For instance, in the case whereα=0.6 this correlation becomes
Fout∝L0rad.75.
From the number of data points in the AMI-LA data alone which have measurements ofFout (see Fig. 6a) there is no evidence of a
correlation and the Pearson product momentum correlation coeffi-cient is low:rxy=0.12. To enhance the trend we also include data
points extrapolated from the measurements of Anglada et al. (1998; Fig. 6b). These data are extrapolated from measurements at 3.6 cm using a power law with spectral indices derived from data at 3.6 and 6 cm. The flux density measurements, derived spectral indices and measured outflow forces for these data may be found in table 5 of Anglada et al. (1998).
Including the additional data, the correlation between outflow force and radio luminosity is still weak (rxy = 0.40). This may
be due to a lack of data, but could also be a consequence of the uncertainties in the quoted values ofFout. The correlation we find
from the AMI-LA data alone is
log[Fout(Myr−1km s−1)]
= −(4.48±1.26)+(0.26±0.74) log[L1.8 cm(mJy kpc2)]. (9)
If we also include the extrapolated data from Anglada et al. (1998) we find
log[Fout(Myr−1km s−1)]
= −(3.54±0.58)+(0.73±0.38) log[L1.8 cm(mJy kpc2)] (10)
(see Fig. 6b). This correlation is very similar to that found by Shirley et al. (2007) at 3.6 cm.
Due to the short frequency coverage of the AMI-LA band and the low signal-to-noise ratio of the objects in this sample we consider the errors on any spectral index derived from AMI-LA data alone too large to allow a reliable quantitative analysis. However, six of the objects in our sample have additional radio measurements at lower frequencies; these are listed in Table 6, and we use these to examine the spectral behaviour of the radio emission from these cores. Where the source has not been detected we take a 3σ upper limit on its flux density, withσequal to the rms noise as quoted in the reference.
We find that all of the sources have rising spectral indices, indicat-ing that they all possess partially optically thick free–free emission, with the exception of L723 SMM-1. This source has a spectral index consistent with optically thin free–free emission. We also note that the outflow force quoted for L723 SMM-1 is an order of magnitude larger than that of any other source (although this incorporates the upwards scaling of Bontemps et al. 1996). Such behaviour may be consistent with the shock ionization taking place further from the central protostar, since the model of Curiel et al. (1987, 1989) pre-dicts that the distance of the shock from the star,R, is proportional to the outflow force,
R
au
=1.22×10³τ−0.5
Fout
Myr−1km s−1 0.5
(11)
Table 6. Radio Spectral Indices.
Name S(6 cm) S(3.6 cm) S(2(1.8) cm) α Refs.
IRAM 04191 480±30 140±20 160±50, 172.9±17 0.45±0.20 1, This work
L1521F - <66 141±16 >1.10 2, This work
B35A <120 - 943±67 >1.77 3, This work
L723-SMM1 - 740±42 690±29 −0.10±0.21 4, This work
L1014 88±11 111±8 299±21 0.71±0.11 5, This work
L1221-IRS3 192±27 177±24 359±19 0.83±0.10 6, This work (1) AMB99; (2) Harvey et al. (2002); (3) Rodr´ıguez et al. (1989); (4) Anglada et al. (1991); (5) Shirley et al. (2007); (6) Young et al. (2009).
the index of the power law can have a wide range of values,
−4≤qτ ≤ −0.9, depending on the morphology of the outflow and whether recombination takes place. Substituting these values into equation (11) we find
R
au
∝
F
out
Myr−1km s−1
−0.5≤qF≤0.77
. (12)
Given that this is an oversimplification, it is therefore perhaps un-surprising that we find no correlation between spectral index and outflow force (r=0.12). In the case of the standard spherical flow (Panagia & Felli 1975; Wright & Barlow 1975)qτ = −3, which would produce a correlation ofR∝F−1
out. We might then interpret
the observed lack of correlation, both in this work and as found by Shirley et al. (2007), as evidence that the majority of cm-wave emission from protostars is not produced, at least solely, via this model.
6.3 The very low luminosity radio correlation
The correlation between radio and bolometric luminosity for lower mass protostars was first described for 3.6 cm emission by Anglada (1995) and recently updated by Shirley et al. (2007) who also in-cluded a correlation for 6 cm emission. This correlation is thought to arise as a consequence of the correlation between outflow force and bolometric luminosity (Shirley et al. 2007) as the degree of shock ionization is expected to be enhanced for more powerful outflows from higher luminosity sources (Anglada 1995). From our 1.8 cm
data we find correlations of
log[L1.8 cm(mJy kpc2)]= −(1.81±0.29)
+(0.54±0.38) log[Lbol(L)], (13)
log[L1.8 cm(mJy kpc2)]= −(1.23±0.65)
+(0.59±0.57) log[LIR(L)], (14)
with correlation coefficients ofrxy=0.77 and 0.84, respectively.
These regressions are fitted excluding data that are limits only. The correlation of bolometric luminosity with 1.8 cm luminosity is similar to that found for 3.6 cm data by Shirley et al. (2007) who found log[L3.6 cm(mJy kpc2)]= −(2.24 ± 0.03)+ (0.71±
0.02)log[Lbol(L)]. We note that there appears to be a trend in both
the normalization and multiplicative factors in the correlations as a function of wavelength, although we note that the limited number of wavelengths sampled may make this trend misleading.
The correlation between radio luminosity and LIR provides a
way of investigating the correlation with the internal luminosity of these sources. Dunham et al. (2008) define VeLLO sources as those possessing an internal luminosityLint≤0.1 Land use an
approx-imately constant ratio ofLint/LIR=1.7 to distinguish objects with
LIR≤0.05 Las VeLLOs. From Fig. 7(a) we can see that eight of
our sample satisfy this criterion. SinceLintis not a directly
observ-able quantity and may only be found through modelling the source, we can use the radio luminosity as a proxy for the internal luminos-ity of these objects by re-expressing the correlation in equation (14) as
Lint(L)112×[L1.8 cm(mJy kpc2)]1.7, (15)
2676
A. M. M. Scaife et al.
or, following Dunham et al. (2008) and normalizing to a distance of 200 pc, we can further define the internal luminosity radio estimator as
Lrad
int(L)=1.3×10− 5[S
1.8 cm(μJy)]1.7. (16)
We do not consider this estimator to be as accurate as the 70μm flux estimator (Dunham et al. 2008) as it relies on both the re-lationship of Lint to LIR which is currently modelled as a simple
ratio, and also because the correlation ofL1.8cmwithLIRis not as
tightly defined as that ofF70toLint. Two pieces of further work are
required to improve the radio estimator of internal luminosity (1) a better constrained relationship betweenLintandLIR, which uses
additional data to investigate and fit the low-luminosity excess of
Lint/LIRabove the constant ratio; and (2) more radio data to tighten
the observed correlation betweenLIR and Lrad. However, it does
provide a simple method to estimate the approximate evolutionary state of an object in the absence of complex models.
6.4 The non-detections
There are four protostellar (i.e. not starless) objects in our sample which are undetected by the AMI LA at 1.8 cm. The first of these is IRAS 04191. From our measured correlations both theLIRandLbol
of this object should place it firmly above the detection threshold in our map. From the correlation of radio and bolometric luminosity we would predict a flux density ofS1.8 cm518μJy. As IRAS 04191
lies approximately one-third of the way to the primary beam FWHM in our image we would expect to see IRAS 04191 detected at≈25σ in Fig. 1(a). However, IRAS 04191 is an evolved Class I object and if we make the assumption that the cm-wave emission we are seeing is a consequence of shock ionization due to a molecular outflow, we may explain the lack of radio emission from IRAS 04191 by the fact that Class I objects can have outflows from an order of magnitude to several orders of magnitude weaker than those of Class O sources (Bontemps et al. 1996; Curtis et al. 2010). The lack of cm-wave emission towards IRAS 04191 is in this case perhaps not surprising and may simply be due to a very weak outflow.
The second of our non-detections is L673-7-IRS. This object was identified as an embedded protostar by Dunham et al. (2008) from theSpitzerc2d data and hasLbol =0.09±0.03. It was
re-cently confirmed as a protostar through deep CO(2→1) observa-tions (Dunham et al. 2010) which measured an outflow momen-tum flux ofFout >2.1×10⁻⁶Myr−1km s−1 (orFout >4.5×
10−6M
yr−1km s−1 using the force per beam method (Fuller &
Ladd 2002; Hatchell, Fuller & Richer 2007). We can see from Fig. 6(a) that with an outflow of such low momentum flux any as-sociated radio emission may lie below our detection limit, possibly by more than an order of magnitude.
L1152-IRS is the third of our non-detections. The AMI-LA map of L1152-IRS shows some small structure at the pointing centre, coincident with the position of the sub-mm core. It is likely that the increased noise level in this data set due to satellite interference has prevented us from making a significant detection of this object.
The final non-detection in our sample is L1148-IRS2, and indeed L1148-IRS1 may be considered a non-detection also. L1148-IRS2 is the very lowestLIRobject in our sample and was classified by
Dunham et al. (2008) as a Group 6 source under their classification scheme. Group 6 has the lowest probability of being a true protostar and it is possible that L1148-IRS2 is in fact an external galaxy. However, for a true source of such low predicted LIR as
L1148-IRS2, we can see from the radio-IR–luminosity correlation (Fig. 7) that the AMI-LA observation would need to be at least an order of
Table 7. Detection statistics.
Class Total Det. Non-det. Rate (per cent)
VeLLO 8 5(2) 3(3) 63(100)
0 4* 3 1* 75
I 8* 6 2* 71
II 1* 1* - 100
Starless 3 0 3 0
magnitude deeper in order to detect this object at 3σ. In the case of L1148-IRS1 it is possible that theSpitzerspectrum is confused by an alternative physical process. It has been suggested (Hatchell & Dunham 2009) that theSpitzerspectra of some low-luminosity objects may confuse true embedded sources with H2 shocks or
PDR excitations (Smith et al. 2006). In this case such a hypothesis is supported by the lack of a compact sub-mm core in the SHARC-II 350μm observations of this field, which place an upper limit on the sub-mm flux density ofS350µm<0.11 Jy (Wu et al. 2007). Although
a compact peak in the sub-mm does not conclusively indicate the presence of protostellar activity, it is difficult to reconcile such activity in the absence of one.
6.5 The detections
The detections and non-detections are summarized in Table 7. The bracketed values indicate the number of VeLLOs within this bin that have not been confirmed independently of theirSpitzer iden-tification and which may be confused by the physical mechanisms discussed in Section 6.4. A starred value indicates a number which includes an object with a borderline class (e.g. L1152 SMM and Bern 48). The detection rate does not vary a great deal across the protostellar objects. A detection rate of zero towards starless objects confirms that the radio emission we see arises from a physical pro-cess other than a flattened dust tail due to vibrational emission. This highlights the ability of 16 GHz radio observations to identify pro-tostellar activity in cores which do not possess definitive sub-mm or infrared measurements.
7 C O N C L U S I O N S
The rising radio spectrum of the cm-wave emission from protostellar objects makes higher radio frequencies more suitable for their detec-tion than the longer wavelengths often employed. The low intensity of thermal dust emission at frequencies below≈50 GHz greatly reduces the possibility of confusing the observed radio emission associated with molecular outflows or stellar winds, and therefore an indication of protostellar activity, with the cold dust tail from starless cores. The combination of these two effects makes 16 GHz an effective frequency at which to distinguish protostellar objects and starless cores. This situation also extends to the VeLLOs, and embedded objects since the dense cores surrounding these objects are transparent to the longer wavelengths of the radio emission.