* Corresponding author. E-mail: [email protected] Alfredas LAURINAVICIUS (ORCID ID 0000-0001-8520-0906) Copyright © 2020 The Author(s). Published by RTU Press
This is an Open Access article distributed under the terms of the Creative Commons Attribution
LEVEL OF SERVICE EVALUATION METHODS:
POSSIBLE ADAPTATION FOR LITHUANIA
SANDRA VOLOSENKO1*, ALFREDAS LAURINAVIČIUS2 1, 2Vilnius Gediminas Technical University Environmental Engineering Faculty
Road Department, Vilnius, Lithuania
Received 30 January 2020; accepted 12 May 2020
Abstract. Level of Service is a quantitative measure to characterize operational
conditions within a traffic stream. There is a set of factors affecting the Level of Service. These factors describe geometric parameters of the road, traffic conditions, traffic regulation conditions and base conditions. In this article, the Level of Service as a criterion for operational quality is described. Level of Service factors and performance measures are described on the basis of Highway Capacity Manual considering verifications done by countries for their own road conditions. German Highway Capacity Manual (HBS) and Highway Capacity Manual are compared for the purpose of possible adaptation for Lithuania.
Keywords: Highway Capacity Manual (HCM), Level of Service (LOS),
2020/1 5(2 )
Introduction
For the general public, road quality means smooth coating or traffic without congestion without the need to wait for long hours in the middle of nowhere. The Trans-European Transport Networks (TEN-T) contribute to achieving sustainable and multimodal development of the European systems and to eliminating traffic congestion (Stefanović, Milijić, & Hristić, 2020). In addition to that, transport networks play a major role in ensuring sustainable mobility (Stefanović, Milijić, & Hristić, 2020). Road user’s perspective is very important for road network quality. An analysis of capacity and Level of Service is a mechanism used to determine how well a transportation facility is operating from a traveller’s perspective.
In their turn, Gajjar and Mohandas (2016) state that capacity analysis is a fundamental component in design, planning, operation and maintenance of roads. The capacity analysis is a tool that allows determining future capacity and efficiency of a planned or designed road. It allows increasing economic efficiency of the road at the very first stage of planning. Moreover, the analysis can solve problems for existing roads: traffic congestion, loss of time, etc.
The results of the capacity analysis are criteria describing the quality of the road. Capacity and Level of Service are quantitative measures to characterize operational conditions within a traffic flow. Level of Service is a qualitative measure used for indicating the traffic conditions in terms of speed, travel time, freedom to manoeuvre, comfort, convenience, traffic interruptions, safety, etc. (Gajjar & Mohandas, 2016). Gajjar and Mohandas (2016) maintain that Volume to Capacity Ratio (V/C ratio) is the strongest indicator of the level of congestion and corresponding Level of Service.
The main purpose of this article is to describe different methodologies for determining the Level of Service. It can be achieved by describing the main conditions of road network, parameters for analysis to be done. It is important to understand what traffic volume data need to be evaluated. The most appropriate methods for Lithuanian conditions should be compared.
Possible Adaptation for Lithuania
1.
General regulations
The Level of Service is mostly described in Highway Capacity
Manual 2010 (HCM) (Transportation Research Board, 2010). The HCM
describes a consistent system of techniques for the evaluation of the quality of service on highway and street facilities. However, it is hard to find one definition for the Level of Service. The Level of Service is a quality measure describing operating conditions with a traffic stream, generally in terms of such service measures as speed and travel time, freedom to manoeuvre, traffic interruptions, comfort, and convenience (Transportation Research Board, 2000).
The concept of Level of Service is a mechanism used to assess the operational performance of a road. The concept can be measured with respect to travel speed, traffic density, volume to capacity ratio. Similarly, to capacity analysis, the threshold values for each of these criteria vary with the functional class of the road (Jayaratne, Jayasinghe & Pasindu, 2016).
The Level of Service became an important criterion for operation quality assessment. It is used in the modern theory and practice of transportation planning, as well as design of various types of transport infrastructure (Kopylova, Mikhailoc & Shesterov, 2018). The Level of Service is calculated for different transport infrastructure facilities, such as roads, intersections, streets, metro lines, railways and other.
The Level of Service is usually described by letters A, B, C, D, E and F. Least congested conditions are described by LOS A, as LOS F means most congested conditions. Table 1 shows the general operating conditions represented by these Levels of Service. The division points between Levels of Service A through F were determined subjectively. The Level of Service has specific definitions, which can vary by facility type (American Association of State Highway and Transportation Official, 2001).
Table 1. The general operating conditions represented by Levels of Service (American Association of State Highway and Transportation Official, 2011)
Level of Service General operating conditions
A Free flow
B Reasonably free flow
C Stable flow
D Approaching unstable flow
E Unstable flow
2020/1 5(2 )
The HCM reports on the analytical methods. The analytical methods attempt to establish or predict the maximum flow rate for various facilities at each Level of Service. Each facility has five service flow rates, one for each Level of Service (A through E). In case of LOS F, it is difficult to predict the flow due to unstable traffic or vehicle delay is high. In addition to this, LOS F has stop-and-start conditions. The evaluation of Level of Service is the knowledge of the Passenger Car Unit (PCU). The PCU is a metric used to express the impact a given vehicle type has on traffic variables, in comparison to a passenger car (Jayaratne
et al., 2016). PCU factors are influenced by both roadway and traffic
characteristics.
The Level of Service can be defined by the service flow rate. The HCM presents a definition of the service flow rate, this definition is used by Luttinen (2001). The service flow rate is maximum hourly rate at which persons or vehicles reasonably can be expected to traverse a point or uniform segment of a lane or roadway during a given period under prevailing roadway, traffic, and control conditions while maintaining a designated Level of Service. In the HCM, the capacities and service flow rates are based on 15-minute time intervals. The 15-minute time intervals are a compromise between shorter time and longer interval difference. The difference between shorter interval length and longer interval length occurs due to short time traffic variations and stable traffic conditions (Luttinen, 2001).
Another approach to analysis of capacity and Level of Service is given in Swedish Highway Capacity Manual (SHCM). The Swedish Transport Administration published a new edition of the SHCM in 2014. The road design procedure applied in Sweden recommends a maximum degree of saturation for the design hour in the design year. Bergh stated that a maximum degree of saturation should normally be a degree of saturation maximum 0.8 for the theoretical 30th hour 8–15% of annual average daily traffic (ADDT) depending on road type, for year 20 after traffic opening.
Possible Adaptation for Lithuania American Association of State Highway and Transportation
Officials recommends that the 30th highest hourly volume of the year, abbreviated as 30 HV, should be generally used in design of hourly traffic volume. The reasonableness of 30 HV as a design control is indicated by the changes that result from choosing a somewhat higher or lower volume (American Association of State Highway and Transportation Officials, 2011).
2. A concept of Highway Capacity Manual
The HCM is a very popular methodology around the world to evaluate the capacity and the Level of Service. The HCM was developed in the United States of America. It describes roadway capacity under ideal conditions and then estimates practical capacities under prevailing conditions in the field. In addition to that, the HCM method with some small modifications was established in Denmark, Finland, Norway, and Australia (Velmurugan et al., 2010).
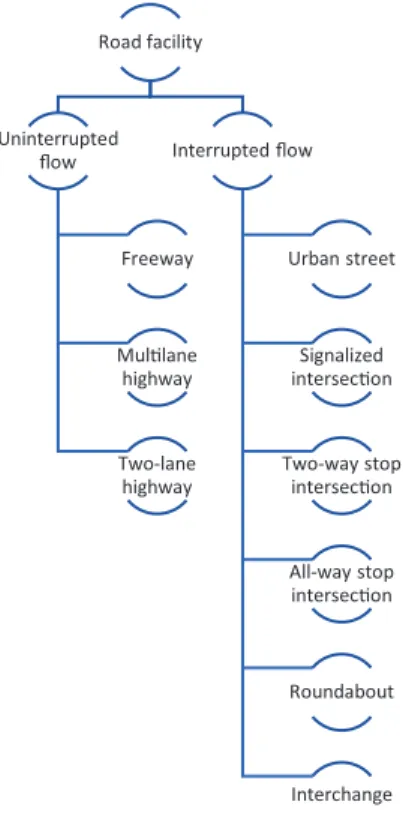
The HCM has four volumes which describe concepts, conditions of uninterrupted and interrupted flow and present application guide. Every analysis presented in the HCM is described for different facilities, such as freeways, highways, urban streets, roundabouts, and signalized intersections.
In the following chapter, the concept of the HCM is described. It is necessary to explain the factors affecting the Level of Service and performance measures for understanding capability to customize this method for conditions of Lithuania. Mostly, the following chapter presents conditions for uninterrupted flow facilities.
2.1. Factors affecting the Level of Service
2020/1 5(2 )
Types of traffic flow characterize the type of facility (as shown in Figure 1), but not the quality of the traffic flow at any given moment. The quality of the traffic flow can be described by quantitative measures as capacity and level of service. Uninterrupted flow and interrupted flow can be described by factors which can affect capacity and Level of Service. Base conditions for the calculation of the Level of Service are good weather, good pavement conditions, self-explaining roads, etc. These base conditions can be verified for facility type considering the difference in analysis. There are roadways conditions, traffic conditions and control conditions in Level of Service analysis. All these conditions must be evaluated with regard to their effect on the Level of Service.
Roadway conditions are presented as road geometric parameters and other elements. They may have influence on the Level of Service or performance measures (for example, speed). These conditions do not affect the capacity or maximum flow rate of the facility. Roadways conditions also include the number of lanes, the type of facility and its development environment, lane widths, shoulder widths and lateral clearances, design speed, horizontal and vertical alignments, and availability of exclusive turn lanes at intersections (Transportation
Figure 1. Classification of road facilities by flow
Road facility
Uninterrupted flow
Freeway
Mullane highway
Two-lane highway
Interrupted flow
Urban street
Signalized intersecon
Two-way stop intersecon
All-way stop intersecon
Roundabout
Possible Adaptation for Lithuania Research Board, 2000). For example, geometric parameters on the
analysed cross-section included lane width, shoulder width, access point per kilometre and directional split (Dębiński, Bohatkiewicz & Ziębowicz, 2019).
Analysis of the Level of Service allows evaluating traffic conditions; it covers a lot of factors. The traffic conditions can be described as vehicle type and lane or directional distribution. Lane or directional distribution has an impact on two-lane highway operation. On the other hand, vehicle types can be categorized into two groups: passenger cars and heavy vehicles. The HCM describes heavy vehicles as having more than four tires touching the pavement. The category of passenger cars includes small trucks and vans. Heavy vehicles affect traffic in two ways due to their size and operating capabilities. The first reason why heavy vehicles affect traffic is that they are larger than passenger cars and occupy more roadway space (Transportation Research Board, 2000). The second one is more critical. Operating capabilities of heavy vehicles are poorer than those of passenger cars, they have poorer ability to accelerate, decelerate or even maintain speed on upgrades. In many cases, heavy vehicles must operate at lower speed than passenger cars, forming gaps in the traffic stream.
Control conditions describe the quality of interrupted flow facilities. Traffic signals, stop signs, yield signs, and other types of control and regulations must be considered in the Level of Service analysis.
2.2. Performance measures
Performance measures can be calculated for each facility type that has a defined method for assessing capacity and Level of Service. These measures reflect the operating conditions of a facility. In the HCM, performance measures are described as travel speed, density on freeways, delay at signalized intersections, and walking speed for pedestrians. According to Forde and Daniel (2017), performance measures are used to assess the performance of urban street segments and provide insights into where road operations can be improved in the HCM 2010. Performance measures usually characterize flow conditions on a facility.
2020/1 5(2 )
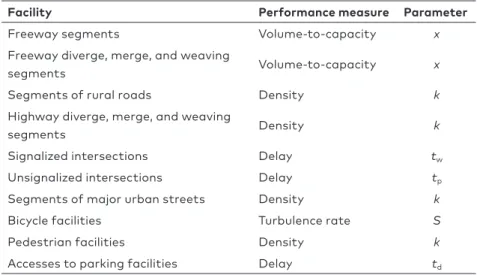
understand if the facility under consideration will be able to cope with the expected demand or if it needs an enlargement (Lemke, 2016). The HBS uses volume-to-capacity as a performance measure (parameter x) to describe freeway segments and freeway diverge, merge, and weaving segments. Density (parameter k) is used to evaluate segments of rural roads, highway diverge, merge, and weaving segments, segments of major urban streets and pedestrian facilities. Delay (parameters tw and tp) is the main performance measure for signalized intersections, unsignalized intersections and accesses to parking facilities. Bicycle facilities are described by parameter S, known as turbulence rate.
HCM is used in Egypt as guidelines. Hashim and Abdel-Wahed (2011) analysed two-lane roads in Egypt; the following seven performance measures were investigated:
• Average Travel Speed (ATS);
• Average Travel Speed of Passenger Cars (ATSPC);
• Average Travel Speed as a Percentage of Free-Flow Speed (ATS/ FFS);
• Average Travel Speed of Passenger Cars as a Percentage of Free-Flow Speed of Passenger Cars (ATSPC/FFSPC);
• Percent Followers (PF);
• Follower Density (FD);
• Percent Impeded (PI).
In turn, Luttinen (2001) describes five main qualifications of the service measures. It can be used for describing performance measures. They should reflect the users’ perception of the quality of traffic flow;
Table 2. Performance measures to determine LOS in the HBS (FGSV, 2015)
Facility Performance measure Parameter
Freeway segments Volume-to-capacity x
Freeway diverge, merge, and weaving
segments Volume-to-capacity x Segments of rural roads Density k
Highway diverge, merge, and weaving
segments Density k
Signalized intersections Delay tw
Unsignalized intersections Delay tp
Segments of major urban streets Density k
Bicycle facilities Turbulence rate S
Pedestrian facilities Density k
Possible Adaptation for Lithuania be easy to measure; be compatible with the service measures of other
types of highways facilities; describe both uncongested and congested conditions; as far as possible, be also useful in safety, economic and environmental analyses (Luttinen, 2001).
Performance measures are important criteria to consider in calculation of the Level of Service. It is important to understand that any facility can be described by specific performance measures. In some case, performance measures can be more important for decision making than LOS rating. As an example, HCM describes the length of queue caused by oversaturation.
3. Comparison of HBS and HCM
In the following article, methods of evaluation of the Level of Service are described. Research area is Level of Service parameters and methods as applied for freeways. The main aim is to understand two methodologies of Level of Service assessment: Highway Capacity Manual (HCM) (Transportation Research Board, 2010) and German Highway Capacity Manual (HBS) (FGSV, 2015). Recognition of the differences between the methods is important in deciding which method can be adopted for Lithuanian road conditions.
The second edition of the German Highway Capacity Manual was published in 2015. In the HBS, a basic freeway segment is defined as the part of a freeway carriageway between adjacent interchanges, which is further divided into sub-segments with major parameters affecting the capacity change within the segment (Geistefeldt, 2016). The current design capacities given in the HBS 2015 (Lemke, 2016) are based on capacities of more than 50 freeway segments which were empirically estimated by analysing the speed-flow diagram based on loop detector data (Geistefeldt, 2016). As described earlier, HCM specifies that analysis of the Level of Service can be done for freeway elements separately.
The HBS assessment procedure for basic freeway segments considers parameters influencing the capacity. Geistefeldt (2016) reports the following parameters:
• proportion of heavy vehicles;
• location of the freeway inside or outside urban areas, representing the share of commuters;
• number of lanes;
• gradient, if greater than 2%, and
2020/1 5(2 )
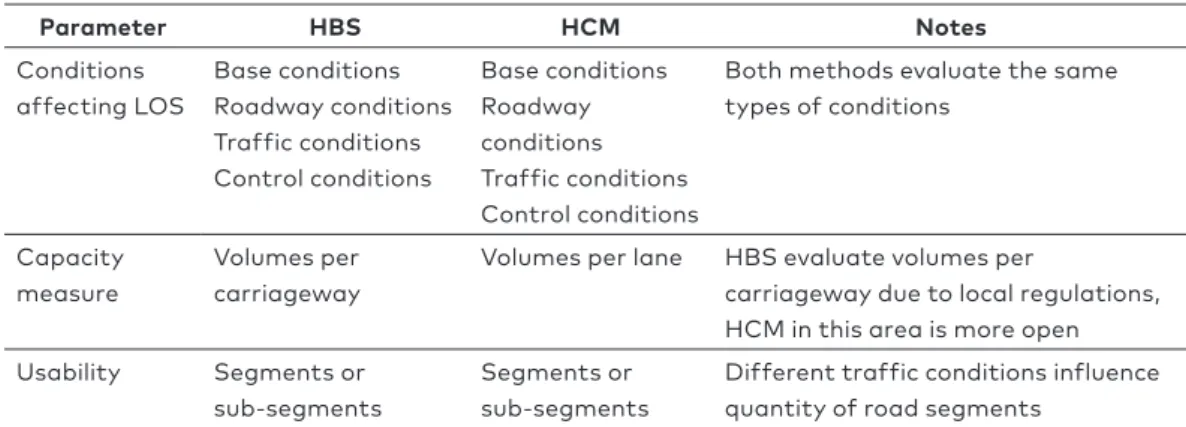
In addition to that, Geistefeldt (2016) in his article reports that HBS design capacities are given as volumes per carriageway. It may be explained by regulations of Germany, where heavy vehicles are only allowed to travel on the rightmost lane. Meanwhile, design capacities are given as volumes per lane in HCM (Transportation Research Board, 2010).
Geistefeldt (2016) describes the Level of Service as volume-to-capacity (V/C) ratio, which means that it is a measure of effectiveness for basic freeway segments. The HBS is concerned about the average travel speed more than about the Level of Service due to regulations of Germany, where freeways have no speed limits.
Table 3 shows comparison of HBS and HCM methods. Both methods have certain advantages and disadvantages. The main disadvantage of HBS is that this method is created for the German road system. Germany has self-explaining road concept, but there are too many specific regulations concerning freeways traffic conditions. These regulations influence calculations of the Level of Service. On the other hand, HCM is an American methodology and its conditions must be verified for the European countries such as Lithuania. There are a lot of European countries successfully using HCM methodology with certain changes.
For the customization process of HCM to Lithuania, the following challenges emerge.
1. Freeways of Lithuania traffic flow conditions must be investigated. It should help identify uninterrupted flow and interrupted flow facility parts in freeways.
2. Proportion of heavy vehicles in traffic should be investigated as well as their impact on the traffic flow.
Table 3. Comparison of HBS and HCM methods in evaluation of the Level of Service
Parameter HBS HCM Notes
Conditions affecting LOS
Base conditions Roadway conditions Traffic conditions Control conditions
Base conditions Roadway conditions Traffic conditions Control conditions
Both methods evaluate the same types of conditions
Capacity measure
Volumes per carriageway
Volumes per lane HBS evaluate volumes per
carriageway due to local regulations, HCM in this area is more open Usability Segments or
sub-segments
Segments or sub-segments
Possible Adaptation for Lithuania 3. Analysis of performance measures should be done. An analysis
should show if existing performance measures are effective for the Lithuanian traffic conditions in freeways or they should be customized as well.
Conclusions
To sum up, HCM is a comprehensive methodology which describes every possible traffic situation and how it can affect the quality of the road, its capacity and the Level of Service. HBS is more focused on user quality. Different countries, such as Egypt, Spain, and Finland, are adapting HCM for their road systems adding new performance measures, which describe specific conditions of a country. Comparison of two methods and their potential allowed reaching the following conclusions and results:
• The Level of Service is a quality measure describing operating conditions of a traffic stream, generally in terms of such service measures as speed and travel time, freedom to manoeuvre, traffic interruptions, comfort, and convenience. The Level of Service is usually described by letters A, B, C, D, E and F. Least congested conditions are described by LOS A, as LOS F means most congested conditions.
• Road traffic can be described as uninterrupted flow and interrupted flow. Road facilities are categorized into two categories of flow. There are base conditions, roadways conditions, traffic conditions and control conditions in the Level of Service analysis. All these conditions should be evaluated considering their effect on the Level of Service by road facility type.
• Performance measures can be calculated for each facility type that has a defined method for assessing its capacity and the Level of Service. These measures reflect the operating conditions of a facility. In HCM, performance measures are described as travel speed, density on freeways, delay at signalized intersections, and walking speed for pedestrians. Performance measures usually characterize flow conditions on a facility.
2020/1 5(2 )
REFERENCES
American Association of State Highway and Transportation Officials. (2011). A
policy on geometric design of highways and streets (pp. 2–66). Washington,
USA.
Bergh, T., Nordqvist, K., Strömgren, P., Davidsson, F., Bång, K. L., & Carlsson, A. (2016). Capacity Issues in Sweden – Applications and Research.
Transportation Research Procedia, 15, 36–50.
https://doi.org/10.1016/j.trpro.2016.06.004
Dębiński, M., Bohatkiewicz, J., & Ziębowicz, J. (2019). Classification of Roads According to the HCM6 Method and Its Application in Polish Conditions.
Transportation Research Procedia, 40, 1017–1022.
https://doi.org/10.1016/j.trpro.2019.07.142
FGSV (Forschungsgesellschaft für Straßen- und Verkehrswesen) [Road and Transport Association]. (2015). Handbuch für die Bemessung von
Straßenverkehrsanlagen (HBS) [German Highway Capacity Manual]. Cologne.
Forde, A., & Daniel, J. (2017). Performance Evaluation of the HCM 2010 Platoon Dispersion Model Under Midblock Pedestrian and Truck Traffic Friction Conditions. Journal of traffic and transportation engineering (English edition),
4(6), 522–534. https://doi.org/10.1016/j.jtte.2017.04.003
Gajjar, R., & Mohandas, D. (2016). Critical Assessment of Road Capacities on Urban Roads – A Mumbai Case-Study. Transportation Research Procedia, 17, 685–692. https://doi.org/10.1016/j.trpro.2016.11.124
Geistefeldt, J. (2016). Assessment of Basic Freeway Segments in the German Highway Capacity Manual HBS 2015 and Beyond. Transportation Research
Procedia, 15, 417–425. https://doi.org/10.1016/j.trpro.2016.06.035
Hashim, I. H., & Abdel-Wahed, T. A. (2011). Evaluation of Performance Measures for Rural Two-Lane Roads in Egypt. Alexandria Engineering Journal, 50(3), 245–255. https://doi.org/10.1016/j.aej.2011.08.001
Transportation Research Board. (2010). Highway Capacity Manual 2010. Retrieved from http://www.trb.org/Main/Blurbs/164718.aspx
Jayaratne, D. N. D., Jayasinghe, P. W. P. R., & Pasindu, H. R. (2016). Evaluation of Level of Service for two-lane roads in Sri Lanka. In IESL Annual Sessions. Kopylova, T., Mikhailov, A., & Shesterov, E. (2018). A Level-of-Service Concept
Regarding Intermodal Hubs of Urban Public Passenger Transport.
Transportation research procedia, 36, 303–307.
https://doi.org/10.1016/j.trpro.2018.12.087
Lemke, K. (2011). Estimation of the Peak-Hour Demand in the German Highway Capacity Manual. Procedia – Social and Behavioral Sciences, 16, 762–770. https://doi.org/10.1016/j.sbspro.2011.04.495
Lemke, K. (2016). The New German Highway Capacity Manual (HBS 2015).
Transportation Research Procedia, 15, 26–35.
https://doi.org/10.1016/j.trpro.2016.06.003
Luttinen, R. T. (2001). Capacity and level of service on Finnish two-lane highways (No. 18/2001). Helsinki: Finnish Road Administration.
Possible Adaptation for Lithuania an instrument for establishing the Trans-European Transport Network.
Transportation Research Procedia, 45, 491–498.
https://doi.org/10.1016/j.trpro.2020.03.043
Velmurugan, S., Errampalli, M., Ravinder, K., Sitaramanjaneyulu, K., & Gangopadhyay, S. (2010). Critical Evaluation of Roadway Capacity of Multi-Lane High Speed Corridors Under Heterogeneous Traffic Conditions Through Traditional and Microscopic Simulation Models. Journal of Indian