IC, 2018 – 14(3): 445-483 – Online ISSN: 1697-9818 – Print ISSN: 2014-3214 https://doi.org/10.3926/ic.1168
The capitalization of operating leases: Analysis of the impact on
the IBEX 35 companies
Francisca Pardo , Begoña Giner Universitat de València (Spain) [email protected], [email protected]
Received September, 2017 Accepted April, 2018
Versión en español
Abstract
Purpose: This paper analyzes the consequences of the change in the accounting rules about operating leases in the companies and users of financial information.
Design/methodology: We use the constructive capitalization method to estimate the liabilities and leased assets and perform an ex ante analysis of the regulatory impact in the IBEX 35 non-financial companies. Non-parametric tests are employed to examine the effect on certain ratios, and through a multivariate regression we investigate the business characteristics that explain the variation of EBITDA.
Findings: The ratios under study are significantly affected by the capitalization of operating leases. The explanatory analysis shows that larger companies, which have a higher market valuation and belong to the retail sectors are the ones with a greater increase in EBITDA.
Research limitations/implications: The sample size is small, which implies some caution in the generalization of the results. Certain hypotheses have been introduced to apply the constructive method, although the sensitivity tests confirm that the results are robust.
Practical implications: In certain cases, to avoid non-compliance with restrictions, particularly in debt contracts, contract renegotiations should be initiated. The constructive method yields liabilities and assets significantly smaller than other simpler methods (such as the factor method), so these results can be a relief for certain non-sophisticated users.
Social implications: Investors, shareholders and lenders, and other users will have more transparent information, which should improve their decision-making.
Originality/value: The study of the impact on the magnitudes of the balance sheet and the financial ratios is complemented with a descriptive analysis, which takes into account the industry, and with the modeling of the explanatory factors of the change in EBITDA.
Keywords:Operating leases, IFRS 16, Constructive capitalization method, Financial ratios, Accounting standard impact
1. Introduction
The accounting standards dealing with leases have undergone significant changes over the years, with the most recent ones having been carried out in 2016 with the approval of the International Financial Reporting Standard (IFRS) 16 (IASB, 2016a) and the Accounting Standards Update (ASU) No. 2016-02 (Topic 842) by the International Accounting Standards Board (IASB) and the Financial Accounting Standards Board (FASB), respectively. These standards, although not identical, fundamentally agree that all lease contracts must be included as assets and liabilities on the balance sheet. It is a change that, judging by the concerns that mainly the affected firms have expressed before its approval, could have a considerable economic impact. Given that, according to Regulation (EC) 1606/2002 of the European Parliament and of the Council regarding the application of international accounting standards, once these standards are accepted by the European Commission (EC) they are mandatory for the consolidated accounts of the firms listed in the European Union (EU), in this work we are going to focus on IFRS 16: “Leases”. This standard was adopted in the last quarter of 2017 and will come into force in 2019. In Spain it is common practice to align the local regulations —General Accounting Plan (GAP) and resolutions of the Institute of Accounting and Auditing (Instituto de Contabilidad y Auditoría de Cuentas - ICAC)—to those stipulated in the IFRS, which suggests that the new standard could have a cascading effect and provoke changes that affect other firms and financial statements. In this regard, Molina and Mora (2015, p.111) note that: “There is also the belief that such a radical change of model may end up moving to the national regulations and to smaller-sized entities that are not listed on the stock markets.”
In this paper we examine the impact of IFRS 16 on the financial statements of a sample of Spanish firms, with the aim of understanding how certain key accounting metrics used to judge their financial situation may be altered. Likewise, we analyse the characteristics of the firms that may be most affected by the regulatory change.
The great opposition to this accounting standard can be demonstrated by its complex gestation. The due process of IASB standards involves a series of steps, which necessarily include the publication of at least one exposure draft (ED). In this case, in addition, a discussion paper (DP) (IASB, 2009) was issued beforehand and two drafts were also issued (IASB, 2010, 2013). Moreover, these documents must be submitted to public opinion so that interested parties can make suggestions and comments. More than 1,700 letters were received in response to the various documents referring to this project, which exceeds the number normally sent in other cases. The regulatory process also requires an analysis of the expected effects of the accounting standard. In 2016, the analysis of this project was published, whose findings highlight the nearly three trillion dollars of payment commitments for leasing that listed firms, that use IFRS or US GAAP, do not include on the balance sheet, but following the rules currently in force disclose in the notes to the financial statements (IASB, 2016b). The extent to which their recognition on the balance sheet could have economic consequences and affect debt and remuneration contracts, among others, as well as improve the decisions of investors, is the question that underlies this work.
(earnings before interest, taxes, depreciation and amortization), which, unlike the previously mentioned ones, improves upon the application of the new standard. The results reveal that the largest firms, which have a higher valuation in the market and belong to the retail industries, see the greatest improvement in this indicator. These results contribute to increasing the knowledge on how the accounting change will affect Spanish firms and how to avoid misunderstandings about its implications. Indeed, as a consequence of the new accounting standard, firms do not “worsen” or “improve” their economic-financial situation, but rather the information should provide a more transparent image of the firm, which should result in better decisions with respect to investment and financing. In addition, the disadvantages of using heuristic methods are noted, given that, although they are simpler, they can lead to a greater error.
In order to have a better idea of the regulatory change, in this paper we first discuss the difficulties of the approval process of IFRS 16, and then present the main developments in the accounting treatment of leases. Next, the conclusions of the studies that have analysed the impact of the change are presented. The work continues with an empirical part in which the analysis of the regulatory change on the IBEX 35 firms is addressed and, lastly, the conclusions of the work are laid out in the final section.
2. The development of the leases project
Not only Spanish GAP, but also the international and US accounting standards in force —IAS 17 (IASC, 1997) and Statement of Financial Accounting Standard (SFAS) 13 (FASB, 1976), renamed Accounting for leases, ASC Topic 840, respectively— distinguish between finance and operating leases, and, based on the transfer of the risks and rewards inherent in the ownership of the asset, establish two differentiated procedures. If these are transferred, the lease is classified as finance, giving rise to the recognition of an asset and a liability on the balance sheet. Otherwise, the lease is considered operating and does not give rise to recognition on the balance sheet but is reflected as an expense in the income statement when it is accrued; in addition, information must be provided in the notes to the financial statements on the payment commitments.
To the extent that operating leases do not penalise debt ratios and usually lead to greater profitability, firms prefer to classify lease contracts as operating leases. This has led, for example, to rating agencies, such as Standard & Poor’s and Moody’s, developing models to capitalize off-balance-sheet leases. The question is whether they are correct in the adjustments, and if other users are aware of the unrecognized debts. In this regard, Mr Cooper, a member of the IASB at that time, warned about the magnitude of the figures finally recognized, that is, about the debt that eventually emerges, since it is not obvious that the same rigour or the same critical judgment is imposed on the figures disclosed as on those included in the main financial statements, specifically referring to the recognition of extensions in the contract and cancellation options. As a consequence, it is possible that different figures will be recognized than those suggested by the disclosed leases (Cooper, 2017).
Thus, in order to avoid adhoc contracts and confusion over the magnitude of existing debts, both the IASB and the FASB considered developing a project that would eliminate the differentiation. This project began in 2006 and was under taken within the framework of the convergence project between the two institutions that followed the 2002 Norwalk Agreement. However, given that in 2013 the convergence project was abandoned, it is not surprising that finally two non-identical, albeit similar, standards that require the capitalization of all leases have been produced.
3. The regulatory model according to IFRS 16
It is important to note that, unlike what is currently established in IAS 17, IFRS 16 requires for the identification of a lease contract, in addition to the right to use an identified asset, the right to control the use of that assset. The lessee must recognize an asset, the right-of-use asset, which represents its right to use the underlying leased asset, and a lease liability, which represents its obligation to make the payments derived from it. However, the new standard allows the lessee not to apply this general criterion in two cases: short-term leases and those of low-value assets. A short-term lease is that, at the commencement date, has a lease term of 12 months or less, and does not contain a purchase option. With regard to leases of low-value assets(for example: tablets and personal computers, small items of office furniture and telephones), the value of the underlying asset must be considered in terms of its value when it is new, regardless of the age of the leased asset. Neither of these two exceptions is contemplated in the current IAS 17.
If the same contract includes, in addition to a lease, other components (for example, maintenance services or other services), in principle they must be separated and accounted for independently (following the corresponding standard according to their nature). However, IFRS 16 allows for the components not to be separated by type of underlying asset, and, instead, accounting for everything as a single lease (IASB, 2016a, para. 15).
In general, the accounting treatment of leases under IFRS 16 is similar to that established by the current rules for finance leases, except for a few differences. Thus, the lease liability includes the present value of the future lease payments, which are basically: fixed payments, including the so-called “in substance” fixed lease payments (less any incentive that will be received from the lessor); variable lease payments referenced to an index or to an interest rate (for example, to the CPI or the Euribor); amounts that are expected to be paid under a residual value guarantee; the exercise price of a purchase option (if the lessee has reasonable certainty that it will be exercised); payments for penalties for terminating a lease (if the lease term suggests that the lessee will exercise the option to terminate it). However, in IAS 17, contingent lease payments are not included in the initial value of the liability, which may be a relevant difference since these payments are currently recognized in the operating income regardless of the classification of the lease.
Regarding the implicit interest rate of the lease, given the difficulties in gathering the information for its determination, as Mr Scott, a member of the IASB, points out, it is probable that many firms use the alternative of the incremental interest rate (Scott, 2017).
As for the right-of-use asset, it is initially valued at the initial amount of the liability plus any payment made prior to the start of the lease contract (less incentives, if any), the direct costs incurred by the lessee and an estimate of costs of dismantling and removing the underlying asset. Subsequently, the asset must be amortized using a systematic and rational method (generally linear), and, additionally, its possible impairment should be recognized, if applicable. Since the effective interest rate method is applied to the liability, the recognition of lease expenses is not linear (as is generally the case in current operating leases) but decreasing.
In addition, the lessee must remeasured the lease liability in some cases such as: i) changes in the amount to be paid under a residual value guarantee, ii) changes in the lease payments due to variations in an index or the interest rate used to determine said payments, iii) changes in the lease terminitially established as a consequence of a change in the non-cancellable period thereof, and iv) changes in the valuation of the exercise price of an option to purchase (IASB, 2016a, para. 40-43). The first two changes must be calculated using the original interest rate, while for the last two cases, the new cash flows must be discounted using a new interest rate, revised on the date of change. The remeasurements are treated as adjustments in the value of the asset, unless its value is zero, in which case any remaining amount must be allocated to the income statement.
asset. Thus, interest expense is a financial expense, while depreciation is an operating expense. In the statement of cash flows, cash payments for the principal of the lease liability should be classified as a financing activity, while cash payments for the interest charge of the lease liability should be presented in consistence with other payments of interest charges. However, short-term lease payments, payments for leases of low-value assets and variable lease payments not included in the valuation of the lease liability must be included in the operating activities in the income statement, and they are considered operating activities in the statement of cash flows.
4. Effects of the lease capitalization in the previous literature
The pioneering work of Nelson (1963), produced before any rule required the capitalization of leases, was followed by those that analysed the impact of the US standard that obliged the capitalization of finance leases (Imhoff & Thomas, 1988), but other later works, also referring to US, focused on the operating lease capitalization (Imhoff, Lipe & Wright, 1993; Mulford & Gram, 2007). This approach has also been followed in other countries, such as the UK by Beattie, Edwards and Goodacre (1998) and Goodacre (2003), New Zealand by Bennett and Bradbury (2003), Canada by Durocher (2008), Germany by Fülbier, Silva and Pferdehirt (2008), Spain by Fitó, Moya and Orgaz (2013), Barral, Cordobés and Ramírez (2014) —which also considers the UK—, Giner and Pardo (2017) and Gill de Albornoz, Rusanescu and Cabedo (2017). To this end, the amount of off-balance liabilities is estimated, which are incorporated into the financial statements as if they were recognized by the firms. The general conclusion is that the ratios (particularly those of the balance sheet and, most importantly, those of leverage) are affected, as well as some profitability ratios, although these papers detect important differences between firms and between industries. It is precisely this worsening of financial indicators that helps us to understand the strong reluctance of firms to capitalize leases in general, and operating leases in particular, as has been shown in the comment letters sent throughout the due process.
The PwC study on the impact of the capitalization of operating leases, referring to 3,199 listed firms that use IFRS, reveals an average increase in debt of 21% and EBITDA of 11% in the EU. Regarding the debt ratio (total debt divided by EBITDA) it goes from 1.55 to 1.78, while solvency decreases from 46% to 41.6%. It is important to note that the impact differs between industries, being especially noteworthy in the retail, airline, professional services and health industries (PwC, 2016). EFRAG published a study in 2016 on the impact in the EU, based on the largest firms by market capitalization and with the highest volume of operating leases (EFRAG, 2016). Essentially, it concludes that the change represents an average increase in the level of debt in relation to the financial debt of 4% (the energy industry, at 26%, being the most affected), although if the financial sector is excluded, the increase reaches 16%, while equity is reduced by 0.6% (by 0.9% if the financial industry is excluded). Also in 2016, the effects analysis of the IASB was made public; based on 1,022 firms that apply IFRS, of which 348 are European, it concluded that the increase in the amount of debts is 1,661.8 billion dollars, which represents 5.4% of the total assets, which reaches 20% in the air, retail, transport and leisure industries (IASB, 2016b). It should be noted that, with the exception of the EFRAG study, the other analyses exclude the financial sector.
On the other hand, through a survey to 284 executives to find out their views on how the new way of accounting for operating leases may affect firms, Deloitte (2011) concludes that the rule may have a significant effect and firms do not seem to be prepared. 68% of the respondents consider that they will see their leverage ratios increased (specifically debt over equity), which, according to 40% of the respondents, will make it difficult to obtain financing, will reduce the lease term, and 25% consider that it will make lessees prefer purchasing over leasing. Other ratios they were asked about are ROA (return on assets) and interest coverage, and according to 49% and 40%, respectively, the effect will also be relevant. They were also questioned about the impact on operating margins and EBITDA, with 37% and 41% responding, respectively, that the impact will be material.
Indeed, certain financial ratios are often included in debt agreements as restrictions or covenants (Beneish & Press, 1993; Nikolaev, 2010; Franz, HassabElnaby & Lobo, 2014).
As has been shown, the application of IFRS 16 will alter to a greater or lesser extent the accounting figures and financial ratios; however, if this is going to provoke breaches in the covenants, which require the renegotiation of the loan conditions, among other contractual agreements, it is an aspect that cannot be predicted without having a precise knowledge of the terms of the contracts and their restrictions. In the aforementioned survey 44% of the executives interviewed feel that it will have an impact on these restrictions, although 32% believe the contrary (Deloitte, 2011). Faced with these divided opinions, we should also raise the opinion expressed by IASB staff in the effects analysis document (IASB, 2016b), according to which there should be no impact on the cost of debt and covenants, since it is thought that there will be renegotiations. On the other hand, Demerjian (2011) and Paik, van der Laan Smith, Lee and Yoon (2015) argue that the off-balance-sheet debts are already taken into account in the negotiations prior to setting the covenants, so that a possible regulatory change should be innocuous. The IASB document also agrees that there may be a change in the form of financing, purchase versus leasing, in those cases in which the reason for having an operating lease was to remove it from the balance sheet.
In short, after the application of IFRS 16, firms will have more debts and assets on the balance sheet, which will generally entail a higher value for the leverage ratio and perhaps a reduction in economic profitability. Faced with the above, which suggests an apparent worsening of the business situation (we must not forget that the payment commitments, although not recognized, do exist), one must counter with the improvement in the EBITDA that the new treatment of operating leases entails. Indeed, this indicator does not include financial expenses or depreciation among its components, so replacing the lease expense with depreciation and interest will result in a higher EBITDA.
5. Empirical analysis
5.1 Sample
The initial sample is composed of the firms that made up the IBEX 35 in 2014, and that disclosed information about operating leases in their notes to the financial statements. These firms have been frequently considered in prior studies, since they represent a collective in which some of the most relevant issues related to accounting and financial information can be identified (Ortiz & Marín, 2014; Reverte, 2009, 2016). We exclude financial institutions and insurance firms, which, in addition to being common in the accounting literature given the different interpretation of financial ratios, are especially frequent when analysing the impact of the capitalization of operating leases. In fact, as indicated above, they are only included in the study by EFRAG (2016). It should be borne in mind that the inclusion of the financial and insurance industries may underestimate the relative impact, since in these entities, in addition to being large, they tend to have few material operating leases. Additionally, it is necessary to eliminate those firms that do not report operating leases in the notes, so that the sample is reduced to 20 firms. The simulation study has been done for the four-year period between 2010 and 2013, inclusive.
The information necessary to estimate the operating leases has been obtained manually from the notes, while the additional financial and market data are from the Sistema de Análisis de Balances Ibéricos (SABI) database. As required by IAS 17, the minimum future payments for operating leases, categorisedas those corresponding to one year, between one and five years and after five years, must be disclosed. These data allow us to know a first approximation of the amount of unrecognized debt, but given that the figure is not discounted, it is overvalued.
are measured as if they were finance leases from the beginning. In the following subsection we explain how this method operates.
It is also common to use the factor method, which entails multiplying by a coefficient (usually 8) the lease payments that are included in the income statement (Imhoff et al., 1993; Ely, 1995; Beattie, Goodacre & Thomson, 2000; Bennett & Bradbury, 2003). In such a case, assets and liabilities increase equally, without any impact on equity. This procedure is used as a sensitivity analysis in this work.
5.2. Constructive capitalization method
The implementation of this method requires the introduction of certain simplifying hypotheses. Following Imhoff et al. (1991) and Fülbier et al. (2008), we assume the following: 1) at the beginning of each lease agreement, the book value of the leased asset is equal to the value of the lease liability; 2) at the end of the lease, the book values of assets and liabilities are zero; 3) the asset is depreciated using the straight-linemethod; 4) all lease payments are made at the year-end; 5) the lease payments are constant; and 6) minimum lease payments are divided into five categories of contracts with different lifetimes (from one year to five years or more).
Since the future minimum operating lease payments (MOLP) are not disclosed separately by year (except for the first), it is necessary to isolate payments per year. For payments of two to five years, a geometric degression model is assumed in which lease payments decrease at a constant rate; the payment of any year (MOLPt + 1) is
obtained by multiplying the payment of the previous year (MOLPt) by the degression factor (df), as follows:
MOLPt + 1 = MOLPt x df (1)
so the degression factor is obtained from the following expression:
MOLP 2 - 5 = MOLP1 x df 1 + MOLP1 x df 2 + MOLP1 x df 3 + MOLP1 x df 4 (2)
or what is the same:
MOLP 2 - 5 =
∑
(t=1)
4
MOLP1 x df t (3)
The above expression produces decreasing lease payments, which is consistent with having several lease agreements with different lengths(and not just one contract). Taking into account these aspects, and following Fülbier et al. (2008), we divide the MOLP into five categories of contracts with different remaining lifetimes (one year up to five years or more) and we obtain the present value of each group. To separate them we calculate the difference between the MOLP in two consecutive years (MOLPt – MOLPt + 1), which represents the contract that
ends each year. In the last period of annual payments, we divide the aggregate payment after year five into equal annual payments to the fifth group (MOLP5+/MOLP5), which allows us to approximate the number of years of payments remaining to be make. This is consistent with the general assumption that lease agreement payments are constant. We must point out that we use the information provided in the notes to the greatest extent possible, so when the firm discloses the annual disaggregated payments, we use this information. For those firms that disclose MOLP in shorter periods, we have grouped the payments in the standard periods in order to implement the method in a uniform manner.
we have applied the median of the rest of the firms that do reveal this rate (4.36%). After making the appropriate calculations, the applied discount rates range between 2.80% and 8.51%.
Regarding the asset value, although it is equal to the liability at inception of the lease, at any other time it differs. Thus, the value of the asset is a function of the present value of the MOLP at the beginning of the lease (PVTL)
and the relationship between the remaining life of the lease (RL) and its total life (TL):
Asset value = PVTL x RL
TL (4)
Given that the lease liability at the end of the year is equal to the present value of the MOLP during the remaining useful life (PVRL), the relationship of any leased asset with the corresponding liability at any time
during the contract period is determined by:
RL TL X
PVTL
TLRL (5)
or what is the same:
RL TL X
1−(1+i)−TL
1−(1+i)−RL (6)
Since we do not have the total MOLP, we apply the previous formula and use the estimated interest rate. In addition, since the total life of the lease is not disclosed in the financial statements, in order to estimate the amount of assets not recorded when applying the constructive method, we assume that the already expired proportion of the lease life (VR/VT) is 50%, in line with previous works (Ely, 1995; Bennett & Bradbury, 2003; Durocher, 2008; Fülbier et al., 2008). We must emphasize that this assumption has a minimal effect on the income figure, since the sum of interest and depreciation is very similar to the lease expense. However, in a sensitivity analysis we also consider 60%, like Fülbier et al. (2008) and Fitó et al. (2013), among others.
Capitalization has an impact on the deferred tax, and its amount is obtained by multiplying the difference between the asset and the liability by the estimated tax rate. The difference between both amounts (the difference between the asset and the liability minus the deferred tax decrease) is the amount by which the equity will be reduced. The tax rate is obtained by dividing the corporate tax expense by the earnings before taxes (herein after EBT) of the corresponding year. In the event that the EBT is negative or in the absence of tax expense, the tax rate that has been used is the tax rate applied in the nearest fiscal year.
5.3. Impact of the capitalization of operating leases
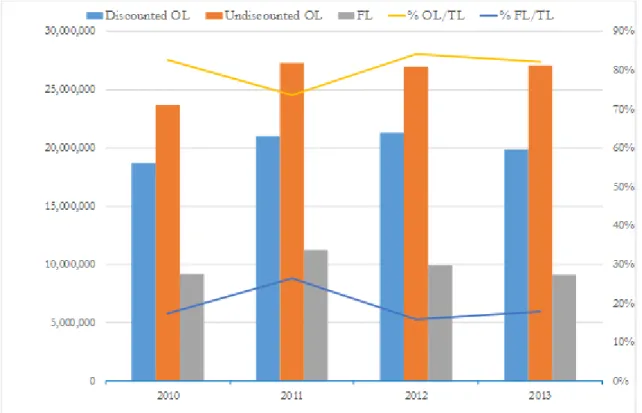
Before calculating the new ratios, the value of the assets, liabilities and equity have been adjusted by the capitalization of operating leases. Table 1 shows the amount of the undiscounted operating lease liabilities (in column 1) and once discounted by the constructive method (in column 2) for each of the analysed years. The difference between both values depends on the hypothesis assumed on the interest rate, among other aspects. Comparing the data in columns 1 and 2, it can be verified that it is not a negligible difference, since the undiscounted figures are around 30% higher than those resulting from applying the constructive method (reaching 36% in 2013).
Column 4 of Table 1 includes the finance lease debt recognized on the balance sheet (also obtained manually from the notes), in which one can observe that the operating lease liabilities considerably exceed the finance lease liabilities, since the former are more than double the finance leases. Regarding the proportion of finance and operating leases, column 3 shows the percentages per year of the operating lease debt with respect to total lease debt ranging between 65% and 69%, figures that are similar to the 67% provided for 2005 by Barral et al. (2014). These data could suggest that this form of financing is preferred precisely because of the possibility it offers to escape from the control exercised by having to appear on the balance sheet. However, it is still significantly below the figure provided in the EFRAG study, which indicates that the volume of operating leases is 8.7 times greater than that of finance leases.
Undiscounted OL Discounted OL OL/TL FL FL/TL TL OL expense
2010 23,688,074 18,713,864 67% 9,165,214 33% 27,879,078 4,942,991
2011 27,276,663 20,979,412 65% 11,225,370 35% 32,204,782 5,889,192
2012 26,952,705 21,321,158 68% 9,897,575 32% 31,218,733 6,267,043
2013 27,042,823 19,860,848 69% 9,110,179 31% 28,971,027 6,149,995
Total 104,960,265 80,875,283 67% 39,398,338 33% 120,273,620 23,249,221
Note: OL are the payment commitments for operating leases; FL is the finance lease liabilities; TL is the total lease liabilities. The figures are in thousands of euros.
Table 1. Aggregate amount of operating lease liabilities, finance lease liabilities and total lease liabilities in absolute and relative terms per year
These values are illustrated graphically in Figure 1 in which the consistency in the values in the four years examined is also displayed. We should point out that in this figure the average values of the firms analysed are represented, so the percentages indicated in the solid lines do not coincide with the percentages shown in Table 1, in which they have been calculated in an aggregate manner.
Table 1 also provides other information of interest: the operating lease expense, that is, the change in EBITDA, which, as indicated, improves with the regulatory change. In fact, the last column shows an aggregate annual increase in three of the four years of more than five billion euros in this magnitude, which is 1% (non-tabulated data) of the value of the aggregate assets.
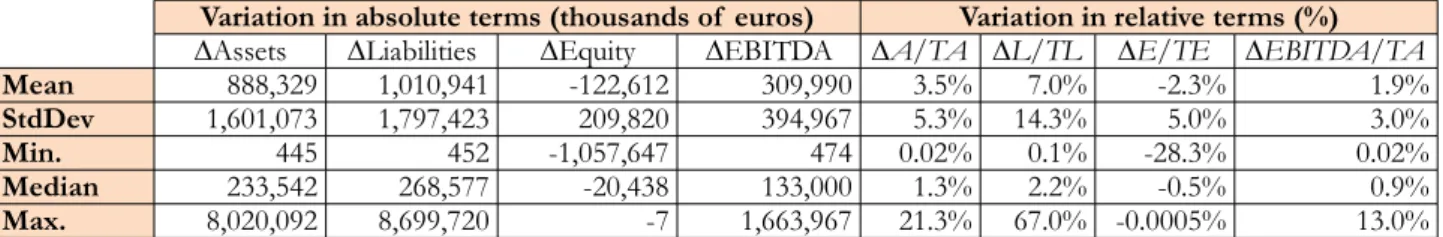
Table 2 shows the descriptive statistics corresponding to the changes in assets, liabilities and equity resulting from the capitalization of operating leases, as well as the variation in EBITDA compared to total assets. It is observed that the increase in liabilities is 7% on average with a median of 2.2%, although it has a large standard deviation, and in fact the maximum reaches 67%. The PwC report documents a 21% increase in the average debt for the European firms considered (PwC, 2016). The increase in assets is lower, 3.5% on average and a median of 1.3%, with 21.3% being the maximum. In terms of equity, the average decrease is 2.3%, while in the median it is only 0.5%, although there are extreme cases, and the largest reduction is 28.3%. The ratio increase in EBITDA divided by total assets shows an average increase of 1.9% (0.9% median) and reaches a maximum value of 13%. This is again a consequence of the great dispersion in the data, that is, of the different foreseeable impacts of the accounting change at the firm level.
Variation in absolute terms (thousands of euros) Variation in relative terms (%)
∆Assets ∆Liabilities ∆Equity ∆EBITDA ∆A/TA ∆L/TL ∆E/TE ∆EBITDA/TA
Mean 888,329 1,010,941 -122,612 309,990 3.5% 7.0% -2.3% 1.9%
StdDev 1,601,073 1,797,423 209,820 394,967 5.3% 14.3% 5.0% 3.0%
Min. 445 452 -1,057,647 474 0.02% 0.1% -28.3% 0.02%
Median 233,542 268,577 -20,438 133,000 1.3% 2.2% -0.5% 0.9%
Max. 8,020,092 8,699,720 -7 1,663,967 21.3% 67.0% -0.0005% 13.0%
Note: ΔA/TA is the change in assets by capitalization of the operating leases with respect to total assets; ΔL/TL is the change in liabilities by capitalization of operating leases with respect to total liabilities; ΔE/TE is the change in equity by capitalization of operating leases with respect to total equity; ΔEBITDA/TA is the change in EBITDA by capitalization of operating leases with respect to total assets.
Table 2. Descriptions of the variation by capitalization of operating leases by company
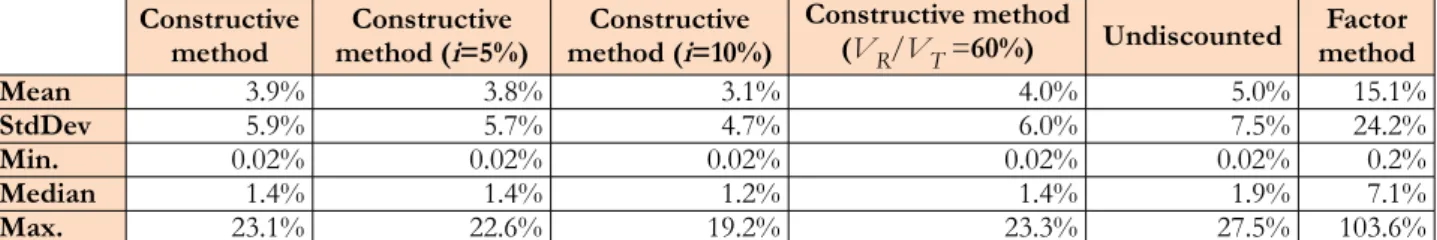
As has been noted before, the methodology used to calculate the amount of off-balance-sheet debts requires the assumption of some hypotheses referring to the interest rate for discounting lease payments and the remaining useful life of the leased asset. In Table 3 we present the descriptive statistics of the liabilities for operating leases with respect to total assets using various scenarios. In the first column they are presented using the discount rate used by each firm for the provisions; in the second column a fixed interest rate of 5% has been used, and in the third we use 10%. In the fourth column the initial interest rate has been maintained, however, the hypothesis about the remaining useful life of the asset has been modified in such a way that the Residual Life/Total Life ratio is 60%, instead of 50%, which is used in the columns described above. Finally, in column 5: “Undiscounted” appears the sum of the future payments for operating leases indicated in the notes, while in the last column a simple method has been applied, frequently used in the business world, the factor method. This heuristic procedure consists of multiplying the annual operating lease expense by a multiplier, with eight being the one usually employed in previous works (Imhoff et al., 1993; Ely, 1995; Beattie et al., 2000; Bennett & Bradbury, 2003). Beattie et al. (2000) echo previous works in which a range between 6.9 and 10.2 is set for leases between 10 and 20 years, so we consider that eight is an acceptable multiplier.
Constructive
method method (i=5%)Constructive method (i=10%)Constructive
Constructive method
(VR/VT =60%) Undiscounted methodFactor
Mean 3.9% 3.8% 3.1% 4.0% 5.0% 15.1%
StdDev 5.9% 5.7% 4.7% 6.0% 7.5% 24.2%
Min. 0.02% 0.02% 0.02% 0.02% 0.02% 0.2%
Median 1.4% 1.4% 1.2% 1.4% 1.9% 7.1%
Max. 23.1% 22.6% 19.2% 23.3% 27.5% 103.6%
Note: Constructive method: it means applying a specific discount rate for each company, as explained in section 5.2; Constructive method (i=5%): it means using a fixed interest rate (5%); Constructive method (i=10%): it means using a fixed interest rate (10%); Construction method (VR/VT= 60%): it implies modifying the hypothesis about the remaining useful life of the asset, in such a way that the Residual Life/Total Life ratio is 60%; Undiscounted: it is the sum of the future payments for operating lease disclosed; Factor method: this means multiplying the annual operating lease expense by a factor of 8.
Table 3. Percentage of estimated operating lease liabilities with different assumptions and methods with respect to total assets
Once the variations derived from the inclusion of the new elements have been computed, in Table 4 we present a series of ratios before and after the capitalization, some of which are frequently taken into account in the covenants included in loan contracts. The first five ratios evaluate the impact on the presentation of the items on the balance sheet (solvency, leverage, debt quality, liquidity, and intensity of investment). In the remaining three, the effect on profitability is considered both from the economic perspective: non-current asset turnover and ROA, as well as financial: ROE (return on equity). Finally, we calculate the market-to-book ratio, which serves as an indicator of the market’s valuation of the firm and captures the firm’s growth opportunities. The precise calculation method of these ratios is indicated at the bottom of the table.
After obtaining the ratios, we present the medians of the values before and after the capitalization, since this statistic is less affected by the extreme values than the average, and we calculate their relative variation. Finally, in order to determine if the differences of these ratios are statistically significant, we apply the Wilcoxon nonparametric test (having previously verified that the variables do not follow a normal distribution).
Ratio Before capitalization After capitalization Relative difference Wilcoxon test
Solvency 1.405 1.395 -0.65% 7.770***
Leverage 2.472 2.529 2.31% -7.770***
Debt quality 0.445 0.422 -5.37% 6.509***
Liquidity 1.087 1.075 -1.13% 7.770***
Intensity of investment 0.689 0.696 1.02% -7.770***
Non-current asset turnover 0.988 0.923 -6.56% 7.770***
ROA 0.047 0.046 -2.15% 6.777***
ROE 0.106 0.107 1.33% -5.823***
Market-to-book 1.446 1.456 0.71% -7.673***
Note: Solvency is measured as total assets/total liabilities; Leverage as total liabilities/total equity; Debt quality as short-term liabilities/total liabilities; Liquidity as current assets/current liabilities; Intensity of investment as non-current assets/total assets; Non-current asset turnover as net sales/non-current assets; ROA as EBIT/total assets; ROE as net income/total equity; Market-to-book as market capitalization/total equity. The values of the ratios are the median of the sample companies.
Table 4. Impact of the capitalization of operating leases on financial ratios
have been included in the debt contracts without having “frozen” the accounting practices to be taken into account for their calculation; in this case it would be convenient to start conversations as soon as possible to avoid last-minute surprises.
Given that the literature suggests that not all industries will be equally affected by the accounting change (EFRAG, 2016; IASB, 2016b; PwC, 2016), we consider it interesting to make the comparison of the impact by industries. However, as the sample size is small, what we present below is rather an analysis by firm. Based on the classification of the Madrid Stock Exchange: Energy; Construction and manufacturing; Retail goods; Retail services; and Technology, we have calculated the impact as the average variation of the ratios of the firms in each industry, and in Table 5 we present the results. It is not surprising that it is the firms in the retail goods and retail services industries that are most affected by the accounting change, given that, as the previous literature reveals, in these industries this type of contract is widely used. Overall, we must highlight the impact on the leverage and economic profitability ratios (ROA). In the firms of these industries, leverage increases by 25%, given the increase in the volume of recognized debts. In addition, non-current asset turnover and ROA are reduced by approximately 11% and 7%, respectively, as a consequence of the increase in assets that capitalization implies. However, the impact of capitalization on equity differs between both groups of firms, which affects changes in the solvency ratio, ROE and market-to-book.
Ratio Energy Construction andmanufacturing Retail goods Retail services Technology
Solvency -1.1% -0.5% -10.2% -2.7% -1.4%
Leverage 2.9% 3.1% 25.9% 25.0% 6.0%
Debt quality -0.8% -0.7% -7.4% -6.0% -1.7%
Liquidity -1.4% -0.8% -9.7% -4.4% -2.6%
Intensity of investment 0.4% 3.4% 6.7% 3.4% 0.7%
Non-current asset turnover -1.6% -4.0% -11.8% -10.5% -3.5%
ROA -1.1% -1.1% -6.8% -7.6% -2.9%
ROE 0.7% 1.4% 1.3% 11.2% 1.5%
Market-to-book 0.7% 1.4% 1.3% 11.3% 1.5%
Note: Solvency is measured as total assets/total liabilities; Leverage as total liabilities/total equity; Debt quality as short-term liabilities/total liabilities; Liquidity as current assets/current liabilities; Intensity of investment as non-current assets/total assets; Non-current asset turnover as net sales/non-current assets; ROA as EBIT/total assets; ROE as net income/total equity; Market-to-book as market capitalization/total equity. The values of the changes in ratios as a result of capitalization are the median of the sample companies.
Table 5. Average impact of the capitalization of operating leases on financial ratios by industry
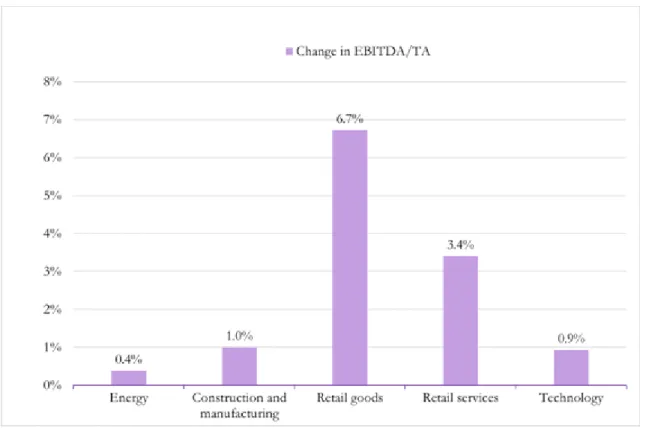
Figure 2. Effect of the capitalization of operating leases by industry
5.4. Explanatory factors for the change in EBITDA
Given the importance that investors and analysts attribute to EBITDA, we have investigated the factors that explain the impact of the standard on this accounting measure. The change in EBITDA coincides with operating lease expense, so that the more operating leases the firm has and the higher their amount, the better the business image after the accounting change.
Based on the explanations that the literature has provided on this type of financing, among which is the nature of the assets directly related to the industry in which the firm operates (Smith & Wakeman, 1985; Krishnan & Moyer, 1994), we establish an industry hypothesis. Indeed, the greater the specificity of the assets, the lower the preference for leasing, since there are more agency costs (related to the negotiation and control of contracts), which makes the option of full ownership more attractive. On the other hand, when dealing with non-specific assets (typical in short contracts), as is the case in retail industries, leases are more used, since it is easy to dispose of the assets, which remain the property of the lessors. In short, we propose the following hypothesis in an alternative form:
H1: Firms in the retail industries will experience an improvement in EBITDA greater than those of the other industries.
Next, we refer to the financial situation of the firms. According to the previous research, those who are in a difficult financial situation have more debts and make more frequent use of this type of contract (Smith & Warner, 1979; Krishnan & Moyer, 1994; Eisfeldt & Rampini, 2009; Cornaggia, Franzen & Simin, 2013). We propose the following hypothesis, also in an alternative way:
H2: Firms with a higher leverage ratio will experience an improvement in EBITDA greater than those with a lower ratio.
H3: Firms with more growth opportunities will experience a greater EBITDA improvement than those with fewer opportunities.
The model we use is:
ΔEBITDA/TA = α0 + α1Industry + α2LEV + α3M/B + α4Size + ε (7)
Where: ΔEBITDA/TA is the variation in EBITDA divided by total assets; Industry is an indicator variable that takes the value 1 if the observation belongs to the industry of retail goods or retail services, and 0 otherwise; LEV is the leverage calculated as total liabilities/total equity; M/B is the market-to-book ratio; Size is measured as the logarithm of net sales. The independent variables are measured without taking into account the impact of the capitalization of operating leases.
For the three explanatory variables (Industry, LEV and M/B) we expect a positive relationship with the impact on EBITDA. We have introduced the size of the firm into the model (expression 7) since it is a control that is usually incorporated in this type of analysis, but we do not have any concrete expectation regarding its sign.
We use Petersen (2009)’s procedure to estimate clustered robust standard errors that arerobust to heteroscedasticity, serial and cross-sectional correlation with a two dimensional cluster at the firm and year level for the regression model. Additionally, the Pearson correlation coefficients for the variables used in the multivariate analysis were calculated; the results, shown in Table 6, indicate that the correlations between the independent variables are not high. We have also calculated the variance inflation factor of each variable (VIF) and the results do not suggest multicollinearity problems.
Variables ΔEBITDA/TA Industry LEV M/B Size
ΔEBITDA/TA 1
Industry 0.568*** 1
LEV 0.127 0.007 1
M/B 0.570*** 0.407*** 0.512*** 1
Size 0.094 -0.249** 0.008 -0.143 1
Note: ∆EBITDA/TAis the variation in EBITDA divided by total assets; Industry is an indicator variable that is 1 if the observation belongs to the retail goods or retail services industry. and 0 otherwise; LEV is leverage calculated as total liabilities/total equity; M/B is the Market-to-book ratio; Size is measured as the logarithm of net sales.
*** = 1% significance; ** = 5%; * = 10%.
Table 6. Pearson correlation coefficients
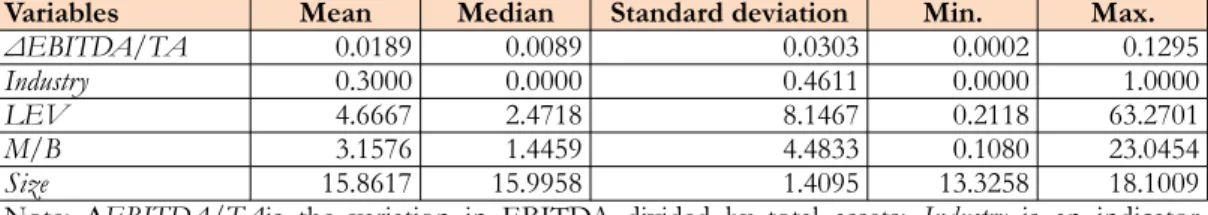
Table 7 describes the industry classification of the sample following the criteria of the Madrid Stock Exchange. It can be observed that the Construction and manufacturing industry dominates the sample, and the rest are distributed equally, although for the purposes of our analysis, what is relevant is that the retail industries represent 30%. Table 8 summarizes the descriptive statistics of the variables used in the model, with most of the distributions being skewed to the right.
Industry Firm-year obs. Percentage
Energy 12 15%
Construction and manufacturing 32 40%
Retail goods 12 15%
Retail services 12 15%
Technology 12 15%
Total 80 100%
Variables Mean Median Standard deviation Min. Max.
ΔEBITDA/TA 0.0189 0.0089 0.0303 0.0002 0.1295
Industry 0.3000 0.0000 0.4611 0.0000 1.0000
LEV 4.6667 2.4718 8.1467 0.2118 63.2701
M/B 3.1576 1.4459 4.4833 0.1080 23.0454
Size 15.8617 15.9958 1.4095 13.3258 18.1009
Note: ∆EBITDA/TAis the variation in EBITDA divided by total assets; Industry is an indicator variable that is 1 if the observation belongs to the retail goods or retail services industry, and 0 otherwise; LEV is leverage calculated as total liabilities/total equity; M/B is the market-to-book ratio;
Size is measured as the logarithm of net sales.
Table 8. Descriptive statistics of the variables
Table 9 shows the results of the multivariate regression model. Given that the variables Industry and M/B are significant, the two null hypotheses are rejected, which confirms the influence of the industry and the M/B ratio with the signs expected in the improvement in EBITDA, with significance levels of 10% and 1%, respectively. The firms that belong to the retailindustries and that have a higher valuation in the market, which is related to higher growth expectations, show a greater increasein this indicator. Regarding the control variable, Size, its significance and positive sign allow us to conclude that the larger firms will also show a greater increase in EBITDA; however, we cannot reject the null hypothesis 2, so we cannot affirm that leverage has an influence on the expected change of this metric. The adjusted coefficient of determination of 51.3% suggests that the model has good explanatory capacity.
Expected
sign Coefficient(t statistic)
Constant ? -0.0949*
(-1.828)
Industry (+) 0.0297*
(1.804)
LEV (+) -0.0005
(-0.988)
M/B (+) 0.0032***
(3.209)
Size (+/-) 0.0061*
(1.908)
Adjusted R2 0.513
Note: *** = 1% significance; ** = 5%; * = 10%.
Dependent variable: ∆EBITDA/TAis the variation in EBITDA divided by total assets.
Independent variables: Industry is an indicator variable that is 1 if the observation belongs to the retail goods or retail services industry, and 0 otherwise; LEV is leverage calculated as total liabilities/total equity;
M/B is the market-to-book ratio; Size is measured as the logarithm of net sales.
Table 9. Multivariate regression analysis
As a robustness analysis, we have replicated the regression using other proxies for the independent variables. In particular, the LEV variable has been calculated as total liabilities/total assets; the Industry variable has been separated in each of the industries listed in Table 7; and the Size variable has been measured as the logarithm of total assets and with that of the market capitalization. The results obtained are basically consistent with those reported.
6. Conclusions
16, the issue that constitutes the main objective of this work. The constructive capitalization method has been used to estimate the assets and liabilities that according to the standard in force are not recognized on the balance sheet. The results reveal that the total amount of unaccounted liabilities is around 20 billion euros, which will mean an increase of 4.81% with respect to the liabilities recognized on the balance sheet. Notwithstanding the foregoing, we must clarify that the results obtained in this and other works are influenced by the methodology for calculating the off-balance-sheet items. Through the sensitivity analysis performed, we verify that using one interest rate or another does not significantly affect the descriptive statistics, nor does it modify the assumption about the remaining useful lease life, although using the factor method or not discounting the liability does lead to significantly different figures. In particular, the factor method means that the average increase in liabilities is almost 4 times higher than with the constructive method. These results can be understood as a “relief ” for certain non-sophisticated users who, when applying simple procedures, may come to believe that the real debts are much greater than those that will eventually emerge.
Next, we verify whether the change in a series of financial metrics and ratios, some of which are frequently included as restrictions in debt contracts (covenants), is statistically significant. The results suggest that IFRS 16 significantly affects the financial metrics, and in particular the non-current asset turnover and the debt quality, followed by leverage and ROA. We must stress that not all ratios are penalised, since the financial profitability ratio (ROE) and the market-to-book ratio improve. On the other hand, we show that there are notable industry differences. It is not surprising that the firms in the retail goods and retail services industries are the most affected by the accounting change, given that these types of contracts are widely used in these industries.
Despite the fact that, like other works, our results show that the ratios are significantly affected by capitalization, this does not necessarily mean that there will be noncompliance in the covenants when applying IFRS 16. There are various reasons that may account for this: i) Current restrictions may take into account off-balance-sheet information and ratios are adjusted with this information (for example, as has been done in this work or through some other alternative procedure), ii) the established restrictions “freeze the accounting practices” that serve as a basis for calculating them, and iii) the three-year implementation period established by the IASB is sufficient to understand the effects of the change and consequently alter the established limits. In spite of everything, if the inclusion on the balance sheet provides unknown information that reveals a greater risk, it is reasonable to assume that renegotiations will take place in the clauses.
As indicated above, certain metrics improve when applying the new standards, and in particular EBITDA, which excludes depreciation and interest from its computation. In the study we found that the larger firms, which have a higher valuation in the capital market and belong to the retail industries, see this metric improved the most.
Acknowledgements
The authors gratefully acknowledge the assistance of Raquel Cancho in gathering data and the valuable comments of two reviewers.
Declaration of Conflicting Interests
The authors declared no potential conflicts of interest with respect to the research, authorship, and/or publication of this article.
Funding
The authors received no financial support for the research, authorship, and/or publication of this article.
References
Abdel-Khalik, A.R. (1981). The Economic Effects on Lessees of FASB Statement No. 13, Accounting for Leases. Stamford, CT.: FASB
Barral, A., Cordobés, M., & Ramírez, J. (2014). Los arrendamientos operativos: impacto de su reconocimiento en los estados financieros y en la política de financiación de las compañías españolas y del Reino Unido. Revista de Contabilidad, 17(2), 212-223. https://doi.org/10.1016/j.rcsar.2014.08.001
Beattie, V., Edwards, K., & Goodacre, A. (1998). The impact of constructive operating lease capitalisation on key accounting ratios. Accounting and Business Research, 28(4), 233-254.
https://doi.org/10.1080/00014788.1998.9728913
Beattie, V., Goodacre, A., & Thomson, S. (2000). Recognition versus Disclosure: An Investigation of the Impact on Equity Risk using UK Operating Lease Disclosures. Journal of Business Finance & Accounting, 27(9-10), 1185-1224. https://doi.org/10.1111/1468-5957.00352
Beatty, A., Liao, S., & Weber, J. (2010). Financial reporting quality, private information, monitoring, and the lease-versus-buy decision. The Accounting Review, 85(4), 1215-1238. https://doi.org/10.2308/accr.2010.85.4.1215
Beneish, M., & Press, E. (1993). Cost of Technical Violation of Accounting-Based Debt Covenants. The Accounting Review, 68, 233-257.
Bennett, B.K., & Bradbury, M.E. (2003). Capitalizing non cancelable operating leases.‐ Journal of International Financial Management & Accounting, 14(2), 101-114. https://doi.org/10.1111/1467-646X.00091
Bryan, S.H, Lilien, S., & Martin, D.R. (2010). The Financial statement effects of capitalizing operating leases. Assessing the impact of the right-to-use model. The CPA Journal, August, 36-41.
Cooper, S. (2017). Implementation Update: IFRS 16 Leases. January 2017.
Cornaggia, K.J., Franzen, L.A., & Simin, T.T. (2013). Bringing assets onto the balance sheet. Journal of Corporate Finance, 22(September), 345-360. https://doi.org/10.1016/j.jcorpfin.2013.06.007
Dechow, P.M., Ge, W., Larson, C.R., & Sloan, R.G. (2011). Predicting material accounting misstatements. Contemporary Accounting Research, 28(1), 17-82. https://doi.org/10.1111/j.1911-3846.2010.01041.x
Deloitte (2011). How prepared is your organization to cope with these new standards? A Deloitte survey on the FASB’s proposed changes to lease accounting standards. Retrieved from: http://www.iasplus.com/en/binary/usa/1102usleasessurvey.pdf (Last access date: December 3rd, 2015).
Demerjian, P.R. (2011). Accounting standards and debt covenants: Has the “balance sheet approach” led to a decline in the use of balance sheet covenants?. Journal of Accounting & Economics, 52, 278-202. https://doi.org/10.1016/j.jacceco.2011.08.004
Durocher, S. (2008). Canadian evidence on the constructive capitalization of operating leases. Accounting Perspectives,7(3), 227-256. https://doi.org/10.1506/ap.7.3.2
EFRAG (2016). IFRS 16 Leases. Quantitative assessment of accounting impacts. July. Paper 08-02.
Eisfeldt, A., & Rampini, A. (2009). Leasing, ability to repossess, and debt capacity. Review of Financial Studies, 22(4), 1621-1657. https://doi.org/10.1093/rfs/hhn026
Ely, K. (1995). Operating lease accounting and the market's assessment of equity risk. Journal of Accounting Research, 33, 397-415. https://doi.org/10.2307/2491495
FASB (Financial Accounting Standards Board) (1976). Accounting for Leases. Statement of Financial Accounting Standards No. 13. Stamford, CT: FASB.
Fitó, M.Á., Moya, S., & Orgaz, N. (2013). Considering the effects of operating lease capitalization on key financial ratios. Revista Española de Financiación y Contabilidad, 42(159), 341-369.
https://doi.org/10.1080/02102412.2013.10779750
Franz, D.R., HassabElnaby, H.R., & Lobo, G.F. (2014). Impact of proximity to debt covenant violation on earnings management. Review of Accounting Studies, 19, 473-505. https://doi.org/10.1007/s11142-013-9252-9 Fülbier, R.U., Silva, J.L., & Pferdehirt, M.H. (2008). Impact of lease capitalization on financial ratios of listed
German companies. Schmalenbach Business Review, 60(2), 122-144. https://doi.org/10.1007/BF03396762
Gill de Albornoz, B., Rusanescu, S., & Cabedo, P. (2017). Las nuevas normas contables de arrendamientos: Causas y potenciales efectos económicos. Revista de Contabilidad y Tributación, 406, 207-246.
Giner, B., & Pardo, F. (2017). Operating lease decision and the impact of capitalization in a bank-oriented country. Applied Economics, 49(19), 1886-1900.
Goodacre, A. (2003). Operating lease finance in the UK retail sector. International Review of Retail, Distribution and Consumer Research, 13(1), 99-125. https://doi.org/10.1080/0959396032000065373
Graham, J.R., Lemmon, M.L., & Schallheim, J.S. (1998). Debt, leases, taxes and the endogeneity of corporate tax status. Journal of Finance, 53, 131-162. https://doi.org/10.1111/0022-1082.55404
Imhoff, E.A., Lipe, R.C., & Wright, D.W. (1991). Operating leases: impact of constructive capitalization. Accounting Horizons, 5(1), 51-63.
Imhoff, E.A., Lipe, R.C., & Wright, D.W. (1993). The effects of recognition versus disclosure on shareholder risk and executive compensation. Journal of Accounting, Auditing and Finance, 8(4), 335-368.
https://doi.org/10.1177/0148558X9300800402
Imhoff, E.A., Lipe, R.C., & Wright, D.W. (1997). Operating leases: Income effects of constructive capitalization. Accounting Horizons, 11(2), 12-32.
Imhoff, E.A., & Thomas, J. (1988). Economic consequences of accounting standards: The lease disclosure rule change. Journal of Accounting and Economics, 10, 277-310. https://doi.org/10.1016/0165-4101(88)90006-7
IASC (International Accounting Standards Committe) (1997). Norma Internacional de Contabilidad. NIC 17 Arrendamientos.
IASB (International Accounting Standards Board) (2009). Preliminary Views. Leases. DP/2009/01. IFRS Foundation. March. London.
IASB (International Accounting Standards Board) (2010). Exposure Draft. Leases. ED/2010/9. IFRS Foundation. August. London.
IASB (International Accounting Standards Board) (2013). Exposure Draft. Leases. ED/2013/6. IFRS Foundation. May. London.
IASB (International Accounting Standards Board) (2016b). Effects Analysis. IFRS 16 Leases. IFRS Foundation. January. London.
Krishnan, V.S., & Moyer, R.C. (1994). Bankruptcy costs and the financial leasing decision. Financial Management, 23, 31-42. https://doi.org/10.2307/3665737
Molina, H., & Mora, A. (2015). Cambios conceptuales en la contabilidad de los arrendamientos: Retos normativos y académicos. Revista de Contabilidad, 18(1), 99-113. https://doi.org/10.1016/j.rcsar.2015.01.001 Mulford, C., & Gram, M. (2007). The effects of lease capitalization on various financial measures: An analysis of
the retail industry. Journal of Applied Research in Accounting & Finance, 2(2), 3-13.
Nelson, A.J. (1963). Capitalising leases: The effect on financial ratios. Journal of Accountancy, 41, 49-58.
Nikolaev, V.N. (2010). Debt Covenants and Accounting Conservatism. Journal of Accounting Research, 48(1), 137-175. https://doi.org/10.1111/j.1475-679X.2009.00359.x
Ortiz, E., & Marín, S. (2014). Global Reporting Initiative (GRI) as recognized guidelines for sustainability reporting by Spanish companies on the IBEX 35: Homogeneity in their framework and added value in the relationship with financial entities. Intangible Capital, 10(5), 855-872. https://doi.org/10.3926/ic.492
Paik, D.G.H., van der Laan Smith, J.A., Lee, B.B., & Yoon, S.W. (2015). The relation between accounting information in debt covenants and operating leases. Accounting Horizons, 29(4), 969-996. https://doi.org/10.2308/acch-51214
Petersen, M.A. (2009). Estimating standard errors in finance panel data sets: comparing approaches. Review of Financial Studies, 22(1), 435-480. https://doi.org/10.1093/rfs/hhn053
PwC (2016). A study on the impact of lease capitalization: IFRS 16: The new leases standard. February.
Reverte, C. (2009). Determinants of Corporate Social Responsibility Disclosure Ratings by Spanish Listed Firms. Journal of Business Ethics, 88, 351-366. https://doi.org/10.1007/s10551-008-9968-9
Reverte, C. (2016). Corporate social responsibility disclosure and market valuation: Evidence from Spanish listed firms. Review of Managerial Science, 10(2), 411-435. https://doi.org/10.1007/s11846-014-0151-7
Scott, D. (2017). Implementation Update: IFRS 16 Leases. January 2017.
Smith, C.W., & Warner, J.B. (1979). Bankruptcy, Secured Debt, and Optimal Capital Structure: Comment. Journal of Finance, 34, 247-251. https://doi.org/10.1111/j.1540-6261.1979.tb02085.x
Versión en español
Título:
La capitalización de los arrendamientos operativos: Análisis del impacto en las empresas del
IBEX 35
Resumen
Objeto: Este trabajo investiga las implicaciones del cambio en la normativa contable referido a los arrendamientos operativos sobre las empresas y los usuarios de la información financiera.
Diseño/metodología/enfoque: Se utiliza el método de capitalización constructivo para estimar los pasivos y activos por arrendamiento, y se analiza ex ante el impacto normativo sobre las empresas no financieras del IBEX 35. Mediante tests no paramétricos se examina el efecto sobre ciertas ratios, y mediante un modelo de regresión multivariante se investigan las características empresariales que explican la variación del EBITDA.
Aportaciones y resultados: Las ratios resultan significativamente afectadas por la capitalización de los arrendamientos operativos. El análisis explicativo evidencia que las empresas de mayor tamaño, con mayor valoración en el mercado y que pertenecen a los sectores de consumo presentan un mayor incremento en el EBITDA.
Limitaciones: El tamaño muestral es reducido, lo que impone cierta cautela en la generalización de los resultados. Se han introducido ciertas hipótesis para aplicar el método constructivo, si bien mediante los tests de sensibilidad se ha verificado que los resultados son consistentes.
Implicaciones prácticas: En ciertos casos, convendría iniciar renegociaciones en los contratos, en particular en los de deuda, para evitar incumplimientos. El método constructivo conlleva deudas y activos sensiblemente menores que otros métodos más simples (como el del factor), por lo que estos resultados pueden ser un alivio para ciertos usuarios no sofisticados.
Implicaciones sociales: Los inversores, accionistas y prestamistas, y otros usuarios tendrán información más transparente, lo que debería repercutir en una mejor toma de decisiones.
Originalidad / Valor Añadido: Se complementa el estudio del impacto sobre las magnitudes del balance y las ratios financieras con un análisis descriptivo, que tiene en cuenta el sector, y con la modelización de los factores explicativos del cambio en el EBITDA.
Palabras Clave: Arrendamientos operativos, NIIF 16, Capitalización constructiva, Ratios financieras, Impacto normativo
Códigos JEL: G32, M41, M48
1. Introducción
impacto económico considerable. Dado que según el Reglamento (CE) 1606/2002 del Parlamento Europeo y del Consejo relativo a la aplicación de las normas internacionales de contabilidad, una vez aceptadas dichas normas por la Comisión Europea (CE) son de obligado cumplimiento para las cuentas consolidadas de las empresas cotizadas en la Unión Europea (UE), en este trabajo vamos a centrarnos en la NIIF 16: “Arrendamientos”. Esta norma ha sido adoptada en el último trimestre de 2017 y entrará en vigor en 2019. Por otra parte, en España es práctica habitual aproximar la normativa local —Plan General de Contabilidad (PGC) y resoluciones del Instituto de Contabilidad y Auditoría de Cuentas (ICAC) — a lo dispuesto en las NIIF, lo que sugiere que la nueva norma podría tener un efecto cascada y provocar cambios que afecten a otras empresas y estados financieros. En este sentido, Molina y Mora (2015, p. 111) señalan: “Existe además la creencia de que un cambio de modelo tan radical puede acabar trasladándose a las regulaciones nacionales y a las entidades de menor tamaño que no cotizan en los mercados de valores”.
En este trabajo examinamos el impacto de la norma sobre los estados financieros de una muestra de empresas españolas, con el objetivo de conocer cómo pueden alterarse ciertas magnitudes clave para enjuiciar su situación financiera. Asimismo, analizamos las características de las empresas que pueden resultar más afectadas por el cambio normativo.
La gran oposición a esta norma se puede evidenciar a través de su compleja gestación. El proceso de elaboración de normas (due process) del IASB conlleva una serie de etapas, que incluyen necesariamente la publicación de al menos un borrador de norma. En este caso, además, se emitió antes un documento de trabajo (Discussion Paper – DP) (IASB, 2009) y fueron dos los borradores emitidos (Exposure Draft – ED) (IASB, 2010 y 2013). Por otra parte, dichos documentos deben ser sometidos a la opinión pública para que los interesados puedan hacer sugerencias y comentarios; considerando los diversos documentos referidos a este proyecto se enviaron más de 1.700 cartas, lo que excede a las normalmente enviadas en otros casos. También requiere el proceso normativo la realización de un análisis de los efectos esperados de la norma. En 2016 se publicó el análisis sobre este proyecto, entre cuyos resultados destacan los casi 3 billones de dólares de compromisos de pago por arrendamiento que, siguiendo lo establecido en las normas en vigor, no se incluyen en el balance, pero son divulgados en las memorias de las empresas que cotizan y emplean las NIIF o los USGAAP (IASB, 2016b). En qué medida su reconocimiento en el balance puede tener consecuencias económicas y afectar a los contratos de deuda y remuneración, entre otros, así como mejorar las decisiones de los inversores, es la cuestión que subyace a este trabajo.
“mejoran” su situación económico-financiera, sino que la información proporciona una imagen más transparente de la misma, lo que debe redundar en una mejor toma de decisiones de inversión y financiación. Asimismo, se advierte de los inconvenientes de emplear métodos heurísticos, dado que si bien son más simples, pueden conllevar un mayor error.
Al objeto de tener una mejor idea del cambio normativo, conviene en primer lugar valorar las dificultades del proceso de aprobación de la NIIF 16, para después hacer una presentación de las principales novedades en el tratamiento contable de los arrendamientos. Seguidamente, se exponen las conclusiones de los estudios que han analizado el impacto del cambio. Continúa el trabajo con una parte empírica en la que se aborda el análisis del cambio normativo en las empresas del IBEX 35 y, por último, en la sección final se exponen las conclusiones.
2. El desarrollo del proyecto de arrendamientos
No sólo el PGC sino la noma contable internacional y la norteamericana en vigor —NIC 17 (IASC, 1997) y Statement of Financial Accounting Standard (SFAS) 13 (FASB, 1976), redenominada Accounting for leases, ASC Topic 840, respectivamente— distinguen entre arrendamiento financiero y operativo, y, basándose en la transferencia de los riesgos y beneficios inherentes a la propiedad del activo, establecen dos procedimientos diferenciados. Si estos se transfieren, el arrendamiento se califica como financiero, dando lugar al reconocimiento de un activo y un pasivo en el balance. De lo contrario, el arrendamiento se considera operativo y no da lugar a reconocimiento en el balance, sino que se refleja como un gasto en la cuenta de pérdidas y ganancias cuando se devenga, y debe proporcionarse información en la memoria sobre los compromisos de pago.
En la medida que los arrendamientos operativos no penalizan las ratios de endeudamiento y conllevan normalmente una mejor rentabilidad, las empresas prefieren clasificar los arrendamientos como operativos. Esto ha llevado a que por ejemplo las agencias de rating, como Standard & Poor’s y Moody’s hayan desarrollado modelos para capitalizar los arrendamientos fuera del balance. La cuestión es si aciertan en los ajustes, y si otros usuarios son conscientes de las deudas no reconocidas. En este sentido, Mr. Cooper, miembro del IASB en aquellas fechas, alertaba sobre la magnitud de las cifras finalmente reconocidas, esto es, sobre la deuda que finalmente aflore, ya que no es obvio que se imponga la misma exigencia o el mismo juicio crítico a las cifras divulgadas que a las incluidas en los estados principales, concretamente se refiere al reconocimiento de ampliaciones en el contrato y opciones de cancelación. Como consecuencia es posible que se reconozcan cifras distintas a las que sugieren los arrendamientos divulgados (Cooper, 2017).
Así pues, para evitar los contratos ad hoc y la confusión sobre la magnitud de las deudas existentes, tanto el IASB como el FASB se plantearon desarrollar un proyecto que eliminara la diferenciación. Dicho proyecto iniciado en 2006, se abordó en el marco del proyecto de convergencia entre ambas instituciones, abandonado en 2013, por lo que no es de extrañar que haya dado lugar a dos normas no idénticas, aunque similares, que imponen la capitalización de todos los arrendamientos.
El IASB fiel al DP (IASB, 2009) y al ED/2010/9 (IASB, 2010) entiende que todos los contratos deben capitalizarse y dar lugar al reconocimiento de gasto por intereses (decreciente) y gasto por amortización del activo (constante normalmente). Sin embargo, el FASB en la línea del ED/2013/6 (IASB, 2013) diferencia entre dos categorías de arrendamientos, a los que llama financieros y operativos en función del consumo de los beneficios del activo que el arrendatario espera hacer. Si el arrendatario espera consumir una parte importante de los mismos, el arrendamiento es financiero, de lo contrario, es operativo. Sólo en los primeros se distingue en la cuenta de pérdidas y ganancias la amortización del activo de la carga financiera, siendo la suma de ambos decreciente, mientras que en los arrendamientos operativos el gasto es constante. No obstante, en ambos casos se reconoce el activo por derecho de uso y el pasivo en el balance.