Disparities in Early Transitions to Obesity in
Contemporary Multi-Ethnic U.S. Populations
Christy L. Avery1*, Katelyn M. Holliday1, Sujatro Chakladar2, Joseph C. Engeda1, Shakia T. Hardy1, Jared P. Reis3, Pamela J. Schreiner4, Christina M. Shay5, Martha L. Daviglus6,
Gerardo Heiss1, Dan Yu Lin2, Donglin Zeng2
1Department of Epidemiology, the University of North Carolina at Chapel Hill, Chapel Hill, North Carolina, United States of America,2Department of Biostatistics, the University of North Carolina at Chapel Hill, Chapel Hill, North Carolina, United States of America,3Epidemiology Branch, Population and Prevention Sciences Program, Division of Cardiovascular Sciences, National Heart, Lung and Blood Institute, Bethesda, Maryland, United States of America,4Division of Epidemiology & Community Health, University of Minnesota, Minneapolis, Minnesota, United States of America,5Department of Nutrition, the University of North Carolina at Chapel Hill, Chapel Hill, North Carolina, United States of America,6Department of Medicine Institute for Minority Health Research, University of Illinois at Chicago, Chicago, Illinois, United States of America
Abstract
Background
Few studies have examined weight transitions in contemporary multi-ethnic populations spanning early childhood through adulthood despite the ability of such research to inform obesity prevention, control, and disparities reduction.
Methods and Results
We characterized the ages at which African American, Caucasian, and Mexican American populations transitioned to overweight and obesity using contemporary and nationally rep-resentative cross-sectional National Health and Nutrition Examination Survey data (n = 21,220; aged 2–80 years). Age-, sex-, and race/ethnic-specific one-year net transition prob-abilities between body mass index-classified normal weight, overweight, and obesity were estimated using calibrated and validated Markov-type models that accommodated complex sampling. At age two, the obesity prevalence ranged from 7.3% in Caucasian males to 16.1% in Mexican American males. For all populations, estimated one-year overweight to obesity net transition probabilities peaked at age two and were highest for Mexican Ameri-can males and AfriAmeri-can AmeriAmeri-can females, for whom a net 12.3% (95% CI: 7.6%-17.0%) and 11.9% (95% CI: 8.5%-15.3%) of the overweight populations transitioned to obesity by age three, respectively. However, extrapolation to the 2010 U.S. population demonstrated that Mexican American males were the only population for whom net increases in obesity peaked during early childhood; age-specific net increases in obesity were approximately constant through the second decade of life for African Americans and Mexican American females and peaked at age 20 for Caucasians.
a11111
OPEN ACCESS
Citation:Avery CL, Holliday KM, Chakladar S, Engeda JC, Hardy ST, Reis JP, et al. (2016) Disparities in Early Transitions to Obesity in Contemporary Multi-Ethnic U.S. Populations. PLoS ONE 11(6): e0158025. doi:10.1371/journal. pone.0158025
Editor:Qing Song, Morehouse School of Medicine, UNITED STATES
Received:February 4, 2016
Accepted:May 24, 2016
Published:June 27, 2016
Copyright:This is an open access article, free of all copyright, and may be freely reproduced, distributed, transmitted, modified, built upon, or otherwise used by anyone for any lawful purpose. The work is made available under theCreative Commons CC0public domain dedication.
Data Availability Statement:NHANES data are fully available online without restriction (http://www.cdc. gov/nchs/nhanes.htm). CARDIA data are available through the parent study (http://www.cardia.dopm. uab.edu/).
Funding:This publication was made possible in part by R21HL121580, R00HL098458, and
Conclusions
African American and Mexican American populations shoulder elevated rates of many obe-sity-associated chronic diseases and disparities in early transitions to obesity could further increase these inequalities if left unaddressed.
Introduction
An estimated 69% of American adults are overweight or obese [1], fueling a public health crisis of enormous financial cost [2,3] that has the potential to reverse gains in health and life expec-tancy achieved over the past century [4]. The prevalence of overweight and obesity has
increased in all U.S. race/ethnic groups, with elevated burdens carried by minority populations, including African Americans and Mexican Americans [1]. African Americans and Mexican Americans also shoulder elevated rates of overweight- and obesity-associated chronic diseases including diabetes [5], stroke [6,7], coronary heart disease [8,9], and post-menopausal breast [10], prostate [11], and colorectal cancer [12], among others [13–16], when compared to Cau-casians. Alarmingly, the burden of overweight and obesity in minority communities may main-tain, or even increase, these persistent health disparities over the coming decades.
U.S. minority groups not only bear elevated burdens of overweight and obesity, but also may transition away from normal weight at younger ages when compared to Caucasian populations. For example, nationally representative estimates from 1996–2001 suggested that the incidence of obesity during the transition period between adolescence and adulthood was highest for Afri-can AmeriAfri-can females and Hispanic females [17]. Disparities in the burden of overweight and obesity, especially in young populations, are particularly concerning given research demonstrat-ing difficulties reattaindemonstrat-ing normal body weight once classified as overweight or obese [17] as well as adverse effects from the length of time populations were overweight or obese [18,19]. However, no contemporary study to the best of our knowledge has characterized the ages at which multi-ethnic U.S. populations transition between normal weight, overweight, and obesity in populations spanning early childhood through late adulthood. Such research is needed given strong secular trends in overweight and obesity over the past three decades [20] that may limit the generalizability of earlier studies to present day, historic obesity disparities [1] supporting studies with large numbers of minority populations, and the ability of research spanning early childhood through late adulthood to broadly inform obesity prevention and control efforts. We therefore leveraged cross-sectional data from n = 21,220 participants of African American, Cau-casian, and Mexican American descent from a large contemporary national sample and cali-brated and validated novel Markov-type models to examine race/ethnic-, sex-, and age-specific (2–80 years) net transitions between normal weight, overweight, and obesity.
Materials and Methods
Ethics statement
The Institutional Review Board at the University of North Carolina approved the study protocol. This study was conducted according to the principles expressed in the Declaration of Helsinki.
Study population
We characterized the ages at which African American, Caucasian, and Mexican populations transitioned between normal weight, overweight, and obesity using cross-sectional data from (HHSN268201300025C & HHSN268201300026C),
Northwestern University (HHSN268201300027C), University of Minnesota (HHSN268201300028C), Kaiser Foundation Research Institute
(HHSN268201300029C), and Johns Hopkins University School of Medicine
(HHSN268200900041C). CARDIA is also partially supported by the Intramural Research Program of the National Institute on Aging (NIA) and an intra-agency agreement between NIA and NHLBI (AG0005). This manuscript has been reviewed by CARDIA for scientific content.
the National Health and Nutrition Examination Survey (NHANES) [21]. NHANES is a com-plex, multistage probability sample of the U.S. population (aged 0–80+ years; participants80 years of age were collapsed into age 80 by NHANES investigators) conducted by the National Center for Health Statistics that measured demographic, dietary, and health-related traits [21]. For this study, we used data from three continuous NHANES population cross-sections (i.e. 2007–08, 2009–10, and 2011–12) and evaluated Hispanic Caucasian (n = 10,224), non-Hispanic African American (n = 6,069), and Mexican American (n = 4,927) participants 2–80 years of age. We excluded non-Hispanic Asian participants who were available as of the 2011– 12 population cross-section as well as participants designated as“Other Hispanic”or“Other Race—Including Multi-Racial”due to small sample sizes and, for the latter, uncertainty regard-ing the underlyregard-ing source population. The study was approved by local institutional review boards and all participants gave written informed consent.
Measurement and classification of weight
Weight was classified according to the previously published weight cardiovascular health met-ric [22]. For adults20 years of age, BMI was measured as kg/m2using standard equipment and categorized as normal weight (BMI<25 kg/m2), overweight (BMI 25–29.99 kg/m2), or obese (BMI30 kg/m2). Less than 1% of each race/ethnic and sex-specific population was clas-sified as underweight (BMI<18.5). For participants 2–19 years of age, BMI was characterized as normal weight (<85thpercentile), overweight (85th-95thpercentile), or obese (>95th percen-tile) using sex-specific growth curves developed by the Centers for Disease Control and Preven-tion [23]. Participants who were pregnant, recently pregnant, who had a limb amputation, or were missing variables to calculate BMI were excluded. Children 0–1 years of age also were excluded from the cardiovascular health BMI guidelines and were therefore not considered herein.
Statistical analysis
Estimation of net transition probabilities. We characterized the ages at which African
American, Caucasian, and Mexican American populations transitioned between normal weight, overweight, and obesity using calibrated and validated Markov-type models that esti-mated net transition probabilities from cross-sectional data [24]. For example, in a longitudinal study of 100 normal weight participants aged 18 years, if 10 participants transitioned from mal weight to overweight by age 19 and three participants transitioned from overweight to nor-mal weight by age 19, the nornor-mal weight to overweight net transition would be seven
participants; dividing by the number of normal weight participants at age 18 (n = 100) would yield the net transition probability, here 7%. The overweight to normal weight net transition is 0 because fewer participants moved from overweight to normal weight than from normal weight to overweight. Under the assumption that the age-specific net transitions probabilities remained approximately stable across time (see below andS1 Appendix), we leveraged cross-sectional data to estimate net transition probabilities; estimation of the number of participants transitioning from normal weight to overweight and overweight to normal weight (i.e. individ-ual transition probabilities) would require longitudinal data spanning early childhood to late adulthood in multi-ethnic studies, which is unavailable, or if available, likely conducted in prior decades and therefore potentially outdated due to strong overweight and obesity secular trends [20].
accommodated using cluster sampling methods. Although weight was categorized using per-centiles for participants 2–19 years of age and standard BMI cut-points for participants20 years of age, we observed no evidence of discontinuities by race/ethnicity or sex across the two age groups and therefore presented smoothed results across 2–80 years of age. Next, we used a series of simplex algorithms from linear programming theory to estimate age-, sex-, and race/ ethnic-specific net transition probabilities (Fig 1). Finally, bootstrapping was used to estimate 95% confidence intervals, where the age-specific prevalence was simulated from its asymptotic distribution and net transition probabilities were computed for each simulated prevalence [24].
Population extrapolations of the one-year age- and sex-specific net number of non-institu-tionalized African Americans, Caucasians, and Mexican American males and females transi-tioning from normal weight to overweight (and overweight to obesity) were calculated by multiplying the age (2–80), sex-, and race/ethnic-specific normal weight to overweight (over-weight to obesity) net transition probabilities by the prevalence of normal (over-weight (over(over-weight) and the race/ethnic-, sex- and age-specific 2010 civilian noninstitutionalized population size. Statistical analyses were performed using SAS (Cary, NC), STATA (College Station, TX), and R (Vienna, Austria).
Calibration of net transition probabilities. Estimation of net transition probabilities
required the specification of a cost constant,cij. The cost constant was used to impose an“
econ-omy of movement,”where remaining in the current weight category was always cheapest (i.e. “zero-step”) and two“one-step”movements (e.g. normal weight to overweight) were always cheaper than one“two-step”movement (normal weight to obesity). Conceptually, the cost constant reflected our belief that movement from normal weight to obesity (or vice-versa) in one year was unlikely; instead, staying in the same weight category or a one-step movement (i.e. from normal weight to overweight) were more plausible. Results of our calibration study using longitudinal Coronary Artery Risk Development in Young Adults (CARDIA) study data [28] suggested that the cost constants of 0, 6, and 17 were optimal for describing zero-, one-, and two-step movements between weight categories (S1 Appendix).
Validation of net transition probabilities. Net transition probabilities can be validly
esti-mated from cross-sectional data under the assumption that the transitions remain stable across time [24]. To evaluate this assumption, we conducted a series of simulations that evaluated the ability of earlier NHANES population cross-sections to predict BMI prevalence proportions estimated in later cross-sections. Our results suggested stability in weight transitions between 2007–12 (S1 Fig), thereby validating the use of net transition probabilities to examine one-year weight net transitions.
Results
A total of 21,220 participants (28.6% African American; 48.2% Caucasian; 23.2% Mexican American) aged 2–80 were available for analysis (Table 1). African Americans (median age range: 30–35 years) and Mexican Americans (median age range: 26–27 years) were on average younger than Caucasians (median age range: 40–43 years) and there were approximately equal proportions of males and females across each race/ethnicity (weighted proportion of females range: 49.6%-52.8%). At age two, the prevalence of normal weight ranged from 73.8%—85.0%, with the lowest prevalence observed in Mexican American females and the highest in Cauca-sian males (Fig 1). Mexican American males had the highest prevalence of obesity at age two (16.1%).
normal weight to overweight net transition probabilities were estimated for African American females 22 years of age, for whom a net 4.7% [95% confidence interval (CI): 4.1%, 5.3%] of the normal weight population transitioned to overweight by age 23 (Fig 2). Net normal weight to overweight net transition probabilities also peaked during the 20s for the remaining popula-tions, with the exception of Mexican American females, for whom the net transition probability to overweight [net transition probability = 3.7% (95% CI: 3.4, 4.1)] peaked at 33 years of age. Mexican American females also were the only population for whom normal weight to
Fig 1. Smoothed age (2–80 years)-, race/ethnic-, and sex-specific prevalence proportions of normal weight (solid line), overweight (dashed line), and obesity (dotted line) estimated in n = 21,220 NHANES participants.
doi:10.1371/journal.pone.0158025.g001
Table 1. Race/ethnic- and sex-specific demographics for n = 21,220 NHANES (2007–12) participants 2–80 years of age used to characterize the age-specific net probability of transitioning between normal weight, overweight, and obesity.BMI, body mass index; N, unweighted number; IQR, interquartile range.
Characteristic African American Caucasians Mexican Americans
Females Males Females Males Females Males
N. 3,026 3,043 4,998 5,226 2,417 2,510
Median age (IQR) 35 (17, 52) 30 (16, 49) 43 (23, 59) 40 (21, 56) 26 (12, 43) 27 (13, 41) Weight category
% Normal weight 31.3 42.5 44.7 36.7 38.9 33.8
% Overweight 22.9 25.5 26.1 33.8 26.2 33.2
% Obese 45.7 31.9 29.2 29.5 34.9 33.0
Median BMI percentile (IQR), children 2–19
74.0 (44.7, 93.8) 71.0 (41.4, 92.8) 65.0 (37.6, 87.6) 64.8 (35.9, 88.2) 73.3 (45.3, 92.3) 77.2 (48.0, 94.7)
Median BMI (IQR), adults 20–80
31.0 (26.1, 36.6) 27.9 (23.9, 32.7) 26.9 (23.2, 32.0) 27.8 (24.8, 31.4) 29.2 (25.2, 33.9) 28.5 (25.8, 31.9)
overweight net transition probabilities were consistently favored from two to 80 years of age; for the remaining populations, larger proportions of the population moved from normal weight to overweight than from overweight to normal weight until approximately 62 years of age (race/ethnic and sex-specific range: 57–76 years) when overweight to normal weight net transitions were favored, represented by net transition probabilities = 0.
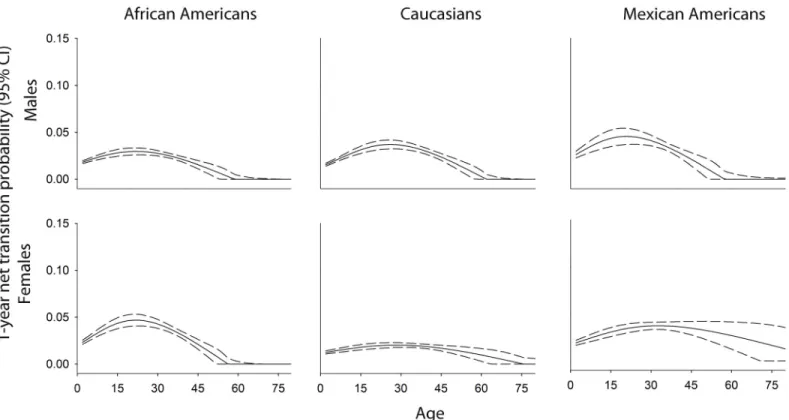
Unlike normal weight to overweight net transitions probabilities that peaked in early adult-hood for all populations, estimated one-year net transition probabilities from overweight to obesity peaked at age two for all populations and were highest for Mexican American males, where a net 12.3% (95% CI: 7.6%, 17.0%) of the overweight population transitioned to obesity by age three. Elevated net transition probabilities at age two also were estimated for African American females [net transition probability = 11.9% (95% CI: 8.5%, 15.3%)], African Ameri-can males [net transition probability = 10.5% (95% CI: 7.1%, 13.9%)], and Caucasian males [net transition probability = 9.1% (95% CI: 5.8, 12.4)], considerably higher than net transition probabilities estimated for Caucasian females [net transition probability = 5.1% (95% CI: 3.5%, 6.7%)] and Mexican American females [net transition probability = 6.0% (95% CI: 4.5%, 7.6%)]. In addition to having the highest estimated overweight to obesity net transition proba-bility at age two, Mexican American males also showed the steepest declines in overweight to obesity net transition probabilities, which declined to approximately 1% at 27 years of age (Fig 3,S1 Table). In contrast, overweight to obesity net transition probabilities for Caucasian females and Mexican American females remained elevated through the fifth decade of life.
Extrapolation to the African American, Caucasian, and Mexican American 2010 civilian noninstitutionalized U.S. population two to 80 years of age demonstrated disparities in the ages associated with the largest net increases in overweight and obesity (Fig 4). Mexican
Fig 2. Age (2–80 years) race/ethnic-, and sex-specific normal weight–to- overweight net transition probabilities estimated in n = 21,220 NHANES participants.
American males were the only population for whom the largest net increases in obesity occurred during early childhood. For African American males and females and Mexican Amer-ican females, age-specific net increases in obesity were approximately constant from early childhood through the second decade of life, whereas net increases in obesity peaked at age 20 for Caucasian males and females. Among African American males, Caucasian males and females, and Mexican American males, net increases in overweight always exceeded net increases in obesity. However, for African American females and Mexican American females, net increases in overweight and obesity converged by 30 and 45 years of age, respectively.
Discussion
Our multi-ethnic study spanning early childhood to late adulthood demonstrated that obesity disparities were apparent by two years of age and were sustained through late adulthood. Ele-vated net transition probabilities to overweight and obesity in childhood and adolescence exac-erbated these obesity disparities, particularly for African American females and Mexican American males and females. Heterogeneity in the ages at which the largest net increases in overweight and obesity occurred also was observed and should be considered when developing and implementing overweight and obesity prevention and control programs.
Very few studies have evaluated transitions to overweight and obesity in large, multi-ethnic populations that span early childhood to late adulthood. Instead, available studies typically span specific life epochs. For example, the Early Childhood Longitudinal Study (ECLS) demon-strated that obesity incidence peaked at approximately six years of age for overweight school-age children, but remained approximately constant among the total cohort between five and 14 years of age [29]. The adolescent to early adulthood obesity transition was examined by
Fig 3. Age (2–80 years)-, race/ethnic-, and sex-specific overweight-to-obesity net transition probabilities estimated in n = 21,220 NHANES participants.
National Longitudinal Study of Adolescent to Adult Health (Add Health) investigators, who reported that African American and Hispanic females as well as older adolescents had the high-est incidence of obesity [17]. The lack of studies spanning these two (and other) critical age epochs underscores the difficulties stakeholders face when trying to understand weight transi-tions across the life course, as it is unclear whether results from studies like ECLS and Add Health can be pieced together with studies of adult populations [30] to provide accurate and widely generalizable inferences across broad age epochs. Existing studies of obesity transitions also are limited by modest numbers of minority participants and were conducted one or two decades ago despite obesity secular trends, potentially limiting their ability to inform contem-porary race/ethnic- and sex-specific weight transition patterns.
Given the challenges described above, it is not surprising that contemporary prevalence esti-mates in multi-ethnic populations currently form the basis by which the burden of overweight and obesity in U.S. populations is monitored [1,31,32]. However, we identified several impor-tant and novel features by extending these prevalence estimates to evaluate net transitions. First, for all populations, overweight to obesity net transition probabilities peaked at age two, although Mexican American males were the only population for whom the largest net increases in obesity occurred during early childhood. These seemingly incongruent results reflect the interplay between population-specific factors including the magnitude of net transition proba-bilities, patterns of change by age, and the prevalence of normal weight, overweight, and obe-sity, therefore providing several avenues to target for obesity prevention, control, and, ultimately, disparities reduction. Interestingly, the only behavioral intervention endorsed by the Community Preventive Services Task Force (CPSTF) for obesity prevention and control in children—reducing screen time—is recommended for children 13 years of age and younger
Fig 4. One-year age-specific population extrapolations of the net number of non-institutionalized African American, Caucasian, and Mexican American males and females 2–80 years of age transitioning to overweight and obesity.
[33] and therefore may help alleviate obesity disparities given population extrapolations sug-gesting larger proportional increases in obesity from early childhood throughout 13 years of age in African Americans and Mexican Americans when compared to Caucasians. However, net transitions to overweight and obesity remain elevated for all populations through later ado-lescence and early adulthood, necessitating additional research to prevent or reverse obesity during these critical age epochs.
The intermediate role of overweight also was masked by previous studies of prevalence. For example, among African American females, the net numbers transitioning to overweight were always equal to or higher than then net numbers transitioning to obesity. However, the preva-lence of obesity was higher than the prevapreva-lence of overweight across all ages. These seemingly incongruent observations reflected the intermediate role of overweight, as large normal weight to overweight net transitions were offset by concurrently large overweight to obesity net transi-tions that blunted increases in the prevalence of overweight. It remains important to under-stand the extent to which the previously reported stable prevalence of overweight over the past five decades [1,20] as well as any future overweight trends, reflect changes in net transitions from normal weight to overweight, changes in net transitions from overweight to obesity, or a combination of the two.
Heterogeneity in overweight and obesity transitions across the life course also merits con-sideration when designing and implementing obesity prevention and control programs, as fail-ure to consider such heterogeneity could potentially exacerbate obesity disparities. For
example, obesity control interventions, i.e. interventions that reduce obesity prevalence, may be a more effective means of reducing the obesity burden than obesity prevention interventions in Mexican American adult males, for whom the greatest net population shifts to obesity occurred by the mid-20s. Examples of evidence-based obesity control interventions in adult populations include worksite programs and technology-supported multicomponent coaching to reduce weight [33,34]. In contrast, few evidence-based programs have been recommended for adult obesity prevention, although overweight to obesity net transition probabilities gener-ally remained elevated through adulthood, particularly for Mexican American females. How-ever, few studies have simultaneously evaluated obesity prevention and control interventions in multi-ethnic populations spanning childhood to late adulthood to understand the implica-tions of different evidence-based and hypothetical prevention and control strategies.
scenarios is supported by longitudinal studies of children [37] and adults [38], which reported modest changes in weight and thus weight categories over the short time periods evaluated herein, thereby lending additional support to our chosen approach. Third, we did not incorpo-rate any contextual factors available in NHANES, including socioeconomic status, food secu-rity, and diet. Studies evaluating whether these and other measures modify the observed net transition probabilities are therefore warranted. Finally, our validation study only supported estimation of one-year net transition probabilities; estimation of five-year, 10-year, or 20-year net (or individual) transitions would require longitudinal data. Nonetheless, one-year net tran-sition probabilities capture important and contemporary population-level dynamics for imme-diate clinical and public health action, can be calculated for a wide range of population health metrics (e.g. hypertension, physical activity, and diabetes), and may be particularly useful in resource poor settings where longitudinal studies are infeasible.
By late adolescence, large proportions of the African American, Caucasian, and Mexican American populations have transitioned from normal weight. Each population showed distinct patterning in the ages at which peak population shifts to overweight and obesity occurred, with earlier and sustained transitions from normal weight observed in African Americans and Mexi-can AmeriMexi-cans. U.S. minorities already shoulder elevated rates of many obesity-associated chronic diseases and the early transitions from normal weight may further increase these dis-parities if left unaddressed.
Supporting Information
S1 Appendix. Appendix describing analytic methods in additional detail and results of the calibration and validation studies.
(DOCX)
S1 Fig. Simulation results examining the stability of weight category transitions by age (2–
80 years) in n = 21,220 African American, Caucasian, and Mexican American male and
female NHANES participants, 2007–2012.The stability of weight category transitions across
time is assessed by the ability of net transition probabilities estimated in the 2007–2008 NHANES population cross-sections to predict the prevalence of normal weight, overweight, and obesity in the 2009–2010 (panels A, B, and C) and 2011–2012 (panels D, E, and F) inde-pendent NHANES population cross-sections.
(TIF)
S1 Table. Selected age (2–80 years)-, race/ethnic (African American, Caucasian, and
Mexi-can AmeriMexi-can)-, and sex-specific net transition probabilities between normal weight and overweight and overweight and obesity estimated in n = 21,220 National Health and Nutri-tion ExaminaNutri-tion Survey (NHANES) participants.
(DOCX)
Acknowledgments
We thank the staff and participants of the CARDIA and NHANES studies for their important contributions.
Author Contributions
References
1. Ogden CL, Carroll MD, Kit BK, Flegal KM (2014) Prevalence of childhood and adult obesity in the United States, 2011–2012. JAMA 311: 806–814. doi:10.1001/jama.2014.732PMID:24570244 2. Zamosky L (2013) The obesity epidemic. While America swallows $147 billion in obesity-related
health-care costs, physicians called on to confront the crisis. Med Econ 90: 14–17.
3. Wang Y, Beydoun MA, Liang L, Caballero B, Kumanyika SK (2008) Will all Americans become over-weight or obese? estimating the progression and cost of the US obesity epidemic. Obesity (Silver Spring) 16: 2323–2330.
4. Olshansky SJ, Passaro DJ, Hershow RC, Layden J, Carnes BA, Brody J, et al. (2005) A potential decline in life expectancy in the United States in the 21st century. N Engl J Med 352: 1138–1145. PMID:15784668
5. Cowie CC, Rust KF, Ford ES, Eberhardt MS, Byrd-Holt DD, Li C, et al. (2009) Full accounting of diabe-tes and pre-diabediabe-tes in the U.S. population in 1988–1994 and 2005–2006. Diabetes Care 32: 287– 294. doi:10.2337/dc08-1296PMID:19017771
6. The Lancet N (2013) Disparities in stroke: not just black and white. Lancet Neurol 12: 623. doi:10. 1016/S1474-4422(13)70137-6PMID:23769593
7. Zhang Y, Galloway JM, Welty TK, Wiebers DO, Whisnant JP, Devereux RB, et al. (2008) Incidence and risk factors for stroke in American Indians: the Strong Heart Study. Circulation 118: 1577–1584. doi: 10.1161/CIRCULATIONAHA.108.772285PMID:18809797
8. Cooper R, Cutler J, Desvigne-Nickens P, Fortmann SP, Friedman L, Havlik R, et al. (2000) Trends and disparities in coronary heart disease, stroke, and other cardiovascular diseases in the United States: findings of the national conference on cardiovascular disease prevention. Circulation 102: 3137–3147. PMID:11120707
9. Howard BV, Lee ET, Cowan LD, Devereux RB, Galloway JM, Go OT, et al. (1999) Rising tide of cardio-vascular disease in American Indians. The Strong Heart Study. Circulation 99: 2389–2395. PMID: 10318659
10. Reeves GK, Pirie K, Beral V, Green J, Spencer E, Bull D, et al. (2007) Cancer incidence and mortality in relation to body mass index in the Million Women Study: cohort study. BMJ 335: 1134. PMID: 17986716
11. Cao Y, Ma J (2011) Body mass index, prostate cancer-specific mortality, and biochemical recurrence: a systematic review and meta-analysis. Cancer Prev Res (Phila) 4: 486–501.
12. Moghaddam AA, Woodward M, Huxley R (2007) Obesity and risk of colorectal cancer: a meta-analysis of 31 studies with 70,000 events. Cancer Epidemiol Biomarkers Prev 16: 2533–2547. PMID:
18086756
13. Beuther DA, Sutherland ER (2007) Overweight, obesity, and incident asthma: a meta-analysis of pro-spective epidemiologic studies. Am J Respir Crit Care Med 175: 661–666. PMID:17234901
14. Christensen R, Bartels EM, Astrup A, Bliddal H (2007) Effect of weight reduction in obese patients diag-nosed with knee osteoarthritis: a systematic review and meta-analysis. Ann Rheum Dis 66: 433–439. PMID:17204567
15. Kenchaiah S, Evans JC, Levy D, Wilson PW, Benjamin EJ, Larson MG, et al. (2002) Obesity and the risk of heart failure. N Engl J Med 347: 305–313. PMID:12151467
16. Rauscher GH, Mayne ST, Janerich DT (2000) Relation between body mass index and lung cancer risk in men and women never and former smokers. Am J Epidemiol 152: 506–513. PMID:10997540 17. Gordon-Larsen P, Adair LS, Nelson MC, Popkin BM (2004) Five-year obesity incidence in the transition
period between adolescence and adulthood: the National Longitudinal Study of Adolescent Health. Am J Clin Nutr 80: 569–575. PMID:15321794
18. Reis JP, Loria CM, Lewis CE, Powell-Wiley TM, Wei GS, Carr JJ, et al. (2013) Association between duration of overall and abdominal obesity beginning in young adulthood and coronary artery calcifica-tion in middle age. JAMA 310: 280–288. doi:10.1001/jama.2013.7833PMID:23860986
19. Reis JP, Hankinson AL, Loria CM, Lewis CE, Powell-Wiley T, Wei GS, et al. (2013) Duration of abdomi-nal obesity beginning in young adulthood and incident diabetes through middle age: the CARDIA study. Diabetes Care 36: 1241–1247. doi:10.2337/dc12-1714PMID:23248193
20. Fryar CD, Carroll MD, Ogden CL (2014) Prevalence of Overweight, Obesity, and Extreme Obesity Among Adults: United States, 1960–1962 Through 2011–2012. Atlanta, GA: National Center for Health Statistics.
Association's strategic Impact Goal through 2020 and beyond. Circulation 121: 586–613. doi:10.1161/ CIRCULATIONAHA.109.192703PMID:20089546
23. Kuczmarski RJ, Ogden CL, Guo SS, Grummer-Strawn LM, Flegal KM, Mei Z, et al. (2002) 2000 CDC Growth Charts for the United States: methods and development. Vital Health Stat 11: 1–190. 24. Kassteele J, Hoogenveen RT, Engelfriet PM, Baal PH, Boshuizen HC (2012) Estimating net transition
probabilities from cross-sectional data with application to risk factors in chronic disease modeling. Stat Med 31: 533–543. doi:10.1002/sim.4423PMID:22139860
25. Hosmer DW, Lemeshow S (2000) Applied Logistic Regression, Second Edition. New York: Wiley. 26. McCullagh P, Nelder J (1989) Generalized Linear Models, Second Edition. London: Chapman and
Hall/CRC.
27. Eilers PHC, Marx BD (1996) Flexible smoothing with B-splines and penalties (with discussion). Statisti-cal Science 11: 89–121.
28. Friedman GD, Cutter GR, Donahue RP, Hughes GH, Hulley SB, Jacobs DR Jr, et al. (1988) CARDIA: study design, recruitment, and some characteristics of the examined subjects. J Clin Epidemiol 41: 1105–1116. PMID:3204420
29. Cunningham SA, Kramer MR, Narayan KM (2014) Incidence of childhood obesity in the United States. N Engl J Med 370: 403–411. doi:10.1056/NEJMoa1309753PMID:24476431
30. Lewis CE, Jacobs DR Jr., McCreath H, Kiefe CI, Schreiner PJ, Smith DE, et al. (2000) Weight gain con-tinues in the 1990s: 10-year trends in weight and overweight from the CARDIA study. Coronary Artery Risk Development in Young Adults. Am J Epidemiol 151: 1172–1181. PMID:10905529
31. Flegal KM, Carroll MD, Kit BK, Ogden CL (2012) Prevalence of obesity and trends in the distribution of body mass index among US adults, 1999–2010. JAMA 307: 491–497. doi:10.1001/jama.2012.39 PMID:22253363
32. Ogden CL, Carroll MD, Curtin LR, McDowell MA, Tabak CJ, Flegal KM (2006) Prevalence of overweight and obesity in the United States, 1999–2004. JAMA 295: 1549–1555. PMID:16595758
33. Community Preventive Services Task Force (2014) Guide to Community Preventive Services. Obesity prevention and control: interventions in community settings.
34. Moyer VA, Force USPST (2012) Screening for and management of obesity in adults: U.S. Preventive Services Task Force recommendation statement. Ann Intern Med 157: 373–378. PMID:22733087 35. Gonzalez-Barrera A, Lopez MH (2013) A demographic portrait of Mexican-Origin Hispanics in the
United States. Washington, DC: Pew Hispanic Center.
36. Passel J, Cohn D (2008) U.S. Population Projections: 2005–2050. Washington, D.C.: Pew Hispanic Center, February; Census Bureau 2011 population estimates.
37. Tran MK, Krueger PM, McCormick E, Davidson A, Main DS (2016) Body Mass Transitions Through Childhood and Early Adolescence: A Multistate Life Table Approach. Am J Epidemiol 183: 643–649. doi:10.1093/aje/kwv233PMID:26984962
38. Stenholm S, Vahtera J, Kawachi I, Pentti J, Halonen JI, et al. (2015) Patterns of weight gain in middle-aged and older US adults, 1992–2010. Epidemiology 26: 165–168. doi:10.1097/EDE.