Experimental and Calculated Electrochemical Potentials of
Com-mon Organic Molecules for Applications to Single-Electron Redox
Chemistry
Hudson G. Roth Nathan A. Romero David A. Nicewicz*
Department of Chemistry, University of North Carolina at Chapel Hill, 125 South Road, Chapel Hill, NC 27599, USA [email protected]
Received: 23.10.2015
Accepted after revision: 24.11.2015 Published online: 23.12.2015
DOI: 10.1055/s-0035-1561297; Art ID: st-2015-r0838-c
Abstract Herein, we report half-peak potentials for over 180 organic substrates obtained via cyclic voltammetry. These values are of great use in assessing the thermodynamics of an electron-transfer process. In addition, we disclose a simple computational method to determine re-dox potentials of organic substrates.
Key words cyclic voltammetry, photoredox catalysis, redox potential, electron transfer, computational chemistry
Over the past few years, photoredox catalysis has opened new avenues for the construction of previously challenging bonds and structural motifs. The rapid develop-ment of this area has resulted in the publication of multiple reviews, which we encourage the reader to reference for specific applications.1–3 The power of these transformations stems from the cooperation of an oxidant and a reductant that work in tandem to achieve the transformation. Typical-ly, this is enabled by the use of visible light that excites a given catalyst making it capable of undergoing a photoin-duced electron-transfer (PET) that would otherwise be en-dergonic for the ground-state catalyst.
Organic chemists often invoke a simplified means of calculating the Gibbs free energy of a given PET by disre-garding coulombic interactions (Equation 1). This requires knowledge of the standard reduction potential for the elec-tron donor (E0
D+/D) and the acceptor (E0A/A–), along with E0,0 the excited-state energy of the catalyst. However, unlike in-organic species and organometallic complexes, whose re-dox potentials have been studied extensively,4 organic sub-strates have much less data available for reasons explained below.
Equation 1
Cyclic voltammetry is a common means of measuring the standard reduction potential of a substrate. Since the analyte solution remains unstirred while the potential is scanned, only the molecules at the electrode surface under-go an electron transfer (ET); if this is truly reversible, the oxidized and reduced forms of the substrate will exist in dy-namic equilibrium at the electrode surface and the ob-served current will be directly related to the ET between these two species (Equation 2). A simplified, but reliable, way to calculate E0
1/2 for these system is to average the for-ward and reverse peak potentials.5
Equation 2
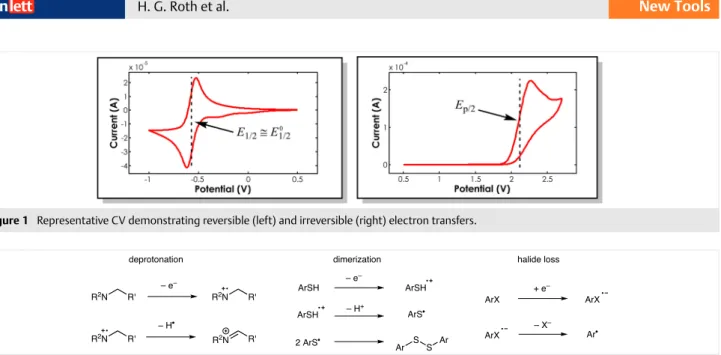
The lack of data on organic substrates stems in part from the fact that they often exhibit irreversible cyclic vol-tammograms (CV, Figure 1). This is due to the reactivity of the oxidized/reduced species which leads to rapid degrada-tion (Scheme 1).6 Therefore, the redox couple is not in equi-librium at the electrode surface and the current observed is related to the rate of electron transfer, which complicates the calculation of E0
1/2 as the ET rate constant is required.6 A number of corrections for determining the true E0
1/2 value have been developed, but these require knowledge of the competing pathway(s) and the corresponding rate con-stant(s). An example of this has been published by Savéant for thiophenoxides.7 Even though this gives a more accurate
understanding of the thermodynamics for a given ET, the experimental set-up and time required to collect the data can make it difficult to obtain.
One approach to estimating E0
1/2 for a compound is to utilize the peak potential (Ep).4 However, we found that peak potentials consistently overestimated the redox po-tentials for compounds whose thermodynamics popo-tentials have been accurately measured by nonelectrochemical
techniques that are impervious to corruption by fast de-composition.8,9 For example, we find a peak potential of 2.3 V vs. SCE for mesitylene (see Supporting Information, Figure S1), whereas the accurate E0
1/2 value reported by Far-id et al. is 2.05 ± 0.01 V vs. SCE.
Alternatively, one can use half-peak potentials (Ep/2), which correspond to the potential at half the maximum current in the CV, as a way to estimate E0
1/2.10 For mesity-Figure 1 Representative CV demonstrating reversible (left) and irreversible (right) electron transfers.
Scheme 1 Common degradation pathways for organic substrates that prevent back electron transfer in CV experiments
ArSH – e
–
ArSH
ArSH ArS•
2 ArS•
Ar S S Ar
ArX + e
–
ArX – X Ar•
–
R2N R' – e
–
R2N R'
R2N R' R2N R'
deprotonation dimerization halide loss
– H•
ArX – H+
Figure 2 Electrochemical series of common organic functional groups; potentials are reported against SCE TBA salts
-3.0 V –2.0 V –1.0 V 0 V +1.0 V +2.0 V +3.0 V
alkyl halides
aryl acetylenes aromatic hydrocarbons aliphatic alkenes
styrenes
aryl halides phenols
alkyl and aryl ethers enol ethers
alkyl and aryl amines enamines
thiophenols aryl disulfides aryl halides
aromatic heterocycles anhydrides
amides aryl nitriles
aryl aldehydes and ketones
sulfonyl chlorides
esters carboxylic acids
carboxylates
imines, oximes, and hydrazones imines
lene, we measure an Ep/2 of 2.07 V vs. SCE, which is in satis-factory range of the potential reported by Farid. Moreover, half-peak potentials have been previously utilized as a pre-ferred approach to estimating E0
1/2.11 Since these values are easily obtained with a basic electrochemical setup, we ad-vocate they are sufficient for the purposes of the organic chemist since they still provide an assessment of the ΔG0 for a given PET.
However, we want to emphasize that since these values are not truly reflective of E0
1/2, the value of ΔG calculated should not be taken as absolute due to the issues explained above. For strict determination of the true E0
1/2 value for a given substrate, we direct the reader to studies addressing this topic.12–14
In an effort to make Ep/2 values more available and uti-lized by synthetic chemists, primarily for the application of photoredox catalysis, we report the redox potentials of over 180 organic substrates. Analytes are organized by function-al groups and potentifunction-als are reported in volts against the saturated calomel electrode (SCE, Figure 2). As they are re-ported here, negative values indicate reductions while posi-tive ones signify oxidations.
Furthermore, we conducted all experiments with a standard set of conditions to maintain internal consistency; this included performing all measurements with the same scan rate as this is known to have a subtle impact on Ep/2 values.15 In addition, to reduce the ambiguity of the report-ed potentials, we follow the suggestions by Addison and provide 1) an experimental E0
1/2 value for a standard redox couple, namely Fc+/Fc,16 and 2) the means by which we con-verted measured values from silver-silver chloride into SCE.17,18
Figure 3 Electrochemical series of aromatic hydrocarbons and aryl alkynes; potentials are reported against SCE
+1.5 V +2.0 V +2.5 V
Me
Me
Me Me Me
Me
Me
2.36
2.22
2.07
1.64
2.27 1.84
H
2.22
MeO
1.65
Ph H
Me
Figure 4 Electrochemical series of alkenes (+1.0 to +1.75 V); potentials are reported against SCE
+1.0 V +1.25 +1.50
Me Me
Cl
Me
F Me
Me
1.74
1.73 1.73
1.71
Me
Me Me
Me Me
1.70 1.66
1.66 1.65
1.64
Me
Me
Me
OMe Me
Me
1.54 1.54
1.59 1.60
1.64
Me
OMe
1.48
Me
Me MeO
Me
Me
Me
Me O
O
1.43 1.24
1.15 1.15
t-Bu
S
Me
1.49
+1.75
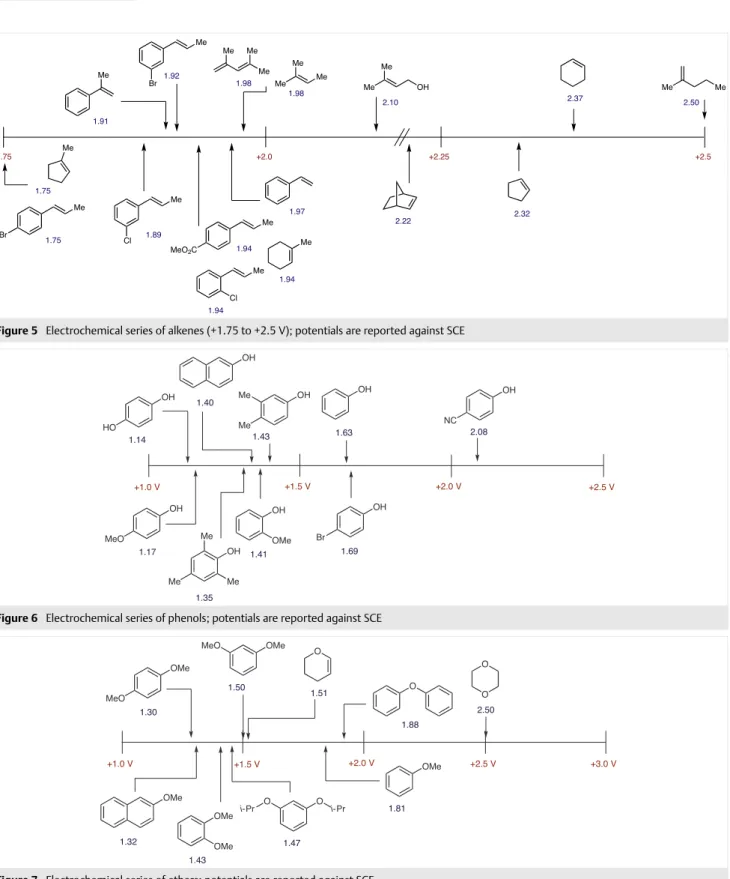
Figure 5 Electrochemical series of alkenes (+1.75 to +2.5 V); potentials are reported against SCE
Figure 6 Electrochemical series of phenols; potentials are reported against SCE
Figure 7 Electrochemical series of ethers; potentials are reported against SCE
+1.75 +2.0 +2.25 +2.5
Me
1.92 Me
1.91 Me
Me
1.89 1.75
Br
Me
Cl Br
1.75
Me
Me Me
Me Me
Me
2.37
2.32 2.22
1.98 1.98
Cl Me
Me 1.97
1.94
1.94
Me Me
2.50 Me
Me
OH 2.10
MeO2C
Me
1.94
+1.0 V +1.5 V +2.0 V +2.5 V
OH
Br
NC
OH
OH
MeO
OH
OMe OH
OH
Me Me
Me
OH Me
Me OH
HO
OH
1.63
1.14 1.43
1.35 1.40
1.41 1.17
2.08
1.69
+1.0 V +1.5 V +2.0 V +2.5 V +3.0 V
O O
2.50
O
O O
i-Pr
i-Pr
O
OMe
OMe
OMe
OMe MeO
OMe
MeO
OMe
1.51
1.81
1.43 1.50
1.30
1.32 1.47
1.88
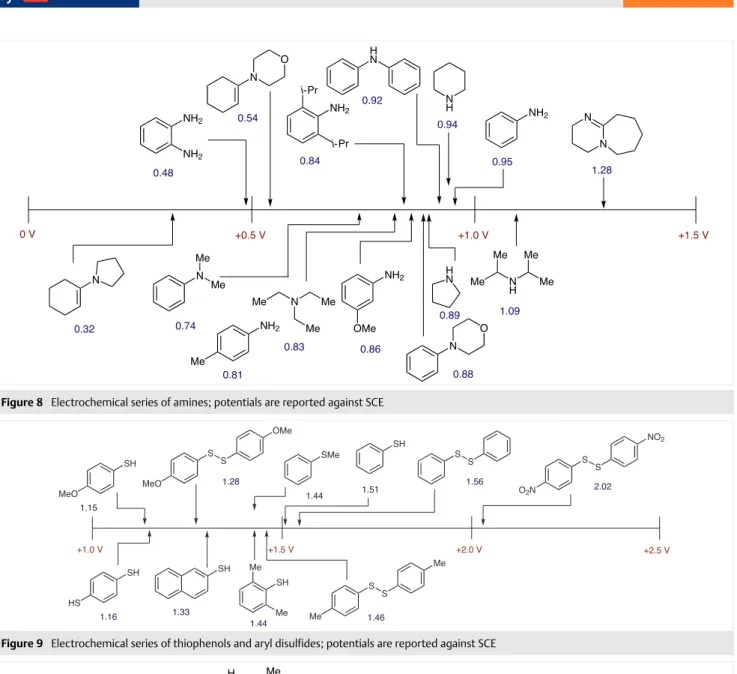
Figure 8 Electrochemical series of amines; potentials are reported against SCE
Figure 9 Electrochemical series of thiophenols and aryl disulfides; potentials are reported against SCE
0 V +0.5 V +1.0 V +1.5 V
Me Me
N H
Me
Me H
N N H
Me N
Me Me
N N NH2
N Me Me
H N
N O NH2
NH2
Me
NH2
NH2
i-Pr
i-Pr
NH2
OMe N
N
O
1.09 0.89
0.94
0.83
1.28 0.95
0.74
0.92
0.88 0.48
0.81
0.86 0.84
0.54
0.32
S S
S S S
S S
S
Me
Me OMe
MeO O
2N
NO2 SMe
SH SH
MeO
SH Me
Me SH
HS
SH
1.51
1.16 1.44
1.15
1.33
1.44
1.56
1.46
1.28 2.02
+1.0 V +1.5 V +2.0 V +2.5 V
N
O O
N H N
N H N N
S
N
H N H
N
H N
H N N
H H N
S N
H O
O N
H S
Me
OH
NH2 OMe
MeO
MeO S
S
S
1.04
1.94 1.73
2.21
1.15
0.95 1.16
0.97
1.04
0.91
0.81 1.62
1.03
1.74 1.07
2.14
+0.5 V +1.0 V +1.5 V +2.0 V +2.5 V
Figure 11 Electrochemical series of alkyl and aryl halides; potentials are reported against SCE
Figure 12 Electrochemical series of aldehydes; potentials are reported against SCE
Figure 13 Electrochemical series of benzaldehyde-derived imines; potentials are reported against SCE
–3.0 V –2.0 V –1.0 V +2.0 V +3.0 V
Br Br I I
Cl Cl Cl
Cl Cl
Cl
–2.48 –1.82
–1.92 –1.93
Cl
Br I
Br
I O2N
F
I
Cl
2.61
2.50 2.17
2.10 –1.95
2.15 –1.94
–1.23
Br
I
I
Cl
Ph Br
O
EtO Br O
EtO O
Br OEt O
–0.62 –1.08
–1.46
–0.5V
–2.5 V –2.0 V –1.5 V -1.0 V –0.5 V +2.0 V +2.5 V
Me Me
O
O
O O
O Me
MeO O HO
O Cl
O F3C
O O2N
O Ph
O NC
O
–2.24
–2.28
–1.93 –1.94
2.06 1.95
–1.85
–1.66
–1.42
–0.86 –1.72
–1.73
N OH N N
N N
N N Me
F OMe
Ph Ph
0.97
1.50
1.52
1.67 1.64
1.86
–2.0 V –1.5 V +1.0 V +1.5 V +2.0 V
N
N
F
N OMe N
Me
2.01 –1.91
–1.90
–1.88
–2.5 V
Figure 14 Electrochemical series of ketones; potentials are reported against SCE
Figure 15 Electrochemical series of amides and TBA carboxylates; po-tentials are reported against SCE
Figure 16 Electrochemical series of carboxylic acids, esters, and ni-triles; potentials are reported against SCE
Figure 17 Electrochemical series of acyl/sulfonyl chlorides and anhydrides; potentials are reported against SCE
–2.5 V –2.0 V –1.5 V –1.0 V -0.5 V +2.5 V +3.0 V
O Me
O
Me O
Me O
Me
Me O
Ph
Me O
F3C
Me O
O2N Me
O
F
Me O
Cl
Me O
Br
Me O
I
–2.33
2.66
–2.11
–2.16
–1.91
–1.74
–0.93 –2.13
–1.91
–1.89
–1.85
0 V +1.5 V +2.0 V +2.5 V +3.0 V NH
N N O
O Me Me
O
N Me
Me
2.26 2.58 1.55
Me O
O
Me Me
Me O
O O
O
1.47
1.26 1.40
N(n-Bu)4
N(n-Bu)4
N(n-Bu)4
–2.5 V –.0 V –1.5 V
CN
CN CN CN
CN NC
NC
–2.43
–1.70
–1.90 –1.64
O O
O
OMe
NC
O
OMe –2.13
–2.34 OH –1.72
O
–2.29
-1.5 V -1.0 V -0.5 V 0 V
SO2Cl
SO2Cl
SO2Cl SO2Cl O
Cl Me
CF3 F3C Me
Me Me
NO2
–0.51
–1.45
–0.45 –1.37
–1.20
F3C O O
CF3 O O
O O
O O
O
O O
O
–0.20 –1.34
–-0.98
Figure 18 Electrochemical series of inorganics, arylsilanes, and TBA halides; potentials are reported against SCE
Figure 19 Electrochemical series of hypervalent iodines, nitrobenzene, and N-chlorosuccinimide; potentials are reported against SCE
Figure 20 Electrochemical series of photoredox catalysts; potentials are reported against SCE
Oxidation potentials were obtained for aromatic hydro-carbons and aryl acetylenes (Figure 3), aliphatic and aro-matic olefins (Figure 4 and Figure 5). For simple aliphatic alkynes, no peak was observed within the electrochemical potential window of acetonitrile. Arenes bearing oxygen (Figure 6 and Figure 7), nitrogen (Figure 8), or sulfur-based (Figure 9) substituents were also measured. Oxidation po-tentials decrease according to O > S > N. Aliphatic and alke-nyl groups bearing oxygen/nitrogen are also reported. Oxi-dation potentials for a representative sample of heterocy-cles bearing O, N, and S were measured (Figure 10). Simple aliphatic and aromatic halides were investigated; the ease of oxidation and reduction follows I > Br > Cl (Figure 11). Re-dox data on aldehydes (Figure 12) and benzaldehyde-de-rived imines, oximes, and hydrazones (Figure 13) were also gathered. A variety of substituted acetophenones and alkyl ketones were also investigated (Figure 14). Oxidation po-tentials for amides and tetra-n-butylammonium carboxyl-ate salts (Figure 15) were collected along with reduction potentials of carboxylic acids, esters, and nitriles (Figure 16), plus acyl/sulfonyl chlorides and anhydrides (Figure 17). Electrochemical potentials of ferrocene, ceric ammonium nitrate, tetra-n-butylammonium halides, and aryl silanes
were collected (Figure 18) along with reduction potentials of nitroarenes, hypervalent iodides, and succinimides (Fig-ure 19). Ground-state potentials were obtained for a variety of catalysts commonly employed in photoredox-mediated transformations (Figure 20). As these species are quite well studied, information on their corresponding excited-state potentials can be readily found in the literature along with examples of their applications.1–3
The complications associated with measuring accurate electrochemical potentials of organic molecules – particu-larly when irreversible couples are involved – has prompted the application of computational methods to electrochemi-cal inquiries.19–24 Previous attempts to correlate redox po-tentials calculated by DFT with experimental data mostly rely on redox potentials gathered from multiple sources in the literature.20,24 Although these studies generally find at least moderate correspondence between calculation and experiment, comparison with a single source of electro-chemical data would eliminate the difficulty in completely accounting for experimental differences (such as working electrode, reference electrode, and scan rate) when concat-enating data from various sources. This motivated us to car-ry out DFT calculations on the data set presented herein.
0 V +0.5 V +1.0 V +2.5 V
Cl
Br I
1.01
0.71 0.26
Si X
X = Cl, 2.41 X = H, 2.42 Fe
0.42 (NH4)2Ce(NO3)6
0.98 N(n-Bu)4
N(n-Bu)4
N(n-Bu)4
I
I
OC(O)CF3
OC(O)CF3
OAc OAc
NO2
–0.26
–1.12 –1.19
N Cl O
O–0.27
–1.5 V –1.0 V –0.5 V 0 V
–2.5 V –2.0 V –1.5 V –1.0 V –0.5 V 0 V 0.5 V 1.0 V 1.5 V
–1.10
Eosin Y
Rose Bengal
–0.86
O Ph Ph Ph
–0.28
Triphenylpyrylium
Ru N N
N N
–0.59
BF4
9-Mesityl-3,6-di-tert-butyl-10-phenylacridinium
O HO2C
O Br Br Br
Br HO
O NaO2C
Cl Cl
O I I
ONa I Cl Cl N
N
Tris(bipyridine)ruthenium(II)
Tris[2-phenylpyridinato-C2
,N]iridium(III)
Ru N N
N N N N
Tris(bipyridine)ruthenium(II)
Ir N
N N 2+
2+
–1.42, Ru(II)/Ru(I)
1.39 Ru(II)/Ru(III) 0.72, Ir(III)/Ir(IV)
–2.17, Ir(III)/Ir(II)
Tris[2-phenylpyridinato-C2,N]iridium(III)
Ir N
N
N S
N NMe2
Me2N
Methylene blue
–0.32
N Ph
Me Me
Me
tBu tBu BF4
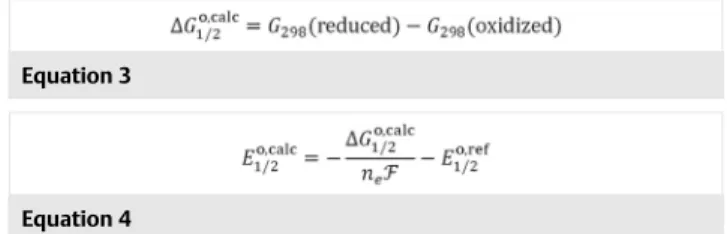
The general procedure for theoretical prediction of re-dox potentials primarily involves calculation of the free en-ergy difference (ΔG0,calc
1/2, Equation 3) between reduced and oxidized forms, which is, in turn, related to E0,calc
1/2 by Equation 4 by referencing to an absolute potential for a standard electrode.25 Most studies to date have followed a free energy cycle to translate gas-phase to solution-phase energies,19,24 requiring separate calculation of the solvation energy associated with each species (i.e., reduced and oxi-dized). A related and operationally simpler approach is to calculate the free energies under a solvation model, thus calling for only two distinct steps which require significant computation.19 By either approach, implicit solvation mod-els can be employed successfully, although the most accu-rate results have been obtained when ‘custom’ solvation parameters are determined by separate optimization.24 We were interested in evaluating a relatively simple computa-tional procedure, with the hope that a more accessible method would be most widely useful.
Equation 3
Equation 4
With this in mind, we calculated the redox potentials for this data set with the frequently used B3LYP26,27 and M06-2X28 functionals, the split valence basis set 6-31+G(d,p),29,30 and the CPCM solvent continuum ap-proach to account for solvation in MeCN.31,32 All calcula-tions were carried out in Gaussian 09,33 and structures were submitted to geometry optimization, with frequency calculations performed on the optimized structures both to verify that the geometries were true minima and to calcu-late free energies at 298 K. The solution-phase energies were referenced to SCE by subtraction of 4.281 V (abs. po-tential of SHE)25 and 0.141 V (conversion of SHE into SCE in MeCN).25 In some cases, minimized geometries could not be reached, owing to fragmentation of the one-electron oxi-dized or reduced species (a pathway particularly relevant in alkyl and aryl halides), and no further analysis was carried out for these molecules. The potentials successfully com-puted with both functionals were compared with the ex-perimental electrochemical potentials, and the results are shown in Figure 21. Both methodologies give a reasonable correlation with the experimental potentials, each exhibit-ing comparable variation [standard deviation of (Ecalc – Eexp) for B3LYP = 0.30 and for M06-2X = 0.29; see Supporting In-formation, Figures S51–S52]. Ultimately, B3LYP/6-31+G(d,p) offers better overall performance, seen as a near
overlay of the regression with the black line representing an ideal agreement between theory and experiment. Whereas B3LYP slightly overestimates reduction potentials and slightly underestimates oxidation potentials, M06-2X over-estimates oxidation potentials more significantly (Support-ing Information, Figure S52), which largely contributes to the global deviation seen for M06-2X. Consideration of in-dividual plots corresponding to the electrochemical series presented in Figures 13–19 (Supporting Information, Fig-ures S35–S50) provides a measure of the strengths and weaknesses of this general analysis. Specifically, some elec-trochemical series reveal discrepancies between the calcu-lated and experimental potentials for certain molecules. Conspicuously, DFT calculations overestimate the oxidation potentials for I–, Br–, and Cl–, by approximately 100% for each halide, and this may signal inadequate treatment of solvation, as previous studies found that use of doubly dif-fuse basis sets led to improved accuracy in anionic spe-cies.20,34 Other notable deviations in calculated oxidation potentials are observed in the case of several aromatic het-erocycles, such as imidazole and the series of thioamides, benzoxazole-2-thione, benzothiazole-2-thione, and benzo-imidazole-2-thione (Figures 10 and S41), for which the po-tentials are overestimated by about 0.5–1.2 V. Although we investigated the 2-mercapto (thiol) form of the benzo-azoles, which showed no significant improvement, one study has suggested that the equilibrium between C=S and C–SH forms shifts towards the C–SH tautomer as the oxida-tion proceeds.35 This is likely to complicate the computa-tional analysis.
Scheme 2 Half reactions for reduction and oxidation
Figure 21 Plot of experimental vs. calculated redox potentials for a se-ries of organic compounds
+
e– (oxidized)(m+n) (reduced)m n
For oxidation:
+
e– (oxidized)m (reduced)(m–n) n
For reduction:
Despite the well-documented pitfalls of DFT in describ-ing the electronic structure of anion radicals,36–39 we find that the calculated reduction potentials give a reasonable correlation with the experiment. The most noticeable devi-ations occur in the overestimation of the reduction poten-tials for trifluoracetic anhydride (Figures 17 and S46) and γ-butyrolactone (Figures 15 and S45). Notably, the radical anions of these two structures exhibit pyramidalization of a C=O unit, in contrast to the other esters and anhydrides studied which possess extended π systems adjacent to the carbonyl available for delocalization of the added electron density. We speculate that the observed anomalies may be manifestations of DFT’s difficulty in describing systems where symmetry or delocalization changes upon ioniza-tion.40,41
Overall, the results of these computational studies re-veal a reasonable correlation between experimental and theoretical electrochemical redox potentials when using a relatively simple and computationally efficient approach. While B3LYP appears to be the more accurate level of theo-ry, both functionals give rise to deviations in selected cases. Nonetheless, we believe this study validates DFT as a useful tool in predicting solution-phase redox potentials.
Acknowledgment
This research was supported by an NSF-CAREER grant (CHE-1352490). N.A.R. is also grateful for an NSF Graduate Fellowship.
Supporting Information
Supporting information for this article is available online at http://dx.doi.org/10.1055/s-0035-1561297. Supporting InformationSupporting Information
References and Notes
(1) Xi, Y.; Yi, H.; Lei, A. Org. Biomol. Chem. 2013, 11, 2387.
(2) Prier, C. K.; Rankic, D. A.; MacMillan, D. W. C. Chem. Rev. 2013,
113, 5322.
(3) Nguyen, T. M.; Nicewicz, D. A. J. Am. Chem. Soc. 2013, 135, 9588.
(4) Connelly, N. G.; Geiger, W. E. Chem. Rev. 1996, 96, 877.
(5) Mabbott, G. A. J. Chem. Educ. 1983, 60, 697.
(6) Brownson, D. A. C.; Banks, C. E. The Handbook of Graphene
Elec-trochemistry; Springer: London, 2014.
(7) Andrieux, C. P.; Hapiot, P.; Pinson, J.; Saveant, J. M. J. Am. Chem.
Soc. 1993, 115, 7783.
(8) Merkel, P. B.; Luo, P.; Dinnocenzo, J. P.; Farid, S. J. Org. Chem.
2009, 74, 5163.
(9) Luo, P.; Feinberg, A. M.; Guirado, G.; Farid, S.; Dinnocenzo, J. P. J.
Org. Chem. 2014, 79, 9297.
(10)IUPAC Compendium of Chemical Terminology; Nič, M.; Jirát, J.;
Košata, B.; Jenkins, A.; McNaught, A., Eds.; IUPAC: Oxford, 2009.
(11) Xu, H.-C.; Moeller, K. D. Angew. Chem. Int. Ed. 2010, 49, 8004.
(12) Andrieux, C. P.; Blocman, C.; Dumas-Bouchiat, J. M.; Saveant, J. M. J. Am. Chem. Soc. 1979, 101, 3431.
(13) Andrieux, C. P.; Gallardo, I.; Saveant, J. M. J. Am. Chem. Soc. 1989,
111, 1620.
(14) Klingler, R. J.; Kochi, J. K. J. Phys. Chem. 1981, 85, 1731.
(15) See Supporting Information for details.
(16) Measuring the Fc+/Fc redox couple using our experimental
con-ditions afforded E1/2 = +0.45 V vs. Ag|AgCl. Conversion to
volt-ages vs SCE involved the subtraction of 0.03 V for this and all
other measurements, providing a value of +0.42 V for the Fc+/Fc
couple.
(17) Pavlishchuk, V. V.; Addison, A. W. Inorg. Chim. Acta 2000, 298,
97.
(18) Thomas, K. R. J.; Tharmaraj, P.; Chandrasekhar, V.; Bryan, C. D.;
Cordes, A. W. Inorg. Chem. 1994, 33, 5382.
(19) Keith, J. A.; Carter, E. A. J. Am. Chem. Soc. 2012, 134, 7580.
(20) Baik, M.-H.; Friesner, R. A. J. Phys. Chem. A 2002, 106, 7407.
(21) Winget, P.; Weber, E. J.; Cramer, C. J.; Truhlar, D. G. Phys. Chem.
Chem. Phys. 2000, 2, 1231.
(22) Uudsemaa, M.; Tamm, T. J. Phys. Chem. A 2003, 107, 9997.
(23) Baik, M.-H.; Silverman, J. S.; Yang, I. V.; Ropp, P. A.; Szalai, V. A.;
Yang, W.; Thorp, H. H. J. Phys. Chem. B 2001, 105, 6437.
(24) Fu, Y.; Liu, L.; Yu, H.-Z.; Wang, Y.-M.; Guo, Q.-X. J. Am. Chem. Soc.
2005, 127, 7227.
(25) Isse, A. A.; Gennaro, A. J. Phys. Chem. B 2010, 114, 7894.
(26) Lee, C.; Yang, W.; Parr, R. G. Phys. Rev. B: Condens. Matter Mater.
Phys. 1988, 37, 785.
(27) Becke, A. D. J. Chem. Phys. 1993, 98, 5648.
(28) Zhao, Y.; Truhlar, D. G. Theor. Chem. Acc. 2007, 120, 215.
(29) Krishnan, R.; Binkley, J. S.; Seeger, R.; Pople, J. A. J. Chem. Phys.
1980, 72, 650.
(30) McLean, A. D.; Chandler, G. S. J. Chem. Phys. 1980, 72, 5639.
(31) Barone, V.; Cossi, M. J. Phys. Chem. A 1998, 102, 1995.
(32) Cossi, M.; Rega, N.; Scalmani, G.; Barone, V. J. Comput. Chem.
2003, 24, 669.
(33) Frisch, M. J.; Trucks, G. W.; Schlegel, H. B.; Scuseria, G. E.; Robb, M. A.; Cheeseman, J. R.; Scalmani, G.; Barone, V.; Mennucci, B.; Petersson, G. A.; Nakatsuji, H.; Caricato, M.; Li, X.; Hratchian, H. P.; Izmaylov, A. F.; Bloino, J.; Zheng, G.; Sonnenberg, J. L.; Hada, M.; Ehara, M.; Toyota, K.; Fukuda, R.; Hasegawa, J.; Ishida, M.; Nakajima, T.; Honda, Y.; Kitao, O.; Nakai, H.; Vreven, T.; Montgomery, J. A. Jr.; Peralta, J. E.; Ogliaro, F.; Bearpark, M.; Heyd, J. J.; Brothers, E.; Kudin, K. N.; Staroverov, V. N.; Kobayashi, R.; Normand, J.; Raghavachari, K.; Rendell, A.; Burant, J. C.; Iyengar, S. S.; Tomasi, J.; Cossi, M.; Rega, N.; Millam, J. M.; Klene, M.; Knox, J. E.; Cross, J. B.; Bakken, V.; Adamo, C.; Jaramillo, J.; Gomperts, R.; Stratmann, R. E.; Yazyev, O.; Austin, A. J.; Cammi, R.; Pomelli, C.; Ochterski, J. W.; Martin, R. L.; Morokuma, K.; Zakrzewski, V. G.; Voth, G. A.; Salvador, P.; Dannenberg, J. J.; Dapprich, S.; Daniels, A. D.; Farkas, Ö.;
Foresman, J. B.; Ortiz, J. V.; Cioslowski, J.; Fox, D. J. Gaussian 09,
Revision D.01; Gaussian Inc: Wallingford, 2009.
(34) Galbraith, J. M.; Iii, H. F. S. J. Chem. Phys. 1996, 105, 862.
(35) Kouroulis, K. N.; Hadjikakou, S. K.; Kourkoumelis, N.; Kubicki, M.; Male, L.; Hursthouse, M.; Skoulika, S.; Metsios, A. K.; Tyurin,
V. Y.; Dolganov, A. V.; Milaeva, E. R.; Hadjiliadis, N. Dalton Trans.
2009, 10446.
(36) Lee, D.; Furche, F.; Burke, K. J. Phys. Chem. Lett. 2010, 1, 2124.
(37) Patterson, E. V.; Cramer, C. J.; Truhlar, D. G. J. Am. Chem. Soc.
2001, 123, 2025.
(38) Kim, M.-C.; Sim, E.; Burke, K. Phys. Rev. Lett. 2013, 111, 073003.
(39) Rösch, N.; Trickey, S. B. J. Chem. Phys. 1997, 106, 8940.
(40) Keith, J. A.; Carter, E. A. J. Chem. Theory Comput. 2012, 8, 3187.
(41) Cramer, C. J. J. Chem. Soc., Perkin Trans. 2 1999, 2273.