HIGH-THROUGHPUT ANALYSIS OF RNA TERTIARY STRUCTURE AND INTERACTIONS
Philip John Homan
A dissertation submitted to the faculty of the University of North Carolina at Chapel Hill in partial fulfillment of the requirements for the degree of Doctor of Philosophy in the
Department of Chemistry
Chapel Hill 2013
ABSTRACT
Philip John Homan: High-throughput analysis of RNA tertiary structure and interactions (Under the direction of Kevin M. Weeks)
The many important cellular functions of RNA molecules depend on formation of complex tertiary structures. Knowledge of the specific interactions that stabilize these structures is key to understanding the function of the RNA. Current methods to study RNA tertiary structures are limited. Biophysical methods that measure RNA structure produce high-resolution tertiary structures but are limited by the size of the RNA. Current
biochemical methods are difficult to interpret and can only give an average view of all possible structures in solution. In this work I develop two new biochemical techniques that can be used to map tertiary interactions within RNA. First I develop a method in which I blend the principals from modification interference experiments with SHAPE chemistry called 2'-hydroxyl molecular interference (HMX). With this approach I am able to measure structurally crowded regions of an RNA and incorporate this data as experimental constraints in discrete molecular dynamics simulations to yield experimentally informed,
ACKNOWLEDGEMENTS
First, I would like to thank my advisor, Kevin Weeks, for giving me the opportunity to work on this project and who has helped me develop into the scientist I am today.
I’d also like to thank Weeks group members both past and present, for making UNC such a great place to work. I could not ask to be among a better group of scientists and friends, I will truly miss you all.
TABLE OF CONTENTS
LIST OF TABLES... xi
LIST OF FIGURES ... xii
LIST OF ABBREVIATIONS... xix
LIST OF SYMBOLS ... xxii
CHAPTER 1. Introduction... 1
1.1. INTRODUCTION ... 1
1.1.1. RNA structure and function ... 1
1.1.2. Probing RNA structure ... 2
1.1.3. Detection of RNA adducts ... 4
1.1.4. DMD Modeling with biochemical constraints... 5
1.2. RESEARCH OVERVIEW ... 5
1.3. PERSPECTIVE ... 7
1.4. REFERENCES ... 8
CHAPTER 2. RNA tertiary structure analysis and refinement by 2'-hydroxyl molecular interference ... 11
2.1. INTRODUCTION ... 11
2.2. RESULTS ... 13
2.2.1. HMX overview ... 13
2.2.2. Molecular overlap model for HMX intensities... 21
2.2.3. Three-dimensional RNA structure modeling... 23
2.4. METHODS ... 28
2.4.1. RNA constructs... 28
2.4.2. 5'-[32P] RNA radiolabeling. ... 28
2.4.3. RNA modification for molecular interference. ... 29
2.4.4. RNA folding and structural partitioning. ... 29
2.4.5. Reverse transcription and adduct detection. ... 30
2.4.6. Calculation of the HMX score. ... 30
2.4.7. Modeling of adduct disruption of native RNA tertiary structure... 32
2.4.8. HMX-directed structure refinement by DMD. ... 32
2.4.9. Replica exchange DMD simulations and consensus structure modeling. ... 33
2.5. REFERENCES ... 35
CHAPTER 3. HMX reveals tertiary interactios within multiple stable substructures of the Tetrahymena group I intron ... 38
3.1. INTRODUCTION ... 38
3.2. RESULTS ... 39
3.3. DISCUSSION... 44
3.4. METHODS ... 46
3.4.1. RNA constructs... 46
3.4.2. 5'-[32P] RNA radiolabeling ... 46
3.4.3. Denatured RNA modification ... 47
3.4.4. RNA folding and native gel separation... 47
3.4.5. Reverse transcription and adduct detection ... 48
3.5. REFERENCES ... 49
4.2. RESULTS ... 53
4.2.1. Multi-site DMS reactivity with RNA. ... 53
4.2.2. Through-space RNA interactions detected by statistical association analysis. .... 58
4.2.3. Through-space RNA interactions detected by statistical association analysis. .... 59
4.2.4. Multiple RNA conformations detected by spectral clustering... 61
4.3. DISCUSSION... 69
4.3.1. Principles of RNA folding. ... 69
4.3.2. Three-dimensional RNA structure refinement... 71
4.3.3. Perspective. ... 75
4.4. METHODS ... 75
4.4.1. Characterization of reaction between dimethyl sulfate and RNA nucleobases. ... 75
4.4.2. RNA constructs... 76
4.4.3. RNA folding and DMS modification... 77
4.4.4. Reverse transcription and adduct detection. ... 77
4.4.5. Measurement of inter-nucleotide interactions by statistical association analysis. 78 4.4.6. Spectral clustering of multiple conformations in a single RNA ensemble... 81
4.4.7. Estimating relative fractions of different conformations in RNA sample. ... 87
4.4.8. Reconstructing modification frequency profiles of individual conformations in an RNA sample... 89
4.4.9. Three-dimensional RNA structure modeling... 91
4.5. GUIDELINES FOR OF RING-MAP DATA ANALYSIS ... 93
4.5.1. Qualifying data used in RING-MaP calculations ... 93
4.5.1.1. Number of mutations per sequence... 93
4.5.1.2. Mutation frequency of samples... 94
4.5.1.3. Read depth ... 97
4.5.3. Spectral clustering Analysis... 99
4.5.3.1. Eigengap value analysis... 100
4.5.3.2. Fraction of the minor cluster... 100
4.5.3.3. Difference in cluster profiles ... 100
4.5.3.4. Analyzing the TPP riboswitch. ... 101
4.5.3.5. Additional criteria for evaluating data for spectral clustering. ... 103
4.6. ACKNOWLEDGEMENTS... 103
LIST OF TABLES
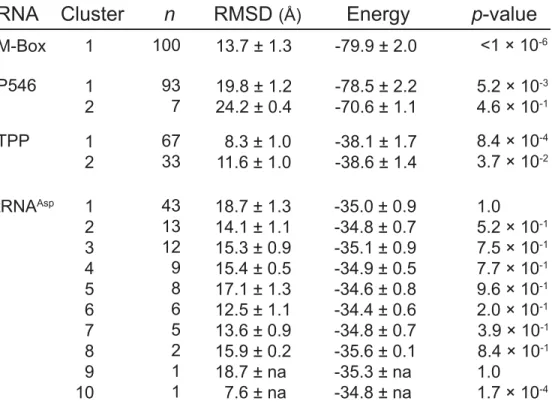
Table 2.1 DMD simulation statistics for the four RNA fold refinements. Cluster populations (n), mean RMSDs, cluster energies, and p-values for
each structure are shown... 24
Table 4.1 Summary of spectral clustering analysis for multiple RNA conformations in single ensembles. Clustering analysis is summarized for the TPP riboswitch, P546 domain, P546 mutants, and the RNase P RNA as a function of different levels of structure. The eigengap value measures the structural difference between clusters; samples with eigengaps greater than 0.03 are taken to have two (or more) distinct clusters. The population of each cluster is given in the last column with the most highly structured cluster listed first. An asterisk indicates that smallest cluster population for the TPP riboswitch, at saturating ligand concentration, was too small to accurately generate DMS reactivity profiles. For analysis, the sample was therefore clustered into two
conformations with populations of 81% and 19%... 62
Table 4.2. Summary of processed massively parallel sequencing data for RNA nucleotide association analysis and spectral clustering. Clustering analysis requires reads that have two or more mutation events. The fourth column lists the number of nucleotides with mutation frequencies greater
LIST OF FIGURES
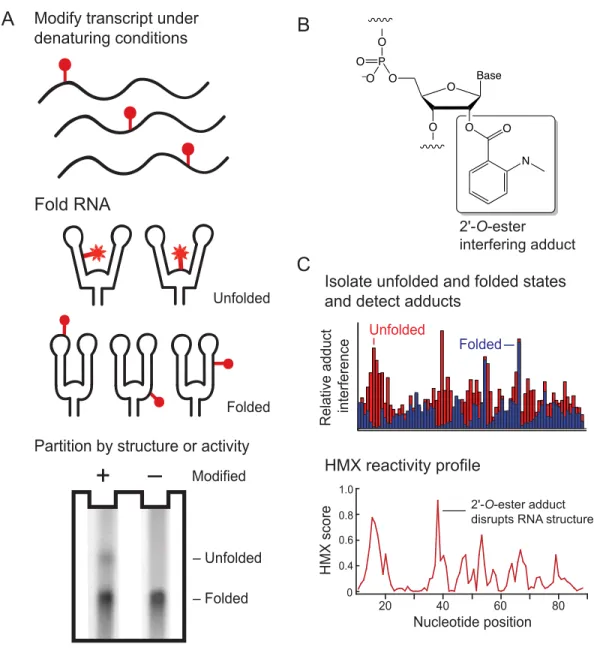
Figure 2.1 2'-Hydroxyl molecular interference (HMX). (A) RNA is modified under denatured conditions such that all nucleotides have a significant probability of being modified. Some 2'-hydroxyl adducts prevent native folding, creating a population of unfolded RNA that can be partitioned from fully folded RNA. In this work, partitioning was performed by non-denaturing gel electrophoresis. (B) Structure of the 2'-O-ester adduct introduced by reacting RNA with NMIA. (C) Partitioned populations were separately subjected to primer extension to detect adducts. Positions with high intensities in the unfolded RNA have low intensities in the folded RNA and indicate positions of adducts that prevent folding. HMX
profiles were calculated using a cross-correlation analysis. ... 14
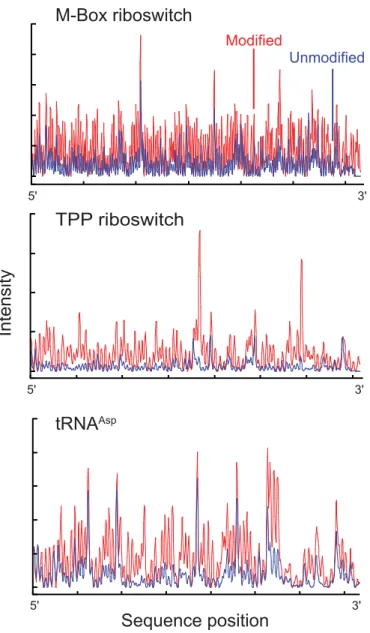
Figure 2.2 Electropherograms of 2'-O-ester modified and unmodified RNAs. Each RNA was modified with NMIA under denaturing conditions. Modifications were detected as stops to reverse transcriptase-mediated
primer extension... 15
Figure 2.3 Partitioning of RNA populations by native gel electrophoresis. (A) Folded and unfolded populations for modified and unmodified RNAs were separated by non-denaturing gel electrophoresis in the presence of 50 mM NaCl and 5 mM MgCl2. For clarity, gel images were straightened
and scaled to show similar representations for each RNA; band profiles and intensities were not altered. (B) Band intensities as a function of gel
migration distance... 17
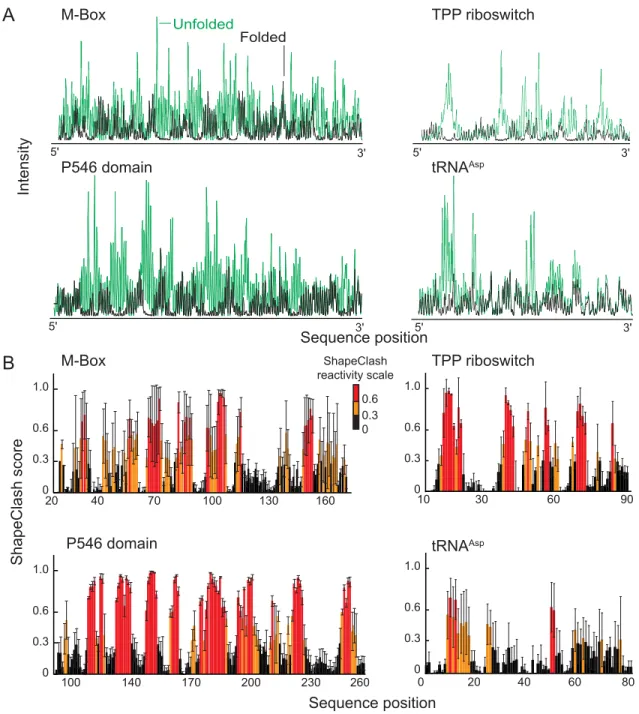
Figure 2.4 Calculation RNA HMX scores by normalization and cross-correlation. (A) Electropherograms of unfolded RNA (green) scaled to data for folded RNA populations (black). Positions with high intensities in the unfolded RNA have low intensities in the folded RNA. (B) Cross-correlation normalization, based on both unfolded and folded 2'-O-adduct profiles, was used to create HMX score profiles. Positions with low, medium, and high HMX scores are black, orange, and red, respectively. Experiments were performed in triplicate and error bars are shown with
black lines. ... 19
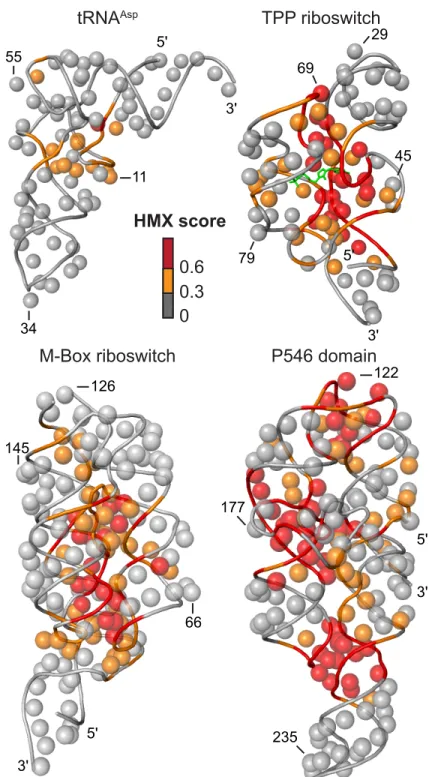
Figure 2.5 Visualization of HMX interference information on accepted three-dimensional structures.15-18 The 2'-OH group for each nucleotide is
shown as a sphere and the phosphate backbone by a tube. Nucleotides are
colored by HMX score; the TPP ligand is green. ... 20
were estimated by calculating van der Waals radii overlaps. (B) Analysis of optimal pseudo-atom bond length and atomic radius. Maximum correlation between Pearson's r and pseudo-atom representing 2'-hydroxyl molecular interference is boxed. (C) Relationship between pseudo-atom dimensions and 2'-O-ester adduct. (D) Representative relationships between HMX scores and molecular overlap for the M-Box and P546 domain RNAs. HMX score profiles (red) show a high correlation with calculated molecular overlaps (black) for each RNA. Pearson correlation coefficients are shown. Correlation coefficients for the tRNAAsp and TPP riboswitch RNAs (not shown) were 0.60 and 0.72,
respectively. ... 22
Figure 2.7 HMX-directed RNA fold refinements. RNAare shown as backbone traces. Accepted structures15-18 and HMX-directed refinements for each RNA are gray and blue, respectively. The cluster populations (n), mean RMSD, and p-values25 are shown. For tRNAAsp, both the
largest cluster (large image) and lowest RMSD structures (inset) are
shown. ... 25
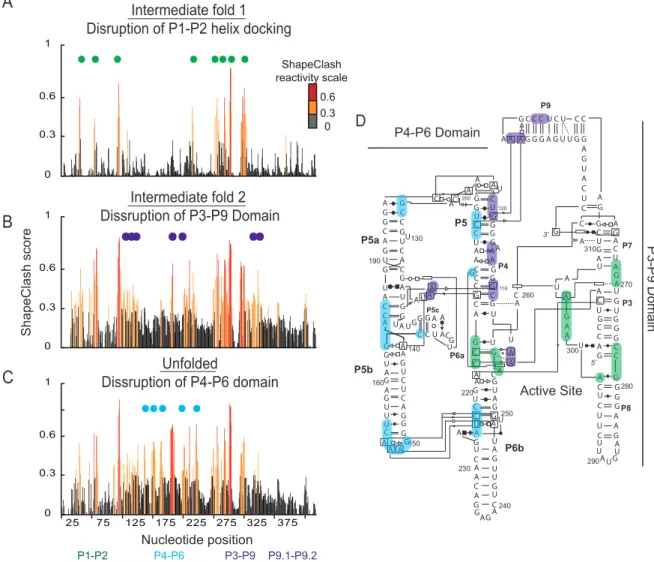
Figure 3.1 Identification of multiple domains with in the group I intron by ShapClash. (A) Folded and unfolded along with intermediate fold populations for modified and unmodified RNA were separated on a 0.5x TB polyacrylamide gel containing 50 mM NaCl and 5 mM MgCl2. For
clarity, gel images were straightened and scaled to provide similar representations for each RNA. (B) Band intensities were measured for each lane. The intensity of the unfolded and intermediate bands was larger in the modified sample compared to the unmodified sample for each RNA. (C) Correlation between HMX data and calculated sphere overlap related to RNA structure. Cross correlation normalized HMX score profiles (red) show strong correlation when compared to calculated sphere overlap (black) for the group I intron. Sections of the RNA that are not present in the crystal structure are shown as gas in the calculated
sphere overlap trace. ... 40
Figure 3.2 Analysis of intermediate structures in Group I intron. HMX score profiles were created for the (A) first and (B) second intermediate bands as well as for the (C) unfolded band. Positions with low reactivity below 0.3 are colored in black; positions of medium reactivity (between 0.3 and 0.6) are colored in orange; and positions of high reactivity (greater than 0.6) are colored in red. Reactive positions in the first intermediate profile are marked by green circles and. Positions that become reactive in the second intermediate and unfolded profile are marked in purple and blue respectively. (D) Highlighted positions on the HMX profiles are superimposed on the secondary structure representation of the crystal
Figure 4.1 Single-molecule RNA structure analysis by massively parallel sequencing. (A) RNA molecules experience local structural variations and ‘breathing’ in which regions of an RNA structure become reactive to a chemical probe in a correlated way. Nucleotides that interact (open red circles) show correlated reactivity. Statistical association analysis is used to detect and quantify the strengths of these interdependencies, ultimately revealing multi-point RNA interaction groups or RINGs. (B) In solution, RNAs often adopt multiple conformations. Spectral clustering analysis based on similarity of nucleotide reactivity patterns was used to separate
data on individual RNA stands into different conformations. ... 52
Figure 4.2 Efficient DMS adduct formation at the base-pairing faces of adenosine and cytosine. (A) Reaction of radioactively labeled nucleotides with 170 mM DMS in 300 mM cacodylate (pH 7) monitored by gel electrophoresis. (B) Time-course of DMS reaction with adenosine and cytosine. Unconstrained nucleotides react to form methyl adducts with
~12% efficiency (arrow). ... 54
Figure 4.3 Optimization of DMS adduct formation. The pH of the DMS reaction (blue lines) and adduct formation with adenosine (red) were monitored as a function of time. The DMS concentration was 170 mM. (A) In 100 mM HEPES (pH 8.0), pH dropped over time, quenching the DMS reaction. These conditions closely resemble those widely employed in conventional DMS experiments. (B) Reactions performed in 300 mM HEPES (pH 8.0) limited the pH drop; however, the organic buffer reacted directly with DMS, quenching the reaction with adenosine. (C) The pH in reactions performed in 300 mM cacodylate was
well-controlled, and the buffer did not react with DMS to quench the reaction... 55
Figure 4.4 RING analysis of RNA structure. (A) Number of mutations per transcript detected by reverse transcription with (red) and without (black) DMS modification. (B) DMS modification induced mutation frequencies as a function of nucleotide position. Data from DMS-treated samples are shown in red and no-reagent controls are shown in black. (C) RINGs for the TPP riboswitch, P546 domain, and RNase P RNAs showing strong (green) and moderate (yellow) correlations. Correlations occur between positions that are reactive in the native structure (filled red circles) or become reactive during 'breathing' motions (open circles), reflecting the structural breathing component of reactivity interdependencies. Correlation coefficients of 0.025 and 0.035 correspond to median increases in correlated mutations of 2.5- and 2.8-fold, respectively (Fig. 4.12C). Secondary structures are drawn to approximate relative helical
RINGs in the P546 domain folded in the presence of Mg2+. (B) RINGs in the P546 domain folded in the absence of Mg2+. (C) RINGs in the P6a mutant. (D) RINGs in the J5 hinge mutant. For clarity, panel A is
identical to Figure 4.4C... 60
Figure 4.6 RINGs and clustering analysis of the TPP riboswitch in the presence and absence of TPP ligand. RING analysis in the presence of (A) saturating ligand and (B) absence of ligand. Strong and moderate internucleotide associations are shown with green and yellow lines, respectively. Nucleotides that are less or more structured in the minor, less populated, cluster are emphasized with open and closed spheres, respectively. Spectral clustering analysis in the (C) presence of saturating ligand and (D) absence of ligand. There are two clusters in each state. In the presence of saturating ligand, the major cluster (red) corresponds to the fully folded riboswitch. In the absence of ligand, the major cluster (red) reflects an unstructured state with few internucleotide interactions. The minor cluster (blue) in the saturating ligand sample is more unstructured than the major cluster and is similar to the no-ligand structure (gray). The minor cluster (blue) in the no-ligand sample is more highly structured than the major cluster specifically in the region of the
thiamine binding pocket (blue closed circles). ... 64
Figure 4.7 Spectral clustering analysis of the TPP riboswitch at sub-saturating ligand concentration of 200 nM ligand. (A) RING analysis of internucleotide association interactions. Interactions are fewer in number and weaker than those for the RNA under saturating ligand conditions (compare with Fig. 4.6A). (B) Three clusters were identified with population fractions of 32, 31, and 37% (blue). Each of these clusters corresponds to a state identified in either saturating ligand concentration or in the absence of ligand (red) with nucleotides corresponding to the
ligand bound or no ligand structures (gray)... 66
Figure 4.8 Clustering analysis of the RNase P domain RNA in the presence and absence of Mg2+. (A) RING analysis of the RNA structure in the presence of Mg2+. (B) RING analysis in the absence of Mg2+. (C) Separation of the plus- Mg2+ data into two clusters. The minor cluster (blue) is characterized by a subset of nucleotides (blue circles) that are more reactive (and thus less structured) than those in the major cluster structure. Positions more reactive in the minor cluster mediate the L5-L15.1 loop-loop tertiary interaction and form the structural core. In most regions, the no- Mg2+ state has a RING pattern that is structurally distinct
from both of the plus- Mg2+ states. In contrast, the P19 element shows the same RING pattern as was observed in the presence of Mg2+ suggesting
that this region folds independently and is not stabilized by Mg2+... 68
illustrated on both secondary structures (top) and three-dimensional models9-11 (bottom). (B) Three-dimensional models determined for each RNA using RING interdependencies as constraints. The p-values report the significance of each model; the secondary structure was input during
refinement19... 70
Figure 4.10 Long-range constraints for using RING interdependencies to refine three-dimensional RNA structure models. (A) Distribution of distances corresponding to nucleotide associations with correlation coefficients greater than 0.025. (B) Histogram summed over all observations. Smooth curve corresponds to the normal distribution based on the average and standard deviation. (C) Interaction potential for RING-based distance constraints. (D) Radius of gyration based filtering of structure models. Representative histograms of radii of gyration for models of the P546 domain RNA generated during unbiased simulations (blue) or simulations biased by RING data (red). The fit log-normal distribution for the bias-dependent collapsed state is shown with a dashed
line... 73
Figure 4.11 Comparison of the RING-directed three-dimensional model for the RNase P RNA with that based on the crystallographically visualized structure11. The core accepted structure (right) excludes helices P3-P2-P19 which folds independently (see Fig. 4.4). The p-values report the
significance19 of each model relative to the accepted structure. ... 74
Figure 4.12 Visualization of internucleotide associations in the presence and absence of ligand for the TPP riboswitch RNA. (A, B) Heat map showing positive statistically significant (χ2 > 20) nucleotide associations for the
TPP riboswitch in (A) the presence and the (B) absence of the ligand. (C) Illustration of relationship between correlation coefficient and the effect that mutation of one nucleotide has on the probability of mutation of the other nucleotide in the pair. Such an effect is measured as a ratio of conditional probabilities [Rp = P(A = 1 | B = 1) / P(A = 1 | B = 0)], and it is plotted
for statistically significant (χ2 > 20) positive associations as a function of correlation coefficient. In the RING analysis, we focused on nucleotide pairs with correlation coefficients greater than 0.025, corresponding to a
median ratio of conditional mutation probabilities, Rp, greater than 2.50. ... 80 Figure 4.13 Spectral clustering of RING-MaP data obtained from analysis of
happened to be present within the either set were deliberately destroyed by randomly shuffling the recorded instances of nucleotide modifications among the reads. Such shuffling, performed independently for every nucleotide in each set, preserved the total number of modifications to a given nucleotide in a given set, but made co-occurrences of modifications among nucleotides statistically random. Thus, this data sample has only two conformations, present at 50:50 ratio. This synthetic data sample is representative of data collected in single experiments, since nucleotide modifications occur on each strand independently of other strands in the RNA pool. (C) Eigenvalues of the normalized graph Laplacian matrix,
LNCut, of the similarity matrix, S, constructed for the 43 reactive adenosine and cytosine nucleotides of the synthetic TPP RNA data sample. The first eigenvalue, λ1, is always zero, whereas the magnitudes of successive eigenvalues reflect inversely the effectiveness of each successive normalized graph cut. If the data points form two distinct clusters, the first graph cut will be most effective, cutting the links between the points lying in different clusters, thus cleanly separating the
clusters. Indeed, in the plot the largest difference between successive ... 84
Figure 4.14 Examples of eigengap plots containing either three (top row) or four (two bottom rows) clusters in varying proportions. These plots were generated using artificial datasets, derived from a hypothetical RNA containing 50 adenosine and cytosine nucleotides with varied frequencies of modification comparable to those observed in real RNAs. For each cluster of reads, nucleotides were assigned their modification
probabilities at random. ... 86
Figure 4.15 Determination of the conformational identity of individual RNA strands. (A) The second eigenvector,, of the synthetic data set created for the TPP riboswitch as described in Fig. 4.13, was chosen because the second eigengap indicates that these data are split into two clusters (see Fig. 4.13D). This eigenvector has 43 values, corresponding to 43 adenosine and cytosine nucleotides with high modification rates. For each nucleotide, the eigenvector magnitude specifies how strongly that nucleotide is associated with either of the two detected clusters. (B) Distribution of the scores for all strands computed from the second eigenvector. The strands that belong to one cluster are on the left side of the score distribution, whereas the strands that belong to the second cluster are on the right side of the distribution. The classification boundary was determined using K-means clustering; red and blue arrows indicate centroids of each cluster. The ratio of strands in the two clusters is 52:48, which is in good agreement with the true ratio of 50:50 for synthetic dataset. (C) Estimated relative fractions of the ligand-bound and unstructured conformations plotted as a function of their true relative fractions. The plot was generated by performing spectral and K-means clustering on eight different synthetic datasets with different proportions
Figure 4.16 Reconstruction of mutation probability profiles of individual conformations for data samples containing two conformations each. The two conformations were represented by sequencing reads obtained after modification of the TPP riboswitch RNA in the presence of saturating TPP ligand (ligand-bound conformation) or in the absence of TPP ligand (unstructured conformation), respectively. Any conformational variations within the either set were intentionally destroyed, by randomly shuffling the recorded instances of nucleotide modifications among the reads (see Fig. 4.13, legend). To make data samples, the ligand-bound and unconstrained sets of reads were combined at 50:50, 20:80 or 80:20 ratios. (A) The true mutation probability profile (blue) and the profile estimated from spectral and K-means clustering (red) for the ligand-bound conformation making up 50% of the data sample. (B) The true and estimated mutation probability profiles for the unstructured conformation making up 50% of the data sample. (C) The true and estimated mutation probability profiles for the ligandbound conformation making up 20% of the data sample. (D) The true and estimated mutation probability profiles for the unconstrained conformation making up 20% of the data sample. The 80% fractions are not shown because the true and estimated profiles
are nearly identical (as expected)... 90
Figure 4.17 Increasing phred score for counting mutations eliminates base call errors from sequencer. (A) Reactivity plot of DMS modified RNA (Red) and no modification control (Black) with the phred score set at 10 produces increased average mutation rate at 5' end. (B) RING of DMS modified RNA processed with phred score of 20. High mutation rate due to insturment error causes spurious correlations unrealted to RNA structure. (C) Increasing phred score to 20 for counding mutations produces reactivity profile with decreased average mutation rate at 5' end of trace. (D) RING network of same DMS modified sample with increased phred score eliminates spurious correlations. RINGs now
accuratly represent structural interactions in RNA. ... 96
LIST OF ABBREVIATIONS
2-ME 2-Mercaptoethanol 2'-OH 2ʹ-hydroxyl
A adenine
ATP Adenosine triphosphate
Asp aspartate
C cytosine
cDNA complementary deoxyribonucleic acid
Ci curie
CTP cytosine triphosphate CPM counts per minute
DMD discrete molecular dynamics DMS dimethyl sulfate
DMSO dimethylsulfoxide DNA deoxyribonucleic acid
dNTP deoxyribonucleotide triphosphate DTT dithiotreitol
EDTA ethylenediaminetetraacetic†acid FASTQ sequence file format
G guanosine
H hour
H2O water
HIV human immunodeficiency virus HMX 2'-hydroxyl molecular interference HRP hydroxyl radical probing
Hrs hours
M molar
Mg2+ magnesium ion MgCl2 magnesium chloride
Min minute
mM millimolar mRNA messenger RNA
µg microgram
µL microliter
µM micromolar
NAIM nucleotide analog interference mapping NaCl sodium chloride
NMIA N‐methyl isatoic anhydride
NMR nuclear magnetic resonance
nt nucleotide
NTP nucleoside triphosphate
32P phosphorus-32
pH potential of hydrogen Pmol picomol
PNK PNK
RING-Map RNA interaction groups identified by mutational profiling RMSD root mean square deviation
RNA ribonucleic acid RNase ribonuclease
RSA relative solvent accessibility RT Reverse Transcriptase
Sec second
SHAPE selective 2'‐hydroxyl acylation analyzed by primer extension
TBE 90 mM Tris‐borate, 2 mM EDTA
TE 10 mM Tris (pH 7.5), 1 mM EDTA Tris tris(hydroxymethyl)aminomethane TPP thiamine pyrophosphate
tRNA transfer RNA tRNAasp aspartate-tRNA
TTP Thymidine triphophate
U uridine
UTP uridine triphosphate
V volt
W watt
LIST OF SYMBOLS
≈ approximately
Å angstrom
°C degree Celsius
D diagonal matrix
H hit matrix
Kd dissociation constant
LNCut Laplacian matrix
ρ phi coefficient
r pearson coeeficent
Rp ratio of conditional mutation probabilities
S similarity matrix
n nucleotide
χYates Yates’ corrected version of Pearson’s chi-squared test
CHAPTER 1. INTRODUCTION 1.1. INTRODUCTION
1.1.1. RNA structure and function
RNA serves dual roles as both an integral carrier of genetic information at the
primary nucleotide sequence level and, through the formation of higher-order structures, can serve as an important bimolecular machine that is involved in almost every biological process in the cell.1 For example RNA can participate protein translation, mRNA splicing and regulation of gene expression.2-4 Critical to the function of these RNA is its ability to fold back on itself and form complex three dimensional structures.5 RNA three dimensional
structures can vary both in their complexity and size, ranging from small tRNAs to large ribosomal RNAs.6-8 Determining the structure of an RNA is key to a greater understanding of its function.1,5
Many functional RNAs form multiple stable conformations with different biological activities; it is often the ability to transition between these stable conformations that leads to the biological activity of the RNA.4,9 The structural diversity of a single RNA thus poses an additional challenge when experimentally determining an RNA structure. Current
studies.
1.1.2. Probing RNA structure
Various methods are currently used to probe and understand RNA structures. An important first step towards understanding the function of an RNA is determination of the base-pairing partners involved in the RNA secondary structure. This problem has largely been solved through the use of small molecules that react with specific RNA functional groups. Traditional RNA chemical probing uses reagents that probe RNA by modifying nucleotides in a base specific manner and so require the use of complementary reagents to comprehensively probe RNA structure.10-12 The relatively recent development of Selective 2'-Hydroyl Acylation analyzed by Primer Extension (SHAPE) chemistry allows all nucleotides in an RNA to be probed in a single experiment through the use of reagents that target the 2'-OH on the ribose sugar.13,14 SHAPE has been used to probe the secondary structure of a wide
range of RNA from small tRNA15 to the entire HIV genome.16 Through the development of a suite of reagents SHAPE has also been used to measure RNA dynamics and give insight into the tertiary structure of an RNA.17-20 While SHAPE reagents are sensitive to both secondary and tertiary interactions, it is difficult to deconvolute the influence of either type of
interaction.
However, the usefulness of crystallographic approaches to studying RNA is limited because large RNAs can be difficult to crystallize and little information regarding structural dynamics is provided.8 NMR spectroscopy can also produce high resolution structures of RNA and has
been most widely used to measure local nucleotide dynamics.21,22 However, NMR spectroscopy is also limited by the size and complexity of the RNA.
RNA tertiary interactions can also be interrogated using biochemical approaches. Two useful methods, nucleotide modification interference and analog interference, can identify nucleotides involved in RNA tertiary interactions. In modification interference, an RNA is first treated with reagents that generate chemical modifications on the RNA. The RNA is then subjected to a partitioning experiment to distinguish functional from non-functional molecules. Nucleotides that are absent in the non-functional RNA identify regions that are involved in the desired RNA function.23 Comprehensive analysis of specific functional groups in RNA can also be achieved by Nucleotide Analog Interference Mapping
(NAIM).24,25 NAIM generically incorporates nucleotide analogs into an RNA transcript to identify the effect of individual functional groups on RNA interactions. The key step
involved in both these approaches is selection of active RNAs from those that are inactivated due to the modification or nucleotide analog. Both modification interference and NAIM require the use of complementary reagents or nucleotide analogs to interrogate every nucleotide in an RNA. However these can identify single nucleotide or single atom interactions in an RNA.23-25
In order to more directly probe specific interactions in RNA, functionalized
chromophores at various sites in an RNA, which allow for single molecule measurements of through-space interactions between nucleotides in an RNA.26 Tethered cleaving reagents such as Fe(II)‐EDTA2‐, which cleave the phosphate backbone of surrounding nucleotides can
also be used to determine through-space interactions of RNA nucleotides.27 While these techniques have been widely used to interrogate RNA tertiary structure, a major limitation is that they require the synthesis of non-native RNA and the addition of bulky functional groups that can alter native RNA folding.
RNA tertiary structure can be more generically mapped through the use of
biochemical reagents, which probe native RNA in solution. Current methods are primarily based on the measurement of nucleotide solvent accessibility, measured through the cleavage of the RNA backbone by hydroxyl radicals generated by Fe[II]‐EDTA2‐ free in solution.28,29
Unfortunately, data from hydroxyl radical probing (HRP) experiments can be technically challenging to interpret and the absolute correlation between hydroxyl radical reactivity and solvent accessibility remains imperfect.
The development of reliable, high-throughput techniques that map RNA tertiary structure is still an important goal in understanding RNA function. Currently, structurally chemical probes that are sensitive to RNA structure provide the most versatile platform to measure the tertiary structure of RNA.
1.1.3. Detection of RNA adducts
proportions correspond to degree of modification. The cDNA fragments are then separated and analyzed by denaturing polyacrylamide gel or capillary electrophoresis.11,12
Recent advances in enzymatic adduct detection have made traditional biochemical probing techniques amenable to next-generation massively parallel sequencing.30 With this approach, RNA adducts are detected not as stops but as mutations induced during read-through of the reverse transcriptase. Thus, every position in an RNA transcript can be sequenced, and adduct formation measured by rate of induced mutations. This technique has been used with SHAPE adducts to probe the secondary structure of a wide range of RNAs from small riboswitches to the entire HIV genome. While this approach vastly expands the number and type of experiments possible for studying RNA structure, it is currently limited to providing only secondary structure information.
1.1.4. DMD Modeling with biochemical constraints
An important application of experimentally-derived tertiary information is its use in conjunction with molecular modeling. Through the use of discrete molecular dynamics (DMD), a small number of constraints, reflective of through-space RNA structure, can be sufficient to produce high-quality structure models.31,32 This approach allows for the
determination of three-dimensional structures of a wide rage of RNAs not amenable to high-resolution methods. Through the application of HRP data, this approach has been used to produce a number of native-like structures for a variety of RNA.33,34 While the current DMD algorithm is tolerant of the noise intrinsic to HRP experiments, it is clear that the quality of the derived structures is directly related to the quality of the experimental data.
1.2. RESEARCH OVERVIEW
methods that characterize tertiary interactions in RNA of varying sizes and complexity. My focus was to adapt existing chemical probes with alternative processing and detection methods in order to develop new chemical methods that reflect tertiary structures in RNA.
In Chapter 2 I develop a combined biochemical and computational approach for creating high-quality models of RNA tertiary structure. This technique, called HMX,
identifies nucleotides in structurally crowded regions of an RNA by exploiting the ability of a bulky adduct at the 2'-hydroxyl position to disrupt the overall RNA structure. These data are then incorporated as experimental constraints in discrete molecular dynamics (DMD) simulations to obtain experimentally informed, three-dimensional models.
In Chapter 3 I present a HMX analysis of the Tetrahymena group I intron in which I identify the presence of two stable substructures as well as the tertiary interactions involved in the folding of these separate structures. This analysis allows for the characterization of interactions involved in the docking of the 5' splice, between the P3-P9 and P4-P6 domain, as well as within the independently folded P4-P6 domain. This analysis provides a unique view of RNA structure and serves as guide for future HMX analyses of large RNA
In Chapter 4 I describe a chemical probing technique, which takes advantage of multi-nucleotide sequencing that can be used to detect multiple modifications in a single read. Through the use of massively parallel sequencing, statistical association analysis and spectral clustering, I identify correlated chemical modifications in individual RNA
1.3. PERSPECTIVE
In this work I use the principles of molecular biology, biochemistry, organic chemistry and physical chemistry to address the problem of accurate RNA structure determination, which can be used for a wide range of RNAs. Through the use of existing biochemical reagents I was able to modify the sample processing and detection of such adducts in order to measure through-space tertiary interactions in RNA. By melding this data with DMD simulations I have created techniques that can be used to predict accurate
structural models, which were not yet possible for a wide range of RNA. These techniques also give a unique view of RNA structure that can be used to measure complex dynamics and interactions in RNA.
It is my hope that each of the methods I have developed will be applied to understanding structure-function relationships of RNAs in general, and specifically to predicting the tertiary structures of novel RNAs. I expect that these methods will lend
1.4. REFERENCES
(1) Sharp, P. A. (2009) The centrality of RNA. Cell 136, 577–580.
(2) Korostelev, A., and Noller, H. F. (2007) The ribosome in focus: new structures bring new insights. Trends Biochem. Sci. 32, 434–441.
(3) Strobel, S. A., and Cochrane, J. C. (2007) RNA catalysis: ribozymes, ribosomes, and riboswitches. Curr. Opin. Chem. Biol. 11, 636–643.
(4) Montange, R. K., and Batey, R. T. (2008) Riboswitches: emerging themes in RNA structure and function. Annu. Rev. Biophys. 37, 117–133.
(5) Leontis, N. B., Lescoute, A., and Westhof, E. (2006) The building blocks and motifs of RNA architecture. Curr. Opin. Struct. Biol. 16, 279–287.
(6) Rich, A., and RajBhandary, U. L. (1976) Transfer RNA: molecular structure, sequence, and properties. Annu. Rev. Biochem. 45, 805–860.
(7) Reiter, N. J., Chan, C. W., and Mondragón, A. (2011) Emerging structural themes in large RNA molecules. Curr. Opin. Chem. Biol. 21, 319–326.
(8) Holbrook, S. R. (2008) Structural principles from large RNAs. Annu. Rev. Biophys. 37, 445–464.
(9) Dethoff, E. A., Chugh, J., Mustoe, A. M., and Al-Hashimi, H. M. (2012) Functional complexity and regulation through RNA dynamics. Nature 482, 322–330.
(10) Peattie, D. A., and Gilbert, W. (1980) Chemical probes for higher-order structure in RNA. PNAS 77, 4679–4682.
(11) Ehresmann, C., Baudin, F., Mougel, M., Romby, P., Ebel, J.-P., and Ehresmann, B. (1987) Probing the structure of RNAs in solution. Nucleic Acid Res. 15, 9109–9128. (12) Stern, B., Moazed, D., and Noller, H. F. (1988) Structural analysis of RNA using chemical and enzymatic probing monitored by primer extension. Methods Enzymol. 164, 481–489.
(13) Merino, E. J., Wilkinson, K. A., Coughlan, J. L., and Weeks, K. M. (2005) RNA structure analysis at single nucleotide resolution by selective 2'-hydroxyl acylation and primer extension (SHAPE). J. Am. Chem. Soc. 127, 4223–4231.
(15) Wilkinson, K. A., Merino, E. J., and Weeks, K. M. (2005) RNA SHAPE chemistry reveals nonhierarchical interactions dominate equilibrium structural transitions in tRNAAsp transcripts. J. Am. Chem. Soc. 127, 4659–4667.
(16) Watts, J. M., Dang, K. K., Gorelick, R. J., Leonard, C. W., Bess, J. W., Jr, Swanstrom, R., Burch, C. L., and Weeks, K. M. (2009) Architecture and secondary structure of an entire HIV-1 RNA genome. Nature 460, 711–716.
(17) Gherghe, C. M., Mortimer, S. A., Krahn, J. M., Thompson, N. L., and Weeks, K. M. (2008) Slow conformational dynamics at C2'-endo nucleotides in RNA. J. Am. Chem. Soc. 130, 8884–8885.
(18) Mortimer, S. A., and Weeks, K. M. (2009) C2'-endo nucleotides as molecular timers suggested by the folding of an RNA domain. PNAS 106, 15622–15627.
(19) Mortimer, S. A., and Weeks, K. M. (2008) Time-resolved RNA SHAPE chemistry. J. Am. Chem. Soc. 130, 16178–16180.
(20) Steen, K.-A., Rice, G. M., and Weeks, K. M. (2012) Fingerprinting noncanonical and tertiary RNA structures by differential SHAPE reactivity. J. Am. Chem. Soc. 134, 13160– 13163.
(21) Rinnenthal, J., Buck, J., Ferner, J., Wacker, A., FÜrtig, B., and Schwalbe, H. (2011) Mapping the landscape of RNA dynamics with NMR spectroscopy. Acc. Chem. Res. 44, 1292–1301.
(22) Latham, M. P., Brown, D. J., McCallum, S. A., and Pardi, A. (2005) NMR methods for studying the structure and dynamics of RNA. ChemBioChem 6, 1492–1505.
(23) Conway, L., and Wickens, M. (1989) Modification interference analysis of reactions using RNA substrates, in Methods Enzymol., pp 369–379. Academic Press. Inc.
(24) Strobel, S. A. (1999) A chemogenetic approach to RNA function/structure analysis. Curr. Opin. Struct. Biol. 9, 346–352.
(25) Ryder, S. P., and Strobel, S. A. (1999) Nucleotide Analog interference mapping. Methods 18, 38–50.
(26) Roy, R., Hohng, S., and Ha, T. (2008) A practical guide to single-molecule FRET. Nature Methods 5, 507–516.
(27) Weeks, K. M. (2010) Advances in RNA structure analysis by chemical probing. Current Opinion in Structural Biology 20, 295–304.
(29) Pastor, N., Weinstein, H., Jamison, E., and Brenowitz, M. (2000) A detailed
interpretation of OH radical footprints in a TBP-DNA complex reveals the role of dynamics in the mechanism of sequence-specific binding. J. Mol. Biol. 304, 55–68.
(30) N. A. Siegfried, et al. & K. M. Weeks, submitted (2014).
(31) Gherghe, C. M., Leonard, C. W., Ding, F., Dokholyan, N. V., and Weeks, K. M. (2009) Native-like RNA tertiary structures using a sequence-encoded cleavage agent and refinement by discrete molecular dynamics. J. Am. Chem. Soc. 131, 2541–2546.
(32) Ding, F., Sharma, S., Chalasani, P., Demidov, V. V., Broude, N. E., and Dokholyan, N. V. (2008) Ab initio RNA folding by discrete molecular dynamics: from structure prediction to folding mechanisms. RNA 14, 1164–1173.
(33) Ding, F., Lavender, C. A., Weeks, K. M., and Dokholyan, N. V. (2012)
Three-dimensional RNA structure refinement by hydroxyl radical probing. Nat. Methods 9, 603– 608.
CHAPTER 2. RNA TERTIARY STRUCTURE ANALYSIS AND REFINEMENT BY 2'-HYDROXYL MOLECULAR INTERFERENCE*
2.1. INTRODUCTION
RNA plays diverse and central roles in the regulation of gene expression.1
Information is encoded in the RNA at several levels: the primary sequence, the precise base-pairing pattern that defines the secondary structure, and higher-order RNA structures composed of tightly packed secondary structure elements stabilized by a few key tertiary interactions.2 The precise formation of higher-order tertiary structures is critical to the
function of many RNAs.3,4 RNA secondary and tertiary interactions can be interrogated using chemical probing approaches that evaluate how a chemical adduct or substitution disrupts structure or that evaluate accessibility of particular functional groups in the RNA to a chemical reagent. In modification interference, an RNA is treated to introduce chemical modifications, usually in the nucleobase moieties, and then the RNA is subjected to a partitioning experiment to distinguish functional from non-functional molecules.5-7 Comprehensive analysis of specific functional groups in RNA can also be achieved by nucleotide analog interference mapping (NAIM).8,9 For NAIM, nucleotide analogs are
incorporated into an RNA transcript, and active RNAs are partitioned from those that are inactivated due to the nucleotide analog. Both modification interference and NAIM can interrogate most nucleotides in an RNA to identify single nucleotide or single atom interactions, respectively, critical to the tertiary structure.5,6,8,9 These approaches however, require multiple experiments to interrogate the tertiary environment of every nucleotide in
the RNA.
Chemical probes are also routinely used to examine both solvent accessibility and dynamics in the RNA backbone. The solvent accessibility of the RNA backbone can be monitored by hydroxyl radical footprinting (HRP).10,11 Reagents used in the selective 2'-hydroxyl acylation analyzed by primer extension (SHAPE) strategy are sensitive to the nucleophilicity of the 2'-OH group, which is dependent on the underlying flexibility of the nucleotide.12-14 Reactivities of these and other chemical probes, like DMS, CMCT and kethoxal, are inhibited by both secondary and tertiary structure interactions, and it is usually difficult to deconvolute the relative influence of each type of interaction.
Here, we describe a strategy in which 2'-hydroxyl-selective reagents are used in a modificationinterference experiment to simply and directly interrogate RNA tertiary structure. In this approach, which we call 2'-hydroxyl molecular interference or HMX, a hydroxyl-selective reagent is used to create a pool of RNAs with evenly distributed 2'-O -ester adducts. A structureselective pressure, such as RNA folding, is placed on the pool of modified RNA. A subset of 2'-O-ester groups will interfere with molecular interactions and prevent native RNA folding. By partitioning the sample into folded and unfolded states, nucleotides whose modification disrupts tertiary interactions are identified. This information is used to characterize the internal packing interactions that define higher-order RNA
2.2. RESULTS
2.2.1. HMX overview
In the first step of the HMX strategy, an RNA of interest was modified with a 2’-hydroxyl selective reagent under denaturing conditions such that all nucleotides were
modified in some RNAs in the population. Second, the RNA was allowed to fold; and, third, the RNA was subjected to a selection step to partition the RNA into active and inactive components (Fig. 2.1A). An experiment with an unmodified control was performed in parallel. The RNAs in this analysis were modified using N-methylisatoic anhydride
(NMIA),12 which modifies all positions in an RNA at 95 °C at low ion concentrations (Fig. 2.2). Reaction with NMIA yields a bulky ester adduct at the 2'-hydroxyl position in the RNA backbone (Fig. 2.1B). Some adducts will have no or small structural consequences, whereas other adducts will prevent proper folding of the RNA. In this work, we partitioned the natively folded from the unfolded structures based on mobility in a non-denaturing
acrylamide gel, although many other selection strategies are compatible with this approach. After partitioning, folded and unfolded populations were analyzed by reverse transcription-mediated primer extension to detect positions of the modified nucleotides. Adducts that disrupted folding were identified by comparing the profiles of the unfolded and folded RNA at each position (Fig. 2.1C). HMX scores for each nucleotide were calculated as the
Figure 2.1 2'-Hydroxyl molecular interference (HMX). (A) RNA is modified under denatured conditions such that all nucleotides have a significant probability of being
modified. Some 2'-hydroxyl adducts prevent native folding, creating a population of unfolded RNA that can be partitioned from fully folded RNA. In this work, partitioning was performed by non-denaturing gel electrophoresis. (B) Structure of the 2'-O-ester adduct introduced by reacting RNA with NMIA. (C) Partitioned populations were separately subjected to primer extension to detect adducts. Positions with high intensities in the unfolded RNA have low intensities in the folded RNA and indicate positions of adducts that prevent folding. HMX profiles were calculated using a cross-correlation analysis.
Modify transcript under denaturing conditions
Fold RNA
Folded Unfolded
A
Partition by structure or activity
Modified
+
– Folded – Unfolded
Nucleotide position
HMX score
2'-O-ester adduct disrupts RNA structure
0 0.4 0.6 0.8 1.0
20 40 60 80
HMX reactivity profile
Relative adduct interference
C
Isolate unfolded and folded states and detect adducts
Folded Unfolded
–
B
2'-O-ester interfering adduct
O O
N Base O
O O P O
O
Figure 2.2 Electropherograms of 2'-O-ester modified and unmodified RNAs. Each RNA was modified with NMIA under denaturing conditions. Modifications were detected as stops to reverse transcriptase-mediated primer extension.
TPP riboswitch
tRNAAsp
M-Box riboswitch
Modified
Unmodified
5'
Intensity
Sequence position 5'
5' 3'
We examined the HMX approach using structurally diverse RNAs for which high-resolution structures are available: yeast tRNAAsp (75 nts),15E. coli thiamine pyrophosphate (TPP) riboswitch (79 nts),16 the B. subtilis M-Box riboswitch (156 nucleotides),17 and the
Tetrahymena group I intron P546 domain (160 nts).18 After modification of the RNA with NMIA under denaturing conditions, RNAs were folded under conditions known to stabilize the native and functional tertiary structure of the RNA. The TPP and M-Box riboswitch RNAs were folded in the presence of saturating ligand concentrations.
Figure 2.3 Partitioning of RNA populations by native gel electrophoresis. (A) Folded and unfolded populations for modified and unmodified RNAs were separated by non-denaturing gel electrophoresis in the presence of 50 mM NaCl and 5 mM MgCl2. For clarity, gel images
were straightened and scaled to show similar representations for each RNA; band profiles and intensities were not altered. (B) Band intensities as a function of gel migration distance.
Intensity
Modified: A
B
TPP riboswitch
F U Folded
Unfolded
tRNAAsp
F U
+
_
F U
M-Box
+
_
F U
+ _
_
P546 domain
+
F U
Relative electrophoretic migration
F U
F U
After partitioning, adducts that prevent folding are over represented in the unfolded band and underrepresented in the folded band. Site of modification were identified in both populations by reverse transcription-mediated primer extension. The resulting data were normalized using a cross-correlation approach to create an HMX score that allowed
identification of nucleotides preferentially modified in the unfolded population relative to the folded population. The HMX score takes into account that 2'-O-adduct molecular
interference compares two structurally encoded data sets (unfolded and folded populations) partitioned from the same pool of modified RNA and that separation of the unfolded and folded populations is imperfect (Methods and Fig. 2.4). Positions with medium and high interference scores were visualized on the known15-18 three-dimensional structures of each of the RNAs (Fig. 2.5). Nucleotides with high HMX scores corresponded to nucleotides directly involved in tertiary interactions and to nucleotides within densely packed regions of the RNA. Because the 2'-O-ribose modification occurs in the RNA backbone and likely does not significantly destabilize helix formation,20 interfering positions corresponded almost
Figure 2.4 Calculation RNA HMX scores by normalization and cross-correlation. (A) Electropherograms of unfolded RNA (green) scaled to data for folded RNA populations (black). Positions with high intensities in the unfolded RNA have low intensities in the folded RNA. (B) Cross-correlation normalization, based on both unfolded and folded 2'-O -adduct profiles, was used to create HMX score profiles. Positions with low, medium, and high HMX scores are black, orange, and red, respectively. Experiments were performed in triplicate and error bars are shown with black lines.
B
0 0.3 0.6 1.0
100 140 170 200 230 260
Unfolded
Folded
ShapeClash score
Intensity
Sequence position
20 40 70 100 130 160
0 0.3 0.6 1.0
10 30 60 90
0 0.3 0.6 1.0
20 0
0.3 0.6 1.0
40 60 80
0
Sequence position
TPP riboswitch
tRNAAsp P546 domain
M-Box
A
TPP riboswitch
tRNAAsp P546 domain
M-Box
0.6 0.3 ShapeClash reactivity scale
0
5' 3'
5' 3'
5' 3'
Figure 2.5 Visualization of HMX interference information on accepted three-dimensional structures.15-18 The 2'-OH group for each nucleotide is shown as a sphere and the phosphate
backbone by a tube. Nucleotides are colored by HMX score; the TPP ligand is green. M-Box riboswitch
tRNAAsp
0.6 0.3
P546 domain
5'
3'
66 126
145
5'
3' 122
177
235
5'
3' 45 29
69
79 5'
3' 55
34
11
TPP riboswitch
2.2.2. Molecular overlap model for HMX intensities.
Because molecular interference appeared to be strongly correlated with RNA tertiary interactions, we sought to understand the molecular basis of this correlation. We first defined a pseudo-atom, representing 2'-O-ester adduct, described by two parameters: L, the distance of the pseudo-atom from the 2'-oxygen atom, and r, the radius of the pseudo-atom. We calculated the degree to which surrounding nucleotide atoms intersected the defined pseudo-atom shell, based on the van der Waals radii (Fig. 2.6A). The pseudo-pseudo-atom bond length and atomic radius were determined by searching over the two pseudo-atom parameters. Pearson correlation coefficients were calculated for ranges of L and r relative to the experimental interference score (Fig. 2.6B). The pseudo-atom parameters that best fit the experimental data for all RNAs were L of 2 Å and r of 5 Å. A pseudo-atom with these parameters tightly, and fully, encapsulates the NMIA adduct ester at a ribose ring (Fig. 2.6C). The correlations between the experimental interference scores and the molecular overlap calculations for each RNA are high (Fig. 2.6D), which suggests that the 2'-O-ester adduct disrupts RNA structure by sterically blocking RNA interactions in crowded regions of the RNA. For example, in the presence of ligand, nucleotides in the TPP riboswitch interact directly with ligand and other nucleotides form RNA-RNA contacts. The HMX experiment was sensitive to both types of interactions, indicating that HMX will be useful for examining intramolecular and
Figure 2.6 Physical model for 2'-hydroxyl molecular interference. (A) Model for interference by molecular overlap in which adducts are represented by a pseudo-atom (grey) at a distance (L) from the O2' position at radius (r). The degrees to which surrounding atoms intersect the pseudo-atom were estimated by calculating van der Waals radii overlaps. (B) Analysis of optimal pseudo-atom bond length and atomic radius. Maximum correlation between Pearson's r and pseudo-atom representing 2'-hydroxyl molecular interference is boxed. (C) Relationship between pseudo-atom dimensions and 2'-O-ester adduct. (D) Representative relationships between HMX scores and molecular overlap for the M-Box and P546 domain RNAs. HMX score profiles (red) show a high correlation with calculated molecular overlaps (black) for each RNA. Pearson correlation coefficients are shown. Correlation coefficients for the tRNAAsp and TPP riboswitch RNAs (not shown) were 0.60 and 0.72, respectively.
P r
L
Optimal pseudo-atom for
2'-hydroxyl molecular interference A
B
C
D
9
2 3 4 5 6 7 8
0.6
0.5
Distance from O2
' (
L
)
Pseudo-atom radius (r)
Correlation with HMX score
1 2 3 4 5 6 7 8
2'-OH
Molecular overlap Nucleotide
L = 2.0 Å r = 5.0 Å
r
HMX score
0 0.5 1.0 1.5
40 80 120 160
M-Box
correlation = 0.74
P546 domain
0 0.5 1.0 1.5
120 160 200 240
= 0.62
HMX score Molecular overlap
Sequence position
L
2.2.3. Three-dimensional RNA structure modeling.
The HMX strategy yields a physical measurement related to the extent of RNA tertiary structure packing at the site of an individual nucleotide. We therefore explored whether HMX scores could be used to refine three-dimensional models for RNA. Our labs have previously shown that HRP data, which are roughly related to solvent accessibility, used as structural constraints in discrete molecular dynamics simulations increased the quality of structural models21,22 relative to unconstrained simulations.23 Implementation of
the HRP-based potential is experimentally and computationally difficult, because HRP data are inherently noisy, especially for smaller RNAs with few solvent-protected nucleotides. We adapted the procedure previously developed for HRP-refined structures23,24 to develop three-dimensional models for tRNAAsp, the TPP and M-Box riboswitches, and the P546 domain based on HMX constraints. DMD simulations were performed using a simplified model in which each nucleotide was represented by three pseudo-atoms corresponding to the base, sugar, and phosphate groups.22 The energy function used to direct folding included terms for bonded and non-bonded interactions. Additional potential energy terms incorporated
information on relative solvent accessibility as estimated from HMX data. Structures obtained from simulations were clustered based on structural similarity to generate a representative model for each RNA.
The predicted structural models for each RNA were evaluated in terms of number and population of clusters as well as the calculated root-mean-square deviation (RMSD) from the accepted crystal structures. HMX-directed simulations produced structurally and statistically significant25 native-like RNA structure models for the TPP and M-Box riboswitches and for
cluster contained the structure with the lowest RMSD relative to the accepted structure. The HMX-directed simulations for tRNAAsp were less successful, and the most populated cluster had a poor RMSD relative to the accepted structure while the best RMSD structure was found in the lowest population cluster (Fig. 2.7 insert). This simulation itself revealed that no well-determined model emerged, as no single cluster included a majority of structures
consistent with the molecular interference information (Fig. 2.7 and Table 2.1).
Table 2.1 DMD simulation statistics for the four RNA fold refinements. Cluster populations (n), mean RMSDs, cluster energies, and p-values for each structure are shown.
Cluster
n
RMSD
(Å)Energy
M-Box 1 100 13.7 ± 1.3 -79.9 ± 2.0
P546 1
2
19.8 ± 1.2 24.2 ± 0.4
-78.5 ± 2.2 -70.6 ± 1.1 93
7
TPP 1
2
8.3 ± 1.0 11.6 ± 1.0
-38.1 ± 1.7 -38.6 ± 1.4 67
33
tRNAAsp 1 2 3 4 5 6 7 8 9 10
18.7 ± 1.3 14.1 ± 1.1 15.3 ± 0.9 15.4 ± 0.5 17.1 ± 1.3 12.5 ± 1.1 13.6 ± 0.9 15.9 ± 0.2 18.7 ± na 7.6 ± na
-35.0 ± 0.9 -34.8 ± 0.7 -35.1 ± 0.9 -34.9 ± 0.5 -34.6 ± 0.8 -34.4 ± 0.6 -34.8 ± 0.7 -35.6 ± 0.1 -35.3 ± na -34.8 ± na 43 13 12 9 8 6 5 2 1 1
RNA
p-value
<1 × 10⁻⁶
5.2 × 10⁻³ 4.6 × 10⁻¹
8.4 × 10⁻⁴ 3.7 × 10⁻²
Figure 2.7 HMX-directed RNA fold refinements. RNAare shown as backbone traces. Accepted structures15-18 and HMX-directed refinements for each RNA are gray and blue, respectively. The cluster populations (n), mean RMSD, and p-values25 are shown. For tRNAAsp, both the largest cluster (large image) and lowest RMSD structures (inset) are shown.
M-Box
P546 domain
13.7 ± 1.3
19.8. ± 1.2 8.3 ± 1.0 18.7 ± 1.3 7.6 ± na
TPP
riboswitch
Accepted
Modeled using HMX constraints
tRNA
Asp
n RMSD (Å) p-value
100
93 67 43 ( 1
< 1 × 10⁻⁶
2.3. DISCUSSION.
HMX measures the effect of introducing a molecular perturbation at the ribose 2'-OH position on RNA folding. Modifications at the 2'-ribose position, which lie on the exterior of an RNA duplex, generally do not substantially destabilize simple RNA secondary
structures20,26. Thus, the 2'-O-ester molecular interference measurement is exquisitely
sensitive to interactions that govern RNA tertiary folding. For the four RNA evaluated in this work – tRNAAsp, the TPP and M-Box riboswitch aptamer domains, and the P546 domain RNA – the interfering nucleotides identified by HMX correspond to those within the densely packed interior of these structures (Fig. 2.5). This relationship is highly quantitative.
Molecular interference by the 2'-O-ester group was highly correlated with a sphere of defined location relative to the RNA ribose group for each of the four RNAs analyzed (Fig. 2.6). We anticipate that 2'-O-ester mediated molecular interference will prove highly useful in
evaluating higher-order RNA packing in the context of large RNAs and RNA-protein complexes.
refinement yielded high-quality structures in agreement with known RNA structures. The molecular dynamics refinement employed was based on a recently developed approach that allows solvent accessibility to be incorporated into the simulation as an energy restraint.23 In
general, use of molecular interference information resulted in final clustered structures that were better defined than those obtained with hydroxyl radical restraints (data not shown). For the TPP and M-Box riboswitches and the P546 domain, HMX-directed refinement yielded a single predominant cluster with a highly statistically significant agreement with the accepted structure (Fig. 2.7). tRNAAsp was poorly modeled, likely reflecting both our
inability to cleanly separate folded and unfolded states (Fig. 2.3) and the resulting low magnitude molecular interference data (Fig. 2.5, compare tRNA with other RNAs). Critically, the simulation itself clearly reported that this RNA was not a good target for refinement because ten distinct clusters were observed and no single cluster clearly dominated the simulation. The overall success of HMX-directed refinement (Fig. 2.7) suggests that de novo RNA structure refinement, based on easily obtained high-quality biochemical constraints, holds substantial promise for understanding structure-function interrelationships for RNA.
HMX analysis provides a generic approach for analysis of the internal tertiary structure architecture of functionally important RNAs. The information gained from this experiment provides a unique view of internal and closely packed RNA tertiary structure. Here RNAs were partitioned based on gel electrophoresis; however, techniques that separate functional from non-functional RNAs could be used, allowing HMX analysis to be
2.4. METHODS
2.4.1. RNA constructs.
DNA templates for yeast tRNAAsp, the E. coli TPP and B. subtilis M-Box
riboswitches, and the Tetrahymena group I intron P546 domain included 5' and 3' structure cassette flanking sequences13 and were generated by PCR. RNAs were transcribed in vitro [1 mL; 40 mM Tris (pH 8.0), 10 mM MgCl2, 10 mM dithiothreitol, 2 mM spermidine, 0.01%
(v/v) Triton X-100, 4% (w/v) poly(ethylene) glycol 8000, 2 mM each NTP, 50 µL PCR-generated template, 0.1 mg/mL T7 RNA polymerase; 37 °C; 4 h] and purified by denaturing polyacrylamide gel electrophoresis [8% polyacrylamide, 7 M urea, 29:1
acrylamide:bisacrylamide, 0.4 mm × 28.5 cm × 23 cm gel; 32 W, 1.5 h]. RNAs were excised from the gel, recovered by passive elution overnight at 4 °C, and precipitated with ethanol. The purified RNAs were resuspended in 50 µL TE and stored at -20 °C.
2.4.2. 5'-[32P] RNA radiolabeling.
Purified RNAs were dephosphorylated [300 µL; 50 mM Tris (pH 8.5), 0.1 mM EDTA, 10 µM RNA, 300 units SUPERase-In (Ambion), 200 units alkaline phosphatase (Roche); 50 °C; 1 h], subjected to phenol:chloroform:isoamyl alcohol extraction and ethanol precipitation, and resuspended in TE (storage at - 20 °C). The RNA was 5' -[32
P]-radiolabeled by treatment with T4 polynucleotide kinase [40 µL; 80 pmol dephosphorylated RNA, 70 mM Tris (pH 7.6), 10 mM MgCl2, 5 mM DTT, 2 µL T4 polynucleotide kinase
was resuspended in 5 mM Tris buffer such that 1 µL of resuspended RNA measured approximately 106 dpm of [32P].
2.4.3. RNA modification for molecular interference.
RNA (25-50 pmol) was denatured by heating to 90 °C for 2 min [32 µL; 30 pmol unlabeled RNA, 1.5 dpm 5'-[32P]-radiolabeled RNA, 100 mM HEPES (pH 8.0)]. The
denatured RNA was added to NMIA solution (1.2 µL, 0.4 M in DMSO) and allowed to react at 95 °C for 5 min. The modification process was repeated three times. After the third
modification, the sample was placed on ice. A no-modification control reaction was performed identically using 1.2 µL DMSO. Any water evaporated during the modification was replaced to bring the volume to 36 µL (TPP samples were brought to 32 µL). For experiments in which band populations were quantified and visualized, 100,000 dpm of 5'-[32P]-radiolabeled RNA was used per condition. Gels were visualized by phosphorimaging.
2.4.4. RNA folding and structural partitioning.
After the denatured RNA was modified, it was treated with 4 µL 10x folding buffer (100 mM MgCl2, 1 M NaCl), and incubated at 37 °C for 30 min. Folding of the TPP
riboswitch RNA was similar except that the RNA was incubated in folding buffer at 37 °C for 10 min, after which the TPP ligand (4 µL, 50 mM) was added and the sample was
incubated at 37 °C for 20 min. TPP ligand concentration was saturating (Kd = 50-200 nM27).
The 40 µL of folded RNA sample was immediately added to equal volume of an 80% glycerol solution containing bromophenol blue and xylene cyanol and resolved on a non-denaturing polyacrylamide gel [8% polyacrylamide, 19:1 acrylamide:bisacrylamide, 0.5× TB (45 mM Tris, 45 mM boric acid), 50 mM NaCl, 5 mM Mg2Cl; 0.4 mm × 28.5 cm × 23 cm
not increase above 37 °C. The anode and cathode buffer wells were periodically refreshed to maintain ion homostasis. Bands were visualized by exposing the gel to film (Kodak BioMax) for 1 hr. The film was used as a template to identify and guide excision of the unfolded and folded band from the gel. The samples were recovered by passive elution overnight at 4 °C and were purified by ethanol precipitation and resuspended in 10 µL water.
2.4.5. Reverse transcription and adduct detection.
The general procedure was outlined previously.13 DNA primers were 5'-end labeled
with VIC or NED fluorophores (Applied Biosystems). RNA extracted from native gel separation (10 µL) was added to a fluorescently labeled DNA primer (5' -VIC-labeled GAA CCG GAC CGA AGC CCG; 3 µL, 0.3 µM) and allowed to anneal at 65 °C for 6 min and then cooled on ice. Reverse transcription buffer [6 µL; 167 mM Tris (pH 8.3), 250 mM KCl, 10 mM MgCl2, 1.67 mM each dNTP] and Superscript III (1 µL, 200 units) were added, and
samples incubated at 45 °C for 2 min, 52 °C for 20 min, and 65 °C for 5 min. The reactions were quenched with 4 µL 50 mM EDTA. The cDNAs were recovered by ethanol
precipitation, washed twice with 70% ethanol, dried, and resuspended in 10 µL deionized formamide. Dideoxy sequencing ladders were produced using unlabeled, unmodified RNA by annealing a 5' -NED-labeled fluorescently labeled DNA primer (3 µL, 0.3 µM), and by adding 1 µL 2',3' -dideoxycytosine (10 mM) triphosphate before addition of Superscript III. cDNA fragments were separated by capillary electrophoresis using an Applied Biosystems 3130 DNA sequencing instrument. Capillary electrophoresis traces were analyzed using QuShape.28