Early impact of the Affordable Care Act on uptake of long-acting
reversible contraceptive methods
Lydia E. Pace, MD, MPH,
Division of Women’s Health, Department of Internal Medicine, Brigham and Women’s Hospital, 1620 Tremont Street, 3rd Floor, Boston, MA, 02120, Phone: 415-465-7223, Fax 617-525-7746 Stacie B. Dusetzina, PhD, and
Division of Pharmaceutical Outcomes and Policy, UNC Eshelman School of Pharmacy,
Department of Health Policy and Management, Gillings School of Global Public Health, University of North Carolina at Chapel Hill, 2203 Kerr Hall, CB# 7573, Chapel Hill, NC 27599, Phone: 919-962-5355
Nancy L. Keating, MD, MPH
Division of General Internal Medicine, Department of Internal Medicine, Brigham and Women’s Hospital, Department of Health Care Policy, Harvard Medical School, Boston, MA, Phone: 617-432-3093
Lydia E. Pace: [email protected]; Stacie B. Dusetzina: [email protected]; Nancy L. Keating: [email protected]
Abstract
Background—The Affordable Care Act (ACA) required most private insurance plans to cover contraceptive services without patient cost-sharing as of January 2013 for most plans. Whether the ACA’s mandate has impacted long-acting reversible contraceptives (LARC) use is unknown.
Objective—The aim of this article is to assess trends in LARC cost-sharing and uptake before and one year after implementation of the ACA’s contraceptive mandate.
Design—Retrospective cohort study using Truven Health MarketScan claims data from January 2010–December 2013.
Subjects—Women aged 18–45 with continuous insurance coverage with claims for oral contraceptive pills, patches, rings, injections, or LARC during 2010–2013 (N=3,794,793).
Measures—Descriptive statistics were used to assess trends in LARC cost-sharing and uptake from 2010 through 2013. Interrupted time series models were used to assess the association of time, ACA, and time following the ACA on LARC cost-sharing and initiation rates, adjusting for patient and plan characteristics.
Results—The proportion of claims with $0 cost-sharing for IUDs and implants, respectively, rose from 36.6% and 9.3% in 2010, to 87.6% and 80.5% in 2013. The ACA was associated with a significant increase in these proportions and in their rate of increase (level and slope change both P<.001). LARC uptake increased over time with no significant change in level of LARC use
post-HHS Public Access
Author manuscript
Med Care
. Author manuscript; available in PMC 2017 September 01.Published in final edited form as:
Med Care. 2016 September ; 54(9): 811–817. doi:10.1097/MLR.0000000000000551.
A
uthor Man
uscr
ipt
A
uthor Man
uscr
ipt
A
uthor Man
uscr
ipt
A
uthor Man
uscr
ACA implementation in January 2013 (P=0.44) and a slightly slower rate of growth post-ACA than previously (beta coefficient for trend: −0.004, p<0.001).
Conclusions—The ACA has significantly decreased LARC cost-sharing, but during its first year had not yet increased LARC initiation rates.
Background
Almost half of pregnancies in the United States are unintended,1 leading to serious health
consequences for women, children and communities2 and costing taxpayers an estimated
$21 billion dollars a year.3 In recognition of this significant public health and economic
issue, in 2011 the Institute of Medicine identified contraceptive care as a key preventive
health service for women.4 The Department of Health and Human Services subsequently
required that under the Affordable Care Act, non-grandfathered plans (i.e., those sold after March 2010 or older policies that have been modified since that time) cover the full range of FDA-approved contraceptive methods without patient cost-sharing beginning on or after August 1, 2012 or at the start of the next benefit year (January 2013 for most
privately-insured women).5, 6 Despite some variability across method types,6 evidence suggests that
the ACA’s mandate overall translated into substantial reductions in cost-sharing for women
in 2013.7, 8
Public health experts have hoped that eliminating contraceptive cost-sharing will promote increased and more effective use of prescription contraception, reducing unintended
pregnancies.9 Particular interest has focused on long-acting reversible contraceptive (LARC)
methods --intrauterine devices (IUDs) and implants—which are the most effective reversible
methods available.10 Increased use of these methods in varying populations has been
associated with lower rates of unplanned pregnancy.10–12 LARC methods have historically
been associated with high initiation costs for many U.S. women13 and LARC has been
underutilized in the U.S.,14 although rates of use have been steadily, albeit slowly,
increasing.15, 16, 25 Several studies have led to optimism that reduced cost-sharing will
further increase LARC use. For example, one study among mostly publicly insured women in St. Louis showed that eliminating cost-sharing for all contraceptive methods was
associated with increased patient choice of LARC methods.17 An analysis of insurance
claims demonstrated that lower levels of cost-sharing are associated with higher rates of
LARC use among privately-insured women across the U.S.18
The early impact of the ACA’s contraceptive mandate on LARC use is not yet known. We sought to examine trends in LARC use following implementation of the ACA in 2013 using insurance claims data for a large cohort of women with private employer-sponsored
insurance. We first examined changes in cost-sharing for LARC before and during 2013, the year following implementation of the ACA’s contraceptive mandate. We then examined monthly trends in LARC uptake and performed an interrupted time series analysis to identify whether implementation of the ACA’s contraceptive coverage mandate was associated with changes in prior levels of or trends in LARC use.
A
uthor Man
uscr
ipt
A
uthor Man
uscr
ipt
A
uthor Man
uscr
ipt
A
uthor Man
uscr
Methods
We used the Truven Health MarketScan Commercial Claims and Encounters database from January 1, 2010 – December 31, 2013. The MarketScan database represents over 50 million non-retired employees and their dependents enrolled in commercial health insurance plan products sponsored by over 100 large or medium sized U.S.-based employers. The data include monthly enrollment, inpatient and outpatient medical claims, outpatient prescription drug claims, and reimbursed amounts paid by the health plan and patient for services billed. The study protocol was considered exempt by the Harvard Medical School Institutional Review Board.
Subjects and Contraceptive Claims
In our cohort, we included women aged 18–45 with prescription drug or medical coverage who had a prescription or medical claim for a contraceptive pill, ring, patch, depot
medroxyprogesterone (DMPA) injection, or IUD or implant insertion during 2010–2013 and at least 12 months of continuous plan enrollment. We did not include claims for emergency contraception. Eligible women also had to have at least one contraceptive claim that fell after 6 months of continuous enrollment; this claim was identified as the “index” claim (N=3,638,644 women with prescription claims; N=501,024 with medical claims) although all of a woman’s contraceptive claims during the study period (before or after the “index” claim) were included in the analysis. From this cohort we excluded 150,540 women who filled more than one prescription claim for different short-acting products on the same day (although they could have multiple months’ supply of a method on a single claim), since we could not differentiate between administrative errors and multiple prescriptions. We also excluded 29,619 women for whom the sum of coinsurance and copayments were negative on any prescription or medical claim because we were concerned that these were errors. Some women had both a prescription and medical claim for an IUD, since these could represent a patient receiving the device from the pharmacy and subsequently having it placed by a provider, as required by some clinics. For these women, when the prescription and medical claims occurred within 42 days of each other (n=18,559 claims), we omitted the first claim; however, we excluded 9,692 prescription claims for IUDs and implants where there was no corresponding medical claim for insertion of the IUD or implant within 6 weeks. The final cohort included 3,794,793 unique patients and 40,593,279 contraceptive claims. Our cohort-building process is illustrated in Figure 1.
Key variables
Cost sharing for LARC—To estimate cost-sharing, we added the copayment, co-insurance, and deductible payments paid for a LARC prescription or procedure. We also performed a sensitivity analysis examining cost-sharing trends excluding deductibles. For IUDs and implants, we estimated out-of-pocket costs for a single IUD or implant placement; when a patient had both a prescription and medical claim for LARC within 42 days of each other, we totaled the cost-sharing for the prescription and medical claims (although only counted one of these claims for the purpose of assessing LARC rates). We did not include other costs associated with an office visit because non-contraceptive services might be
A
uthor Man
uscr
ipt
A
uthor Man
uscr
ipt
A
uthor Man
uscr
ipt
A
uthor Man
uscr
provided at the same time as contraception. Cost-sharing amounts are presented in 2013 dollars after adjusting for inflation based on the medical price index.
LARC initiation—To identify rates of initiation of IUDs and implants among contraceptive users, for each month from 2010–2013 we identified the number of patients in our cohort with at least 1 medical or prescription claim for contraception in that month. If a patient had a claim for an IUD or implant, we counted that patient as an IUD or implant initiator in that month. If they had claims for only non-LARC methods (categorized as branded oral, generic oral, injection, patch, or ring) in that month, we considered the patient as a non-LARC user (but someone who was potentially eligible for LARC) in that month.
Independent variables—We measured time by month for cost-related and utilization trends. Because for most plans the ACA mandate took effect on January 1, 2013 we counted that month as the intervention month and time after that point was considered the post-intervention period. We also conducted sensitivity analyses in which we counted April 2013
as the intervention month because of the likelihood of delayed awareness of the benefit,19 as
well as the possibility of delayed implementation by plans, since we noted that the proportion of LARC claims with $0 cost-sharing continued to increase throughout the first half of 2013..
Control variables—We documented each patient’s age group (18–25, 26–35, 36–45), geographic region, relationship of patient to the insured individual/employee (employee, spouse, dependent), and health plan type (comprehensive plan, exclusive provider organization or health maintenance organization, non-capitated or capitated/partially capitated point-of-service plan, preferred provider organization, consumer-driven health plan or high-deductible health plan, unknown).
Statistical analysis
Cost sharing—We described yearly trends in the proportion of contraceptive claims with $0 cost-sharing, and monthly trends in the proportion of LARC insertions that entailed $0 cost-sharing from 2010–2013. We used segmented regression analysis of an interrupted time series to estimate the impact of the ACA on changes in the level and trend of rates of $0
cost-sharing for LARC, adjusting for age, region, and plan type.2021 The key variables of
interest were time (month, reflecting trends in $0 cost-sharing by month from January 2010 – December 2013), ACA (reflecting a change in level of $0 cost-sharing after vs. before January 1, 2013), and time following the ACA (reflecting a change in the trend by month after the ACA - from January 2013 – December 2013). To account for repeated
contraceptive claims for patients over time we used generalized estimating equations with a
log link and Poisson distribution.22 We also conducted a sensitivity analysis in which we
examined cost-sharing excluding deductibles.
LARC initiation—We estimated monthly rates of LARC initiation in our cohort of contraceptive users by calculating the proportion of women initiating an IUD or implant in a given month among women with claims for any contraceptive (long-acting and shorter-acting methods) in that month. With the patient as the unit of analysis, we again used
A
uthor Man
uscr
ipt
A
uthor Man
uscr
ipt
A
uthor Man
uscr
ipt
A
uthor Man
uscr
segmented regression analysis of an interrupted time series with generalized estimating equations and a log link/Poisson distribution to estimate the impact of the ACA on changes in the level and trend in LARC use beginning in January 2013 while accounting for the underlying time trend. We included the same covariates and key variables as the model predicting $0 cost-sharing. In addition, because we noted what appeared to be seasonal variation in LARC uptake (with drops in the first quarter of each year), we added dummy
variables to adjust for quarter/season.23
Patients with short-acting contraceptive prescriptions providing more than one month’s supply who received a prescription during a previous month (or patients who received a DMPA injection, which lasts 3 months) would not be included in the denominator for a month in which they had drug on hand but did not have a claim. Thus, to assess the likelihood that this affected our findings, we conducted sensitivity analyses examining quarterly rather than monthly contraceptive trends. All analyses were conducted using SAS version 9.3 (SAS Institute, Carey NC).
Results
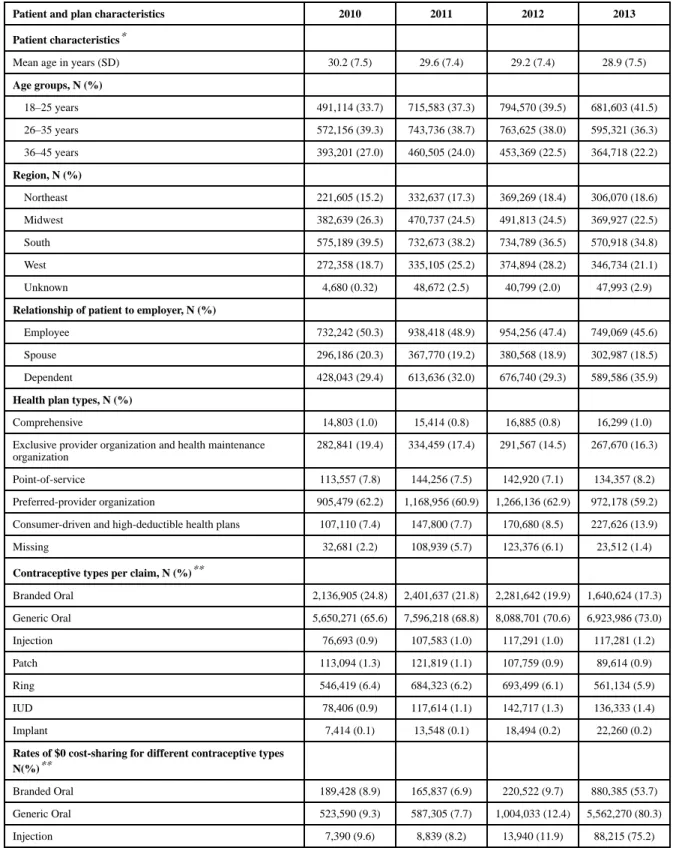
Cohort characteristics are shown in Table 1. Among contraceptive users, the proportion who were 18–25 years of age increased from 33.7% in 2010 to 41.5% in 2013. Similarly, the proportion of women who were dependents of the insured individual rose over time. There were some differences in distribution of plan types – most notably an increase in the proportion of women on consumer-driven and high-deductible health plans (7.4% in 2010 to
13.9% in 2013). Consistent with the U.S. population,24 oral contraceptive pills were the
most commonly used prescription contraceptive method among index claims, but the proportion of women using brand rather than generic pills declined over the four years. The proportion of total claims that were for LARC rose from 1% in 2010 to 1.6% in 2013. (Table 1)
For all methods, the proportion of claims for which cost-sharing was $0, including LARC, rose substantially from 2010–2013. The proportion of patients paying $0 for IUDs and implants, respectively, was 36.6% and 9.3% in 2010, and 87.6% and 80.5% in 2013. (Table 1) Figure 2 shows monthly trends in these proportions for IUDs and implants from 2010– 2013. At the start of 2010, 2011, and 2012, the proportion of LARC insertions with $0 cost-sharing was lower compared with the end of the prior year and/or the following months of that year, suggestive of higher deductible payments at the start of those calendar years. Interrupted time series analysis (Table 2) demonstrated that the ACA (with January 1, 2013 as the implementation date) was associated with a significant increase in the proportion of LARC claims with $0 cost-sharing (beta coefficient 0.65, p-value <0.001), as well as an increase in a monthly trend of rising proportions of claims with $0 cost-sharing (beta coefficient 0.004, p-value <0.001). We did identify the presence of autocorrelation in this model, likely due to the deductible patterns, however when we adjusted the model for autocorrelation, these findings did not significantly change. In our sensitivity analysis in which we excluded deductible payments from cost-sharing amounts, we did not observe the deductible-driven seasonal fluctuations in cost-sharing over the course of the calendar years
A
uthor Man
uscr
ipt
A
uthor Man
uscr
ipt
A
uthor Man
uscr
ipt
A
uthor Man
uscr
2010–2012; however the results of interrupted time series analysis were similar for the model including deductibles and in the model excluding them.
Figure 3 demonstrates the monthly proportions of women with contraceptive claims who had claims for LARC insertion. There was an overall rise in the monthly proportion of women initiating LARC from 2010 to 2013, with annual drops evident at the start of 2011 and 2012, perhaps mirroring higher deductible payments. Interrupted time series analysis (Table 3), adjusting for patient characteristics and the quarter of the year of contraceptive initiation (to address seasonal trends in LARC use), confirmed a significant trend of rising LARC uptake by month over the study period (beta coefficient 0.02, p-value <0.001). Implementation of the ACA in January 2013, however, was associated with a small but statistically significant decrease in this monthly trend (beta coefficient −0.004, p-value < 0.001). There was not a significant change in the level of LARC uptake after 2013. Among women with contraceptive claims in a given month, older women were more likely than women 18–25 to initiate LARC, and there were some differences in LARC initiation across regions and plan types. LARC initiation was lower in the first two quarters of each year compared with the last quarter. Results were similar when we used quarters as the unit of time. When we used April 1, 2013 as the date of ACA implementation, there was a
significant increase in the level of LARC use associated with the ACA (beta coefficient 0.06, p-value <0.001, Table 3).
Discussion
Consistent with a recent study from a single large insurance carrier,8 our findings
demonstrate that implementation of the ACA has had substantial impact on cost-sharing for LARC for women with employer-sponsored commercial insurance, in particular
dramatically increasing the proportion of women with $0 cost-sharing for LARC insertions. In interrupted time series analyses adjusting for patient and plan characteristics, rates of LARC use in our population rose steadily from 2010–2013, consistent with findings from a
national survey that has shown steady increases from 2009–2012.25 Immediately after
implementation of the ACA’s mandate for most plans in January 2013, the proportion of commercially insured contraceptive users initiating LARC methods was not higher than what prior trends would predict. However, our sensitivity analysis suggests that by April 2013, there may have been increases in LARC uptake beyond those predicted by previous trends. Despite this possible increase in level of LARC use, the previous rate of rise in LARC rates from 2010–2012 appeared to slow slightly in 2013.
Overall, our findings suggest that although reduced cost-sharing associated with the ACA’s mandate did not have an immediate effect on LARC use, it may be associated with increases in LARC uptake beyond the increases that would be predicted by previous trends as early as April 2013. This finding lends cautious support to studies demonstrating that reduced
cost-sharing is associated with higher rates of LARC use.18, 26 The delay in increased uptake
between January and April 2013 suggested by our sensitivity analysis may have occurred because of a lag in cost-sharing decreases, since cost-sharing continued to decline
throughout 2013, perhaps because of some plans’ delayed implementation of the rule. The
A
uthor Man
uscr
ipt
A
uthor Man
uscr
ipt
A
uthor Man
uscr
ipt
A
uthor Man
uscr
delay might also result from low initial awareness of or confusion about the benefit
changes.19
We had expected to see an increase in the previously rising trend of LARC uptake rates following the ACA mandate. The reason for the slight flattening of the trend in 2013 is not clear. Ongoing analysis in subsequent years will be imperative to understand the longer-term impact of the ACA on levels and trends in LARC use. Reductions in cost-sharing alone may not ultimately be sufficient to make LARC available to all women desiring or needing it.
LARC remains unavailable on-site at many outpatient clinics,2728 because of insufficient
numbers of providers trained,29, 30 and administrative and financial barriers for facilities.
LARC clinical protocols (for example, those requiring multiple visits for counseling and
placement31) may pose additional barriers to patient access. Successful projects such as the
CHOICE project in St. Louis,26 an intervention to promote LARC use at Kaiser Permanente
in California,32 and a Colorado state-wide initiative to promote LARC use among
low-income teens,12 incorporated provider training, improved patient counseling, and (in
Colorado’s case) reductions in the up-front cost of devices to clinics, in addition to reduced patient cost-sharing. Further, even when barriers to LARC are reduced, many patients may still choose short-acting methods, whether because of misperceptions associated with LARC
methods33 or because of informed choice. It is possible that the ACA’s decrease in cost
sharing for other methods of contraception make those methods relatively more appealing to women who may have considered initiating LARC.
This analysis has several strengths. We used a large dataset of claims from multiple insurers, increasing the generalizability of our findings. Our use of claims data allows assessment of actual contraceptive use rather than relying on self-report as has been done in other studies
of LARC rates.25 Further, use of an interrupted time series analysis allows assessment of
whether the ACA’s contraceptive coverage mandate impacted LARC use controlling for pre-existing trends.
Our analysis has several limitations, however. First, we were only able to include procedures and contraceptive methods that are reimbursed by a patient’s insurance; methods that were utilized but not covered at all, or obtained outside of a patient’s insurance plan, are not represented in the data. Similarly, we could only examine costs for methods that were actually utilized. This could lead to underestimation of average cost-sharing for a given method (including LARC) if among certain plans that method was infrequently selected because it was prohibitively expensive. Second, we have limited information on individual patient characteristics and about the health plan’s benefit design, reducing our ability to assess for confounders as well as other factors that might significantly impact cost-sharing and LARC use. This also limits our ability to determine the generalizability of our sample to the larger population of women with employer-sponsored insurance, and to analyze
differential effects of the ACA on different sub-groups. Third, our estimation of
contraceptive rates has some limitations. Since we used monthly contraceptive claims rather than individual women using contraception as the denominator, our LARC rates should not
be compared with national estimates of LARC usage.25 In addition, because of our study’s
eligibility criteria, women who had a LARC method placed during her first 6 months of plan enrollment would not be included in the numerator. However, we would not expect these
A
uthor Man
uscr
ipt
A
uthor Man
uscr
ipt
A
uthor Man
uscr
ipt
A
uthor Man
uscr
factors to impact our assessment of trends. The final and most important limitation to our study is that our analysis represents contraceptive choice in a very early period following the ACA, when patients and providers may not yet be fully aware of and utilizing the
contraceptive benefit.19
In conclusion, this study demonstrates that the ACA has had substantial impact on cost-sharing for LARC among women with employer-sponsored insurance. Although LARC uptake did not appear to increase immediately in 2013, findings of our sensitivity analysis suggest that as of April 2013, the proportion of women initiating LARC rose beyond the level that would be predicted by previous trends. Ongoing assessment will be important to examine the impact of the policy change on contraceptive choice as women’s and providers’ awareness rises and as efforts to address other barriers to LARC use grow.
Acknowledgments
Dr. Pace’s effort was funded by the Mary Ann Tynan Fellowship in Women’s Health and the Eleanor and Miles Shore Scholars in Medicine Program. Dr. Dusetzina is supported by the NIH Building Interdisciplinary Research Careers in Women’s Health (BIRCWH) K12 Program and the North Carolina Translational and Clinical Sciences Institute (UL1TR001111). The authors would like to thank Joyce Lii for expert programming assistance.
References
1. Finer LB, Zolna MR. Declines in Unintended Pregnancy in the United States, 2008–2011. N Engl J Med. Mar 3; 2016 374(9):843–852. [PubMed: 26962904]
2. Brown SS, Eisenberg L. Unintended pregnancy and the well-being of children and families. JAMA. Nov 1.1995 274(17):1332. [PubMed: 7563544]
3. Sonfield, A.; Kost, K. Public Costs from Unintended Pregnancies and the Role of Public Insurance Programs in Paying for Pregnancy-Related Care: National and State Estimates for 2010. New York: Guttmacher Institute; 2015.
4. Committee On Preventive Services For Women IoM. Clinical Preventive Services for Women: Closing the Gaps. Washington, DC: National Academies Press; 2011.
5. Department of HHS. [Accessed March 18, 2013] News Release: Affordable Care Act Ensures Women Receive Preventive Services at No Additional Cost. 2011. http://www.hhs.gov/news/press/ 2011pres/08/20110801b.html
6. Sobel, L.; Salganicoff, A.; Kurani, N.; Wiens, J.; Hawks, K.; Shields, L. Insurance Coverage of Contraceptive Services: A Review of Health Insurance Plans in Five States. Kaiser Family Foundation; Apr. 2015
7. Finer LB, Sonfield A, Jones RK. Changes in out-of-pocket payments for contraception by privately insured women during implementation of the federal contraceptive coverage requirement.
Contraception. Feb; 2014 89(2):97–102. [PubMed: 24332745]
8. Becker NV, Polsky D. Women Saw Large Decrease In Out-Of-Pocket Spending For Contraceptives After ACA Mandate Removed Cost Sharing. Health Aff (Millwood). Jul 1; 2015 34(7):1204–1211. [PubMed: 26153316]
9. Cleland K, Peipert JF, Westhoff C, Spear S, Trussell J. Family planning as a cost-saving preventive health service. N Engl J Med. May 5.2011 364(18):e37. [PubMed: 21506736]
10. Winner B, Peipert JF, Zhao Q, et al. Effectiveness of long-acting reversible contraception. N Engl J Med. May 24; 2012 366(21):1998–2007. [PubMed: 22621627]
11. Harper CC, Rocca CH, Thompson KM, et al. Reductions in pregnancy rates in the USA with long-acting reversible contraception: a cluster randomised trial. Lancet. Jun 16.2015
12. Ricketts S, Klingler G, Schwalberg R. Game change in Colorado: widespread use of long-acting reversible contraceptives and rapid decline in births among young, low-income women. Perspect Sex Reprod Health. Sep; 2014 46(3):125–132. [PubMed: 24961366]
A
uthor Man
uscr
ipt
A
uthor Man
uscr
ipt
A
uthor Man
uscr
ipt
A
uthor Man
uscr
13. Dusetzina SB, Dalton VK, Chernew ME, Pace LE, Bowden G, Fendrick AM. Cost of contraceptive methods to privately insured women in the United States. Womens Health Issues. Mar; 2013 23(2):e69–71. [PubMed: 23481693]
14. Allen RH, Goldberg AB, Grimes DA. Expanding access to intrauterine contraception. Am J Obstet Gynecol. Nov; 2009 201(5):456 e451–455. [PubMed: 19527902]
15. Xu X, Macaluso M, Ouyang L, Kulczycki A, Grosse SD. Revival of the intrauterine device: increased insertions among US women with employer-sponsored insurance, 2002–2008. Contraception. Feb; 2012 85(2):155–159. [PubMed: 22067778]
16. Finer LB, Jerman J, Kavanaugh ML. Changes in use of long-acting contraceptive methods in the United States, 2007–2009. Fertil Steril. Oct; 2012 98(4):893–897. [PubMed: 22795639]
17. Peipert JF, Madden T, Allsworth JE, Secura GM. Preventing unintended pregnancies by providing no-cost contraception. Obstet Gynecol. Dec; 2012 120(6):1291–1297. [PubMed: 23168752] 18. Pace LE, Dusetzina SB, Fendrick AM, Keating NL, Dalton VK. The impact of out-of-pocket costs
on the use of intrauterine contraception among women with employer-sponsored insurance. Med Care. Nov; 2013 51(11):959–963. [PubMed: 24036995]
19. Chuang CH, Mitchell JL, Velott DL, et al. Women’s Awareness of Their Contraceptive Benefits Under the Patient Protection and Affordable Care Act. 20151029 (1541-0048 (Electronic)). 20. Wagner AK, Soumerai SB, Zhang F, Ross-Degnan D. Segmented regression analysis of interrupted
time series studies in medication use research. J Clin Pharm Ther. Aug; 2002 27(4):299–309. [PubMed: 12174032]
21. Lagarde M. How to do (or not to do) ... Assessing the impact of a policy change with routine longitudinal data. Health Policy Plan. Jan; 2012 27(1):76–83. [PubMed: 21278077]
22. Zou G. A modified poisson regression approach to prospective studies with binary data. Am J Epidemiol. Apr 1; 2004 159(7):702–706. [PubMed: 15033648]
23. Bramness JG, Walby FA, Morken G, Roislien J. Analyzing Seasonal Variations in Suicide With Fourier Poisson Time-Series Regression: A Registry-Based Study From Norway, 1969–2007. Am J Epidemiol. Aug 1; 2015 182(3):244–254. [PubMed: 26081677]
24. Jones J, Mosher W, Daniels K. Current contraceptive use in the United States, 2006–2010, and changes in patterns of use since 1995. Natl Health Stat Report. Oct 18.2012 (60):1–25. 25. Kavanaugh ML, Jerman J, Finer LB. Changes in Use of Long-Acting Reversible Contraceptive
Methods Among U.S. Women, 2009–2012. :1873–233X. 20151023. (Electronic)).
26. Secura GM, Allsworth JE, Madden T, Mullersman JL, Peipert JF. The Contraceptive CHOICE Project: reducing barriers to long-acting reversible contraception. Am J Obstet Gynecol. Aug; 2010 203(2):115, e111–117. [PubMed: 20541171]
27. CDC. Contraceptive methods available to patients of office-based physicians and title X clinics --- United States, 2009–2010. MMWR Morb Mortal Wkly Rep. Jan 14; 2011 60(1):1–4.
28. Biggs MA, Harper CC, Malvin J, Brindis CD. Factors influencing the provision of long-acting reversible contraception in California. Obstet Gynecol. Mar; 2014 123(3):593–602. [PubMed: 24499746]
29. Harper CC, Stratton L, Raine TR, et al. Counseling and provision of long-acting reversible contraception in the US: national survey of nurse practitioners. Prev Med. Dec; 2013 57(6):883– 888. [PubMed: 24128950]
30. Harper CC, Henderson JT, Raine TR, et al. Evidence-based IUD practice: family physicians and obstetrician-gynecologists. Fam Med. Oct; 2012 44(9):637–645. [PubMed: 23027156]
31. Biggs MA, Harper CC, Brindis CD. California Family Planning Health Care Providers’ Challenges to Same-Day Long-Acting Reversible Contraception Provision. Obstet Gynecol. Aug; 2015 126(2):338–345. [PubMed: 26241424]
32. Postlethwaite D, Shaber R, Mancuso V, Flores J, Armstrong MA. Intrauterine contraception: evaluation of clinician practice patterns in Kaiser Permanente Northern California. Contraception. Mar; 2007 75(3):177–184. [PubMed: 17303486]
33. Burns B, Grindlay K, Dennis A. Women’s Awareness of, Interest in, and Experiences with Long-acting Reversible and Permanent Contraception. Womens Health Issues. May-Jun;2015 25(3): 224–231. [PubMed: 25797219]
A
uthor Man
uscr
ipt
A
uthor Man
uscr
ipt
A
uthor Man
uscr
ipt
A
uthor Man
uscr
Figure 1.
Study cohort building process
A
uthor Man
uscr
ipt
A
uthor Man
uscr
ipt
A
uthor Man
uscr
ipt
A
uthor Man
uscr
Figure 2.
Percent of LARC claims with $0 cost-sharing by month, 2010–2013
A
uthor Man
uscr
ipt
A
uthor Man
uscr
ipt
A
uthor Man
uscr
ipt
A
uthor Man
uscr
Figure 3.
Monthly rates of LARC initiation among women with contraceptive claims, 2010–2013
A
uthor Man
uscr
ipt
A
uthor Man
uscr
ipt
A
uthor Man
uscr
ipt
A
uthor Man
uscr
A
uthor Man
uscr
ipt
A
uthor Man
uscr
ipt
A
uthor Man
uscr
ipt
A
uthor Man
uscr
ipt
Table 1
Characteristics of contraceptive users and claims by year
Patient and plan characteristics 2010 2011 2012 2013 Patient characteristics*
Mean age in years (SD) 30.2 (7.5) 29.6 (7.4) 29.2 (7.4) 28.9 (7.5)
Age groups, N (%)
18–25 years 491,114 (33.7) 715,583 (37.3) 794,570 (39.5) 681,603 (41.5)
26–35 years 572,156 (39.3) 743,736 (38.7) 763,625 (38.0) 595,321 (36.3)
36–45 years 393,201 (27.0) 460,505 (24.0) 453,369 (22.5) 364,718 (22.2)
Region, N (%)
Northeast 221,605 (15.2) 332,637 (17.3) 369,269 (18.4) 306,070 (18.6)
Midwest 382,639 (26.3) 470,737 (24.5) 491,813 (24.5) 369,927 (22.5)
South 575,189 (39.5) 732,673 (38.2) 734,789 (36.5) 570,918 (34.8)
West 272,358 (18.7) 335,105 (25.2) 374,894 (28.2) 346,734 (21.1)
Unknown 4,680 (0.32) 48,672 (2.5) 40,799 (2.0) 47,993 (2.9)
Relationship of patient to employer, N (%)
Employee 732,242 (50.3) 938,418 (48.9) 954,256 (47.4) 749,069 (45.6)
Spouse 296,186 (20.3) 367,770 (19.2) 380,568 (18.9) 302,987 (18.5)
Dependent 428,043 (29.4) 613,636 (32.0) 676,740 (29.3) 589,586 (35.9)
Health plan types, N (%)
Comprehensive 14,803 (1.0) 15,414 (0.8) 16,885 (0.8) 16,299 (1.0)
Exclusive provider organization and health maintenance organization
282,841 (19.4) 334,459 (17.4) 291,567 (14.5) 267,670 (16.3)
Point-of-service 113,557 (7.8) 144,256 (7.5) 142,920 (7.1) 134,357 (8.2)
Preferred-provider organization 905,479 (62.2) 1,168,956 (60.9) 1,266,136 (62.9) 972,178 (59.2)
Consumer-driven and high-deductible health plans 107,110 (7.4) 147,800 (7.7) 170,680 (8.5) 227,626 (13.9)
Missing 32,681 (2.2) 108,939 (5.7) 123,376 (6.1) 23,512 (1.4)
Contraceptive types per claim, N (%)**
Branded Oral 2,136,905 (24.8) 2,401,637 (21.8) 2,281,642 (19.9) 1,640,624 (17.3)
Generic Oral 5,650,271 (65.6) 7,596,218 (68.8) 8,088,701 (70.6) 6,923,986 (73.0)
Injection 76,693 (0.9) 107,583 (1.0) 117,291 (1.0) 117,281 (1.2)
Patch 113,094 (1.3) 121,819 (1.1) 107,759 (0.9) 89,614 (0.9)
Ring 546,419 (6.4) 684,323 (6.2) 693,499 (6.1) 561,134 (5.9)
IUD 78,406 (0.9) 117,614 (1.1) 142,717 (1.3) 136,333 (1.4)
Implant 7,414 (0.1) 13,548 (0.1) 18,494 (0.2) 22,260 (0.2)
Rates of $0 cost-sharing for different contraceptive types N(%)**
Branded Oral 189,428 (8.9) 165,837 (6.9) 220,522 (9.7) 880,385 (53.7)
Generic Oral 523,590 (9.3) 587,305 (7.7) 1,004,033 (12.4) 5,562,270 (80.3)
A
uthor Man
uscr
ipt
A
uthor Man
uscr
ipt
A
uthor Man
uscr
ipt
A
uthor Man
uscr
ipt
Patient and plan characteristics 2010 2011 2012 2013
Patch 9,763 (8.6) 8,250 (6.8) 11,790 (10.9) 58,926 (65.8)
Ring 47,498 (8.7) 49,655 (7.3) 78,826 (11.4) 369,619 (65.9)
IUD 28,724 (36.6) 44,002 (37.4) 57,406 (40.2) 119,423 (87.6)
Implant 2,308 (9.3) 4,263 (31.1) 6,283 (34.0) 17,914 (80.5)
*
Distribution of patient and contraceptive characteristics at the time of the first contraceptive claim per year for each patient. A patient’s characteristics could be represented in multiple years if she had claims in multiple years.
**
A
uthor Man
uscr
ipt
A
uthor Man
uscr
ipt
A
uthor Man
uscr
ipt
A
uthor Man
uscr
ipt
Table 2
Interrupted time series analysis of $0 cost-sharing among LARC users, 2010–2013
Characteristic Beta coefficient P-value
Intercept −1.07 <0.001
Overall change in trend by month 0.007 <0.001 After ACA change in level 0.65 <0.001 After ACA change in trend by month 0.004 <0.001 Age group
18–25 years Reference
26–35 years 0.03 <0.001
36–45 years 0.01 0.004
Region
Northeast Reference
Midwest −0.12 <0.001
South −0.28 <0.001
West −0.07 <0.001
Unknown −0.21 <0.001
Health plan type
Comprehensive 0.08 <0.001
Exclusive provider organization and health maintenance organization 0.26 <0.001
Point-of-Service 0.21 <0.001
Preferred-provider organization Reference
Consumer-driven and high-deductible health plans 0.10 <0.001
Missing 0.27 <0.001
A
uthor Man
uscr
ipt
A
uthor Man
uscr
ipt
A
uthor Man
uscr
ipt
A
uthor Man
uscr
ipt
Table 3
Interrupted time series analysis of monthly rates of LARC initiation among women with contraceptive claims, 2010–2013
January 2013 as intervention point April 2013 as intervention point* Characteristic Beta coefficient p-value Beta coefficient p-value
Intercept −4.78 <0.001 −6.17 <0.001
Overall change in trend by month 0.02 <0.001 0.02 <0.001 After ACA change in level −0.004 0.58 0.06 <0.001 After ACA change in trend by month −0.004 <0.001 −0.02 <0.001 Age group
18–25 years Reference
26–35 years 0.60 <0.001 0.60 <0.001
36–45 years 0.70 <0.001 0.70 <0.001
Region
Northeast Reference
Midwest 0.09 <0.001 0.09 <0.001
South 0.18 <0.001 0.18 <0.001
West 0.37 <0.001 0.37 <0.001
Unknown 0.23 <0.001 0.23 <0.001
Health plan type
Comprehensive −0.12 <0.001 −0.12 <0.001
Exclusive provider organization and health maintenance organization
0.06 <0.001 0.06 <0.001
Point-of-Service −0.03 <0.001 −0.03 <0.001
Preferred-provider organization Reference Reference
Consumer-driven and high-deductible health plans −0.12 <0.001 −0.13 <0.001
Missing −0.23 0.001 −0.23 <0.001
Quarter of year
Quarter 1 −0.24 <0.001 −0.25 <0.001
Quarter 2 −0.17 <0.001 −0.19 <0.001
Quarter 3 −0.006 0.09 −0.02 <0.001
Quarter 4 Reference
ACA=Affordable Care Act *