C O N S E R V A T I O N E C O L O G Y 2017 © The Authors, some rights reserved; exclusive licensee American Association for the Advancement of Science. Distributed under a Creative Commons Attribution NonCommercial License 4.0 (CC BY-NC).
Predatory fish depletion and recovery potential on
Caribbean reefs
Abel Valdivia,1* Courtney Ellen Cox,2John Francis Bruno3
The natural, prehuman abundance of most large predators is unknown because of the lack of historical data and a limited understanding of the natural factors that control their populations. Determining the supportable predator biomass at a given location (that is, the predator carrying capacity) would help managers to optimize protection and would provide site-specific recovery goals. We assess the relationship between predatory reef fish biomass and several anthropogenic and environmental variables at 39 reefs across the Caribbean to (i) estimate their roles determining local predator biomass and (ii) determine site-specific recovery potential if fishing was eliminated. We show that predatory reef fish biomass tends to be higher in marine reserves but is strongly negatively related to human activities, especially coastal development. However, human activities and natural factors, including reef complexity and prey abundance, explain more than 50% of the spatial variation in predator biomass. Comparing site-specific predator carrying capacities to field observations, we infer that current predatory reef fish biomass is 60 to 90% lower than the potential supportable biomass in most sites, even within most marine reserves. We also found that the scope for recovery varies among reefs by at least an order of magnitude. This suggests that we could underestimate unfished biomass at sites that provide ideal conditions for predators or greatly overestimate that of seemingly predator-depleted sites that may have never supported large predator populations because of suboptimal environmental conditions.
INTRODUCTION
Overfishing and habitat degradation have caused the decline of count-less large marine predator species from most of the world’s oceans (1–3). Their widespread depletion has indirectly modified (or elimi-nated) species interactions, redistributed the flow of energy, and altered ecosystem functioning and services (1,2,4–6). Fishing has substantially changed the structure of fish communities in coral reefs, particularly re-ducing the abundance and size of large predatory fishes (7–16), in-cluding widespread declines of reef sharks (17–21). However, quantifying the impacts of fishing has proven challenging because we generally lack quantitative, spatially replicated baseline data on the preexploitation state of fish assemblages. Historical analyses sug-gest extensive reduction of large marine predators that typically pre-ceded population assessments (22–24). The extent of fishing on coral reefs has been estimated using fishing intensity gradients based on catch efforts (7,9,11,12,25), fishing mortality differences between inside and outside marine reserves (8,14,26–31), and human pressure indices as a proxy for fishing intensity (15,16,18,20,32–35). In general, these studies show strong spatial and temporal gradients in fishing pressure and fish biomass and declines of roughly 50 to 95% compared to presumed un-fished biomass values.
Although returning many predator populations to pristine historical baseline abundance is unrealistic, the knowledge of the current natural state of predator assemblages in the absence of fishing (that is, potential carrying capacity) gives managers reasonable science-based recovery goals to evaluate the efficacy of management. However, ecological baselines vary with environmental context (36). Therefore, to assess the degree to which human activities have altered marine communities and to estimate local and regional potential carrying capacity, we need a better understanding of
the factors that control the structure and composition of unexploited com-munities. We know little about the natural abundance and distribution of predator assemblages across landscapes and regions (1,2,4,37). We tend to assume that predators used to be ubiquitous—present at all locations (22,24)—but our knowledge of their natural spatiotemporal distribution and abundance is limited. Given the influence of environmental charac-teristics on predator populations, the assumption that all sites and regions have the potential, in the absence of fishing, to sustain fish communities similar to“quasi-pristine”baseline sites (32,34) may be unfounded.
Home-range and foraging patterns of marine predators (for example, sharks, tuna, and turtles) respond to prey availability (38–40) and can also be influenced by other predators, competitors, temperature, habitat structural complexity, and numerous other biotic and abiotic factors (12,13). For example, sea surface temperature and primary productivity cause differences in reef shark abundances across coral reefs of the central Pacific (20). In the western Pacific, ~19 to 53% of the variation in diversity and biomass of large-bodied reef fish is explained by atoll position, tem-perature, depth, wave energy, distance to deep water, and topography complexity, whereas fishing explains ~26 to 60% (19,41). Yet, in exploited ecosystems, bottom-up forcing can be difficult to detect because predators are affected by spatiotemporal variation in top-down control by humans (that is, hunting or fishing) that obscures any response to natural environ-mental differences among sites (9,13,15,42).
Here, we quantify the spatial relationships between human popula-tion attributes (as proxies for fishing intensity and other anthropogenic impacts), prey abundance and other environmental characteristics, and the biomass of predatory reef fishes (sharks, grouper, etc.) at 39 reefs across the central-western Caribbean. We used this information to de-termine (i) site-specific carrying capacities and recovery potential, (ii) the degree of predatory fish biomass missing from Caribbean reefs, and (iii) the effectiveness of marine reserves in protecting predatory reef fishes. Our results not only indicate high recovery potential of predatory fish biomass on Caribbean reefs but also suggest that natural predator abundance varies greatly among sites because of environmental charac-teristics, including resource availability and habitat heterogeneity. 1Center for Biological Diversity, 1212 Broadway Suite 800, Oakland, CA 94612, USA.2
Na-tional Museum of Natural History, 1000 Constitution Avenue Northwest, Washington, DC 20560, USA.3Department of Biology, University of North Carolina at Chapel Hill, Wilson Hall, 120 South Road, Chapel Hill, NC 27599, USA.
RESULTS
Spatial variation of observed predatory fish biomass Observed reef fish and predatory fish biomass varied greatly among sites even within marine reserves. Among the 39 fore-reef sites studied, the average total fish biomass per site (mean ± SE) ranged from ~55 ± 8 g m−2 at Mexico Rocks in Belize to ~445 ± 148 g m−2at El Peruano inside the Gardens of the Queen marine reserve in Cuba (Fig. 1). Mean total fish biomass was ~137 ± 9 g m−2on unprotected reefs and ~237 ± 16 g m−2 across marine reserves (Fig. 1 and fig. S1). The mean biomass of apex predators and piscivore-invertivores combined (hereafter“predators”) ranged from ~3 ± 1 g m−2at Ebano to ~260 ± 78 g m−2at El Peruano, both sites in Cuba (Fig. 1). Although there was high spatial variation among reefs within countries and protection levels, total fish and predator biomass was higher within the marine reserves of Abaco, Cuba, and Mex-ico than in reserves of Belize (Fig. 1 and fig. S1). The proportion of trophic guilds varied across sites (Fig. 1 and fig. S2), but the biomass of all lower trophic levels was positively correlated with predator biomass (rs= ~0.20 to 0.35,P< 0.001; fig. S3). For detailed description of fish biomass spatial difference among sites, see section S1.
Covariates explaining the spatial variation of observed predatory fish biomass
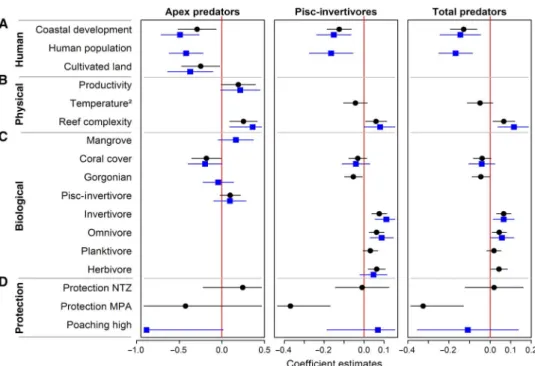
Predatory fish biomass was strongly and negatively correlated with human-related variables (for example, coastal development and human population density) but positively related to habitat reef complexity (Fig. 2, Table 1, and fig. S4). The combination of top models (DAICc < 2, whereSwAICc> 0.95) analyzing all sites (model set A) and sites within marine reserves (model set B) included“coastal development”for all predator groups (Fig. 2A and Table 1).“Human population”was not selected in the top models across all sites (Table 1); however, it was a good predictor for predator biomass within marine reserves (Fig. 2A). Only the biomass of apex pre-dators was negatively related to“cultivated land”(Fig. 2A and Table 1). Among the physical cofactors, only the biomass of apex predators showed a weak positive relationship with“ocean productivity,”whereas the qua-dratic term of“temperature”was not important (Fig. 2B, Table 1, and fig. S4). In contrast, the biomass of both predatory fish was positively related to“reef complexity”(Fig. 2B, Table 1, and figs. S4 and S5).
Predatory fish biomass was more related to potential prey than to habitat features, such as coral and gorgonian cover or connectivity to mangrove (Fig. 2C and Table 1). For example, only the biomass of apex predators tended to be higher at few reefs within marine reserves asso-ciated with mangrove (Fig. 2C). The biomass of both predator groups was mostly unrelated to“coral cover”or“gorgonian abundance”(Fig. 2C), although piscivore-invertivores were negatively correlated to the latter across all sites (Fig. 2C and Table 1). In contrast, lower trophic fish groups (except for planktivores) drove some of the spatial variation of predator biomass across sites (Fig. 2C and Table 1). Particularly, the biomass of piscivore-invertivores was positively and strongly correlated with the biomass of invertivore, omnivore, and herbivore fishes (except for herbivores within marine reserves) (Fig. 2C and Table 1).
Both predatory fish groups responded differently to protection level (for example, no protection, MPA, and NTZ) (Fig. 2D and Table 1). No protection was used to set the comparisons for the NTZ and MPA cat-egories. The biomass of apex predators was not related to NTZs (that is, no fishing) and showed no correlation with MPAs (that is, some fishing is allowed) across sites (Fig. 2D). In contrast, the biomass of piscivore-invertivores showed no association with NTZ but a strong negative rela-tion with MPAs (Fig. 2D). Finally, apex predator biomass tended to be lower within marine reserves with higher“poaching levels”(Fig. 2D). Reserve age and size were not important for any predator group in our study (Table 1).
Overall, the models analyzing all sites (model set A)“explained”~50, ~57, and ~61% of the spatial variation among sites in the biomass of apex predators, piscivore-invertivores, and total predators, respectively (Table 1). Within marine reserves, all these covariates explained ~43% of the variation of apex predators among sites, ~56% of that of piscivore-invertivores, and ~58% of that of total predators (Table 1). For detailed results of the relationship of predatory fish biomass and main cofactors, see section S2.
Reconstructed potential carrying capacity for predatory fish biomass
The potential site-specific carrying capacity range for predatory fish biomass was estimated by comparing the difference between expected
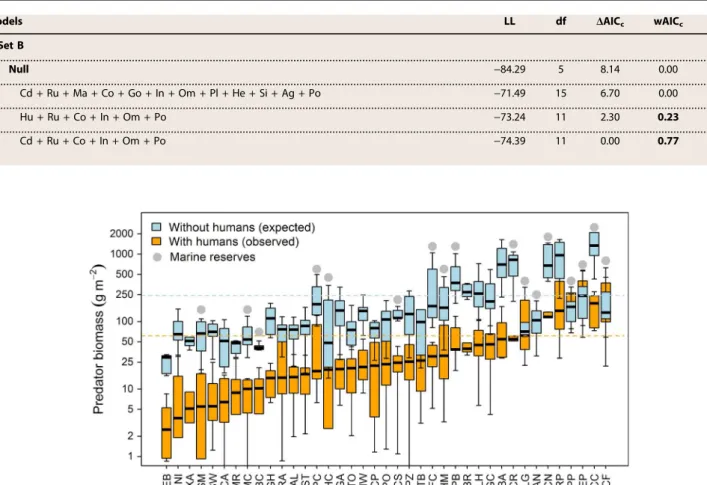
(light blue) and observed (orange) mean biomass after setting human-related variables to zero and considering all sites protected (Fig. 3). We inferred that three of four reefs (30 of 39 sites), even within marine re-serves, support 60 to 90% less predatory fish biomass than the potential carrying capacity at a given site, likely because of human activities asso-ciated with coastal development, such as fishing (Fig. 3; see table S1 for values). For example, we observed that the average biomass of apex pre-dators (for example, sharks, jacks, barracudas, tarpon, and large-bodied groupers) was less than 10% of the estimated potential carrying capac-ity, whereas the observed average biomass of piscivore-invertivores (for example, medium-bodied fish, such as jacks, snappers, and groupers) was ~18% of the estimated biomass in the absence of fishing across sites. Few sites within marine reserves showed observed biomass averages within the expected range in the absence of human activities (Fig. 3 and table S1). For example, total predatory fish biomass at sites within the marine reserves of Gardens of the Queen in Cuba and Dry Tortugas in Florida showed predatory fish biomass within values predicted by the models (Fig. 3). In contrast, reef sites within other marine reserves, such as Hol Chan and Half Moon in Belize, regarded as well managed, showed sub-stantially lower observed than expected values (Fig. 3 and table S1). On average, sites within NTZs showed a ~66% less than expected predatory fish biomass, whereas there was ~88% less at sites with no protection and within MPAs.
DISCUSSION
Reef complexity and lower trophic fish were strong predictors of pred-atory fish biomass. Habitat complexity is thought to attract predators, in part, because it is often associated with prey richness and abundance (43). We found that the standing biomass of lower trophic levels was positively related to predatory fish biomass, especially for piscivore-invertivores (Fig. 3). Other environmental variables, such as productivity,
temperature, and benthic habitat features played a less important role (for a discussion on the rest of variables, see section S3). Our models explained more than 50% of the observed spatial variation in predator biomass (Table 1). However, we caution that there are likely additional important variables that we did not consider. For example, larval supply (44), intraguild competition and predation (45,46), and habitat con-nectivity (43,47) also regulate predatory fish populations.
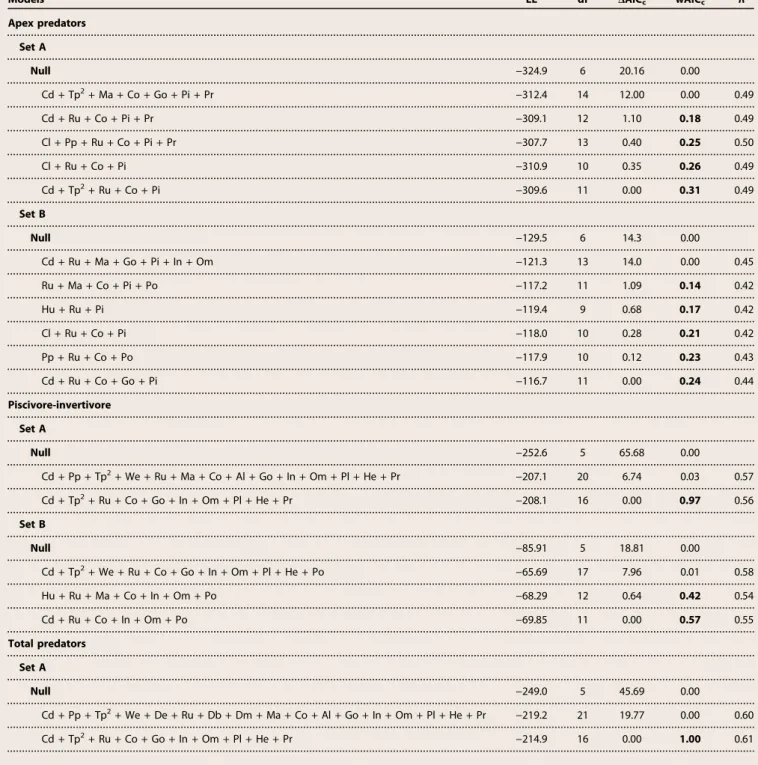
Table 1. Summary of generalized linear mixed-effects models.Results of the generalized linear mixed-effects model (GLMM) comparisons using Akaike’s information criterion corrected for small sample sizes (AICc) for apex predators, piscivore-invertivores, and total predators. Only the null model, an exploratory model that outper-formed the null model, and final models (DAICc< 2, whereSwAICc> 0.95) are shown. Model set A included all sites, whereas model set B included sites within reserves. Parameters are as follows: model maximum log-likelihood (LL), degrees of freedom (df), change in AICc(DAICc), AICcweights (wAICc), and pseudocoefficient of deter-mination for GLMMs (R2). Models are ordered by increasing wAIC
c, and the final models show bolded wAICc. Model covariates include the following: Ag, reserve age; Al, macroalgae; Db, distance to reef break; De, depth; Dm, distance to mangrove; Cd, coastal development within 50 km; Cl, cultivated land within 50 km; Co, corals; He, herbivores; Hu, human population density within 50 km; In, invertivores; Go, gorgonians; Ma, mangrove perimeter within 5 km; Tp2, quadratic term of minimum monthly mean sea surface temperature; Om, omnivores; Pi, piscivore-invertivores; Pl, planktivores; Po, poaching level within reserve; Pp, net primary production; Pr, protection level; Ra, reef area within 5 km; Ru, reef complexity; Si, reserve size; We, wave exposure. See table S4 for units.
Models LL df DAICc wAICc R2
Apex predators
Set A
Null −324.9 6 20.16 0.00
Cd + Tp2+ Ma + Co + Go + Pi + Pr −312.4 14 12.00 0.00 0.49
Cd + Ru + Co + Pi + Pr −309.1 12 1.10 0.18 0.49
Cl + Pp + Ru + Co + Pi + Pr −307.7 13 0.40 0.25 0.50
Cl + Ru + Co + Pi −310.9 10 0.35 0.26 0.49
Cd + Tp2+ Ru + Co + Pi −309.6 11 0.00 0.31 0.49
Set B
Null −129.5 6 14.3 0.00
Cd + Ru + Ma + Go + Pi + In + Om −121.3 13 14.0 0.00 0.45
Ru + Ma + Co + Pi + Po −117.2 11 1.09 0.14 0.42
Hu + Ru + Pi −119.4 9 0.68 0.17 0.42
Cl + Ru + Co + Pi −118.0 10 0.28 0.21 0.42
Pp + Ru + Co + Po −117.9 10 0.12 0.23 0.43
Cd + Ru + Co + Go + Pi −116.7 11 0.00 0.24 0.44
Piscivore-invertivore
Set A
Null −252.6 5 65.68 0.00
Cd + Pp + Tp2+ We + Ru + Ma + Co + Al + Go + In + Om + Pl + He + Pr −207.1 20 6.74 0.03 0.57
Cd + Tp2+ Ru + Co + Go + In + Om + Pl + He + Pr −208.1 16 0.00 0.97 0.56
Set B
Null −85.91 5 18.81 0.00
Cd + Tp2+ We + Ru + Co + Go + In + Om + Pl + He + Po −65.69 17 7.96 0.01 0.58
Hu + Ru + Ma + Co + In + Om + Po −68.29 12 0.64 0.42 0.54
Cd + Ru + Co + In + Om + Po −69.85 11 0.00 0.57 0.55
Total predators
Set A
Null −249.0 5 45.69 0.00
Cd + Pp + Tp2+ We + De + Ru + Db + Dm + Ma + Co + Al + Go + In + Om + Pl + He + Pr −219.2 21 19.77 0.00 0.60
Cd + Tp2+ Ru + Co + Go + In + Om + Pl + He + Pr −214.9 16 0.00 1.00 0.61
the large degree of context dependency on predatory reef fish carrying capacity.
On the basis of our model predictions, some fore-reef sites may be potential hot spots for predatory fish biomass, with predicted average biomass of more than 500 g m−2, if anthropogenic stressors were elimi-nated and fishing regulations were better enforced. For example, our model predicts that Columbia Reef within fisheries closures of Cozumel, Mexico, could support, on average, 10 times (~725 g m−2) the current levels of predatory fish biomass (Fig. 3 and table S1). The central and north sites of Banco Chinchorro in Mexico could support average pred-ator fish biomass of more than 800 g m−2. The observed values at these sites were only ~10% of their predicted supportable biomass (Fig. 3 and table S1). Fished sites, such as Bacunayagua in the northern site of Cuba and Rocky Point in the south tip of Abaco, Bahamas, could potentially reach 10 and 5 times higher biomass than the current levels, respectively (Fig. 3 and table S1). This information could be used by managers as benchmarks to trigger conservation initiatives (for example, where to place new marine reserves) and to better tailor conservation efforts for strategic protection and restoration. However, predicted biomass in our study should be interpreted with caution because there are several ecolog-ical variables (for example, competition and intraguild predation) and other environmental factors that we did not include in the models that may influence realized site-specific fish biomass.
Predatory fish biomass predicted in our study is also considerably higher than unfished fish biomass from some recent studies, which ranges from 100 to 150 g m−2across reefs of the Caribbean, Indian, and Pacific oceans (29–31,35). Several reasons can explain these dis-crepancies. First, we included large predatory reef fishes in our surveys, which greatly contribute to the total fish biomass. However, most of these studies excluded apex predators, such as sharks and large jacks, and the survey methodology was not designed to account for these pred-ators (29–31,35). Second, we used noninstantaneous surveys, recording all fishes within, passing into, or across the survey area in front of the divers as they swim along the transect. Evidence from simulation models suggests that noninstantaneous surveys tend to overestimate the abun-dance of large and vagile fishes (52). The methodology of some of these studies includes instantaneous surveys (35) that are not comparable to our study design. However, our observed values are very similar to studies with comparable goals and methods (50). Third, reef fish biomass values estimated in these studies are averages from several sites across a wide range of reef habitats and depths (14,31,35) and are not necessarily representative of site-specific and structurally complex fore-reef habitats at a depth of 10 to 15 m as in our study. Therefore, we reiterate that our fish abundance estimates (including predicted predatory fish biomass) are site-specific for fore-reef habitats and variable according to their environ-mental conditions.
Fig. 3. Estimated biomass of predatory reef fish in the absence of human activities.Boxplot of the observed (orange) and predicted (light blue) median (50 and 99% quartiles) of predatory reef fish biomass across survey sites (ordered from lowest to highest biomass). Horizontal dashed lines are the observed (orange) and predicted (light blue) regional means. Predicted biomass was based on the best explanatory model given, with no coastal development within 50 km (that is, in the absence of humans) and every site considered as an NTZ (that is, no fishing). On the basis of the predictive models, 60 to 90% of the potential predatory fish biomass has been extracted in three of four reefs. NTZs and MPAs with minimum fishing are noted as marine reserves (gray dots). For better representation,yaxis is in log scale. For site codes, see table S2.
Models LL df DAICc wAICc R2
Set B
Null −84.29 5 8.14 0.00
Cd + Ru + Ma + Co + Go + In + Om + Pl + He + Si + Ag + Po −71.49 15 6.70 0.00 0.56
Hu + Ru + Co + In + Om + Po −73.24 11 2.30 0.23 0.53
Given the sensitivity of predatory reef fish surveys to methodology, observer biases, and environmental conditions, the specific carrying ca-pacity values predicted for our sites should not be applied to other reefs or habitat types. Also, these site-specific supportable biomass estimates are potential values under current conditions. We cannot know precise-ly the past, prehuman predator biomass of a reef because many of the key environmental drivers have presumably changed. Thus, potential carrying capacities are both time- and location-specific, and they are not necessarily indicators of the past. Our results have conservation ap-plications because they demonstrate how much predatory fish biomass may be missing, how ineffective most marine reserves and MPAs are for both top predators and mesopredators (Fig. 2), and how much more potential for recovery and fisheries productivity still exists (Fig. 3). We can-not predict how much biomass would be achieved by restricting fishing at a given site, but we can say with some certainty which sites are likely to support the largest predatory fish populations. This approach could also be useful in providing site-specific targets in data-poor multispecies reef fish-eries, where historical and time series information is absent.
Predatory fishes represented more than 40% of the total fish biomass at some of the relatively isolated reefs and inside the large and well-enforced marine reserves that we surveyed (Fig. 1). Most protected reefs had higher total fish and predator biomass (Fig. 1), and the abundance of apex predators, such as sharks, groupers, snappers, and jacks, de-clined across a gradient of human effects (Fig. 3). Most of these predators were entirely absent from unprotected sites (Fig. 1), a finding concordant with presence-absence surveys performed by citizen scientists in the region (15) and scientific surveys (50). Large reef fish predators are rare throughout the Caribbean and occupy only a small fraction of sites be-cause of selective targeting by fishermen and greater vulnerability to even low levels of fishing (15,18). Moreover, because of their slower growth and lower fecundity rates, large fishes recover more slowly once a reserve is established—often requiring decades to become reestablished (28,32). These factors lead to nonrandom changes in composition and reductions in richness as fishing pressure increases (Fig. 1). The fish communities from intensively exploited sites represent a nonrandom subset (mainly smaller-bodied, lower trophic level taxa) of the species present on un-fished reefs. Although we could not directly assess the relative role of fishing and other human effects, we suspect that fishing has been the main proximate cause of the differences between observed and predicted pred-atory fish biomass, whereas the ultimate causes include coastal develop-ment, increased human populations, and economic growth.
The observed total fish biomass in our study varied by nearly 10-fold (55 to 484 g m−2) among the 39 sites; this finding is consistent with other large-scale reef studies across gradients of human impacts. Our range fell within the wider range (15 to 596 g m−2) observed in similar fore-reef habitats of the Caribbean (25) and elsewhere (note that we did not survey some of the region’s most overfished islands, including Haiti and Jamaica). In the western-central Pacific, for instance, fish biomass grad-ually increased from 13 g m−2on reefs of the heavily populated island of Guam to 348 g m−2on the isolated Kure atoll (13), and up to 527 g m−2 on the remote Kingman atoll (43). This generalized gradient of fish bio-mass across large spatial scales is assumed to have been caused largely by spatial variation in fishing intensity because of proximity to human settle-ments (16,34). Because our survey sites were not selected at random (that is, we purposefully surveyed most regions with the least fished reefs), the biomass mean and distribution we documented among sites are not representative of the Caribbean mean/distribution. We suspect that the Caribbean distribution is far more strongly skewed, where a large majority of sites have very low biomass (30).
In conclusion, current predatory reef fish assemblages are strongly influenced by both fishing and numerous habitat characteristics. Be-cause there is little spatial coincidence between the natural and anthro-pogenic factors that influence predator populations, predicting their relative effects at a given location has been challenging. However, our results suggest that not considering the role of natural environmental variation could lead to large underestimates or overestimates of reef-specific carrying capacity for predatory fish assemblages and, hence, the degree of overfishing. We could overlook reefs that provide ideal con-ditions for predators or greatly overestimate the restoration potential of seemingly predator-depleted sites that may have never supported large populations because of suboptimal physical and biological conditions. Therefore, the carrying capacity for predatory reef fish biomass should be site-specific, and the proposed global unfished biomass derived from remote sites or marine reserves with unique oceanographic features is un-likely to provide an accurate representation of potential carrying capacity conditions in most locations.
MATERIALS AND METHODS Study sites
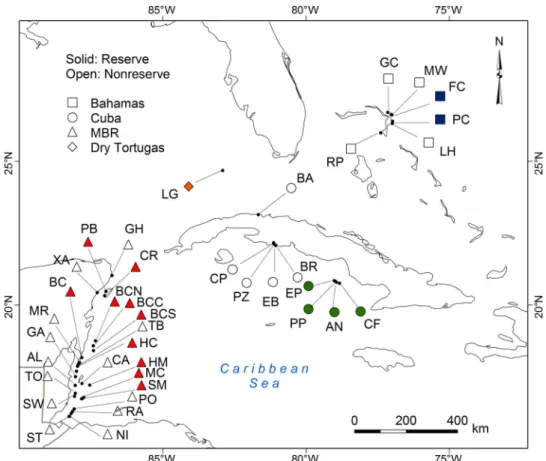
Surveys were performed on slope and spur-and-groove fore-reefs with a depth of 10 to 15 m, usually dominated by the coralsMontastraeaand
Orbicella,across 39 sites in The Bahamas, Cuba, Florida (United States), Mexico, and Belize (Fig. 4 and table S2). We selected sites to maximize the range of total fish biomass in each subregion by including reefs inside and outside marine reserves (that is, NTZs, where fishing is pro-hibited), except at Dry Tortugas, where only a reserve site was surveyed. Four sites in Gardens of the Queen marine reserve in Cuba (Fig. 4 and table S2) were chosen a priori because they were reputed to have rela-tively high predator biomass with fairly intact fish communities (22,53). To minimize seasonal variability, we conducted all surveys during the summer months of May to July 2010–2012 (table S2).
Fish abundance
(28), and the parametersaandbare species-specific selected from geo-graphic areas close to our study region (56). When these parameters were unavailable, we used estimates for congeneric species of similar morphology and size (table S3). We used fish biomass because it is a comprehensive indicator of fish assemblages status across fishing gradients (25,35,50,57). Fish size is a key functional attribute, and size spectra analy-ses are used to determine fishing intensity (11,58), detect mesopredator release and cascading effects (5,9), and even estimate fish abundance in the absence of fishing (59). However, fish biomass allowed us to directly compare our results with other studies that estimate unfished biomass (14,29–31,35).
Fish species were assigned to a functional group based on six trophic guilds: apex predators, piscivore-invertivores, invertivores, planktivores, omnivores, and herbivores, following reported dietary information (56). For the purpose of this study, we considered“predatory fish”apex pred-ators and/or piscivore-invertivores because both feed mostly on fish. Apex predators were defined as large fish species with the highest trophic level in the community, which consume mostly fish and with very few, if any, predators (60). Piscivore-invertivores (that is, mesopredators) feed on fish and invertebrates, invertivores only feed on invertebrates, omni-vores consume marine plants and invertebrates, and herbiomni-vores only feed on marine plants (table S3).
Covariates
For each reef site, we gathered a preliminary data set of 29 anthropo-genic, physical, biotic, and management-related variables known to in-fluence predatory fish abundance (table S4). For a detailed justification of each covariate, see section S4. After an exploratory and discarding
analysis, we used the best explanatory variables to predict predatory fish biomass in the absence of humans, that is, no fishing (see“Data analysis”). Direct and accurate measures of fishing intensity are scarce for our study sites because of the lack of reliable coral reef fisheries data. There-fore, we used human pressure indices, such as human population den-sity and other human-related parameters, as indicators of anthropogenic effects (for example, fishing intensity). Human pressure indices, such as spatial gradients of human population density per reef area or fishers per kilometer of reef, have been used as a proxy for regional fishing intensity in coral reefs, particularly when fishing effort or catch data are not avail-able (12,16,20,34,35,50,61,62). For example, the number of people per reef area is strongly correlated with ecological footprints and sustainability of coral reef fisheries across islands of the world (12,63). An increasing number of studies have shown that reefs associated with large human population densities have lower abundance and smaller size of fish (15,
16,18,20,33,35,63). This approach takes advantage of quasi-pristine reef areas with minimal human disturbance (16,20,32,34,35) or of the oldest, well-enforced, and largest fisheries closures as reference sites to evaluate exploitation effects on more disturbed areas (14,28–31). These un-disturbed sites should reflect preexploitation levels that can approximate baselines at current conditions (24,28).
demand and the distance traveled to markets, because both indices have shown to influence local coral reef fisheries (section S4 and table S4) (64,65). Physical and spatial covariates included the following: average and minimum average of sea surface temperature (2002–2011), average oceanic net primary productivity (2002–2012), wave exposure, depth, reef structural complexity, reef area (within 5 and 10 km), distance to deep water (30-m isobath), distance to reef breaks, and distance to mangrove (section S4 and table S4). Biotic factors included mangrove perimeter (within 5 and 10 km), coral cover, macroalgal cover, gorgo-nian abundance, and biomass of lower trophic fish groups. Reef area and mangrove perimeter were calculated at multiple scales to deter-mine the influence of landscape extent on predatory fish (section S4 and table S4). Management-related variables included protection level for each site (none, MPAs, and NTZs), reserve size and age, and poaching levels (low or high) inside reserves (section S4 and table S4). For detailed descriptions and measurements of each covariate, re-fer to section S4.
Data analysis
To explore among site variation of predatory fish biomass in relation to strict protection (that is, reserve and nonreserve) and country, we used a linear mixed-effects model in which fish biomass was explained by those two factors and grouped by sites. We analyzed differences be-tween factors using Bonferroni-corrected pairwise comparisons.
To select the covariates that better explain the variation in predatory fish biomass, we first evaluated their collinearity using a Spearman’s rank (rs) correlation matrix for all sites and for sites within marine re-serves (table S5). Several covariates were sufficiently correlated (−0.5 >
rs> +0.5) to compromise interpretation when modeled together (66). For example, reef area (rs= 0.83) and mangrove perimeter (rs= 0.93) were highly correlated within 5 and 10 km, as were the log values among most of the human-related variables (rs> 0.5) (see table S5 for other correlations). Thus, we first ran single-variable generalized linear models with related covariates (for example, human-related) to exam-ine the best supporting covariates using the weights of AICc(table S6). Improvement in fit was evaluated with analysis of deviance among models (67).
We created two sets of global models: set A, for all reef sites consid-ering protection level, and set B, for the subset of sites within marine reserves (Table 1). This approach allowed us to assess the effect of pro-tection level among sites (model set A) and analyze the variation of predatory fish biomass within reserves, where fishing is theoretically ab-sent but enforcement varies among sites (model set B). Within each model set, we modeled separately those covariates that were correlated (table S6), eliminating factors that did not improve model fit. To verify the lack of multicollinearity among covariates, we calculated the vari-ance inflation factors (VIFs) after fitting the models. We sequentially removed and modeled separately each covariate for which the VIF value was above 2 (66).
All the human-related variables, except“distance to population centers,”explained some of the variation of predatory fish biomass among sites in the single-variable models (table S6). The“log of coastal development within 50 km”(hereafter coastal development) yielded better goodness of fit (that is, the lowest AICcand the highest weights) when considering all sites. However, for the subset of sites within marine reserves, the“log of humans within 50 km”(hereafter human population) showed higher weights for total predators and piscivore-invertivore biomass, whereas the“log of cultivated land within 50 km”(hereafter cultivated land) had the highest weights for apex predators. We selected
“minimum monthly sea surface temperature”(hereafter temperature), “reef area within 5 km”(hereafter“reef area”), and“mangrove perimeter within 5 km”(hereafter“mangrove”) because they had the highest AICc weights (table S6). We discarded physical variables such as“wave expo-sure,” “depth,” “distance to deeper water,” “minimum distance to man-grove,” “distance to reef breaks,”and the biotic variable“macroalgal cover”because they did not contribute to model fit in exploratory models. Different combinations of noncorrelated variables were considered can-didate predictors for predatory fish biomass.
We evaluated the relationship between the selected set of variables and the biomass of predatory reef fish (apex predators, piscivore-invertivores, and total predators) with GLMMs (67) fitted by maximum likelihood (Laplace approximation), in which reef sites, region, and year of survey were nested and coded as random effects and the explanatory variables as fixed effects. Exploratory analysis showed that predatory fish biomass did not change between years of survey. Thus, this random structure was used to nest the variance and account for the spatial autocorrelation observed in the raw data (67,68). The biomass of total predators and piscivore-invertivores was modeled with a Gaussian distribution and log link. For apex predators, we used a zero-inflated model with Gaus-sian error structure and log link to account for the excess of zeroes in the biomass distribution. The biomass of all fish groups, including response and predictors, was log10(x+ 1)–transformed to improve homogeneity of variance and model fit. Numerical covariates were standardized and centered (mean of 0 and SD of 1) to aid in model comparisons. Meaningful interactions and quadratic terms were included in exploratory models.
A multimodel inference approach and model averaging based on AICcweights (DAICc< 2, whereSAICcweights > 0.95) were used to select the variables included in the best models within each set (Table 1) (69). For the final models, we calculated a pseudocoefficient of determina-tion for GLMMs (pseudo-R2), interpreted as the variance explained by both fixed and random factors, that is, the entire model (70). Homoge-neous and normal distribution errors of final models were confirmed in the plot of residuals against fitted values and by using the normal scores of standardized residuals deviance, respectively (fig. S6) (67). Spline spa-tial correlograms were plotted to corroborate that the final model resid-uals were independent and not spatially autocorrelated (fig. S7) (67). All analyses were performed in R v.3.03 (71) using the packages lme4 v.0.99-2 (72) and glmmADMB v.0.8.0 (73) for GLMMs and MuMIn v.1.15.6 (74) for model averaging.
Carrying capacity prediction
Predicted means and 95% confidence intervals per site were obtained by bootstrapping (section S5).
SUPPLEMENTARY MATERIALS
Supplementary material for this article is available at http://advances.sciencemag.org/cgi/ content/full/3/3/e1601303/DC1
table S1. Estimates of current and potential average biomass (±SE) (in g m−2) of predatory reef fishes in the absence of humans (that is, coastal development) while categorizing every site as an NTZ (that is, no fishing).
table S2. Study sites, site codes, regions, and protection level.
table S3. Fish trophic guilds, species taxonomic information, and allometric parameters used to calculate biomass.
table S4. Summary of preliminary, anthropogenic, physical, biotic, and management-related predictors used in the analysis.
table S5. Spearman’s rank-order (rs) correlation matrix for response and explanatory variables.
table S6. Covariate selection procedure for closely related variables for all predators and each predator group based on AICc (AIC-corrected for small samples).
section S1. Detailed description of reef fish biomass spatial variation.
section S2. Detailed results of the relationships between predatory fish biomass and cofactors. section S3. Detailed discussion of the relationships between predatory fish biomass and cofactors and their potential underlying mechanisms.
section S4. Detailed description of covariates.
section S5. Analysis and R code to predict total predator biomass in the absence of humans, considering all sites as no fishing areas based on the best explanatory model from Table 1. fig. S1. Boxplot of total fish.
fig. S2. Scatterplots of the mean proportion of trophic guilds per site and survey year. fig. S3. Scatterplots of the mean biomass of predators (apex predator + piscivores-invertivore) and lower trophic guilds across sites.
fig. S4. Main drivers of spatial variation in predatory reef fish biomass. fig. S5. Relationship between reef structural complexity and fish trophic guilds.
fig. S6. Plots of residuals versus fitted values (left) and normal scores of standardized residual deviance (right) for the final models (sets A and B) of total predator biomass.
fig. S7. Plots of the spline correlogram function against distance. References (75–132)
REFERENCES AND NOTES
1. J. A. Estes, J. Terborgh, J. S. Brashares, M. E. Power, J. Berger, W. J. Bond, S. R. Carpenter, T. E. Essington, R. D. Holt, J. B. C. Jackson, R. J. Marquis, L. Oksanen, T. Oksanen, R. T. Paine, E. K. Pikitch, W. J. Ripple, S. A. Sandin, M. Scheffer, T. W. Schoener, J. B. Shurin, A. R. E. Sinclair, M. E. Soulé, R. Virtanen, D. A. Wardle, Trophic downgrading of planet Earth.Science333, 301–306 (2011).
2. W. J. Ripple, J. A. Estes, R. L. Beschta, C. C. Wilmers, E. G. Ritchie, M. Hebblewhite, J. Berger, B. Elmhagen, M. Letnic, M. P. Nelson, O. J. Schmitz, D. W. Smith, A. D. Wallach, A. J. Wirsing, Status and ecological effects of the world’s largest carnivores.Science343, 1241484 (2014).
3. D. J. McCauley, M. L. Pinsky, S. R. Palumbi, J. A. Estes, F. H. Joyce, R. R. Warner, Marine defaunation: Animal loss in the global ocean.Science347, 1255641 (2015). 4. J. Terborgh, J. A. Estes,Trophic Cascades: Predators, Prey, and the Changing Dynamics of
Nature(Island Press, 2010).
5. N. K. Dulvy, R. P. Freckleton, N. V. C. Polunin, Coral reef cascades and the indirect effects of predator removal by exploitation.Ecol. Lett.7, 410–416 (2004).
6. J. K. O’Leary, T. R. McClanahan, Trophic cascades result in large-scale coralline algae loss through differential grazer effects.Ecology91, 3584–3597 (2010).
7. S. Jennings, N. V. C. Polunin, Impacts of predator depletion by fishing on the biomass and diversity of non-target reef fish communities.Coral Reefs16, 71–82 (1997).
8. I. M. Côté, I. Mosqueira, J. D. Reynolds, Effects of marine reserve characteristics on the protection of fish populations: A meta-analysis.J. Fish Biol.59, 178–189 (2001). 9. N. K. Dulvy, N. V. C. Polunin, A. C. Mill, N. A. J. Graham, Size structural change in lightly
exploited coral reef fish communities: Evidence for weak indirect effects.Can. J. Fish. Aquat. Sci.61, 466–475 (2004).
10. J. L. Blanchard, N. K. Dulvy, S. Jennings, J. R. Ellis, J. K. Pinnegar, A. Tidd, L. T. Kell, Do climate and fishing influence size-based indicators of Celtic Sea fish community structure?ICES J. Mar. Sci.62, 405–411 (2005).
11. N. A. J. Graham, N. K. Dulvy, S. Jennings, N. V. C. Polunin, Size-spectra as indicators of the effects of fishing on coral reef fish assemblages.Coral Reefs24, 118–124 (2005). 12. K. Newton, I. M. Côté, G. M. Pilling, S. Jennings, N. K. Dulvy, Current and future
sustainability of island coral reef fisheries.Curr. Biol.17, 655–658 (2007).
13. T. R. McClanahan, C. C. Hicks, E. S. Darling, Malthusian overfishing and efforts to overcome it on Kenyan coral reefs.Ecol. Appl.18, 1516–1529 (2008). 14. T. R. McClanahan, N. A. J. Graham, M. A. MacNeil, J. E. Cinner, Biomass-based
targets and the management of multispecies coral reef fisheries.Conserv. Biol.29, 409–417 (2014).
15. C. D. Stallings, Fishery-independent data reveal negative effect of human population density on Caribbean predatory fish communities.PLOS ONE4, e5333 (2009). 16. I. D. Williams, B. L. Richards, S. A. Sandin, J. K. Baum, R. E. Schroeder, M. O. Nadon,
B. Zgliczynski, P. Craig, J. L. McIlwain, R. E. Brainard, Differences in reef fish assemblages between populated and remote reefs spanning multiple archipelagos across the central and western pacific.J. Mar. Biol.2011, 14 (2011).
17. W. D. Robbins, M. Hisano, S. R. Connolly, J. H. Choat, Ongoing collapse of coral-reef shark populations.Curr. Biol.16, 2314–2319 (2006).
18. C. A. Ward-Paige, C. Mora, H. K. Lotze, C. Pattengill-Semmens, L. McClenachan, E. Arias-Castro, R. A. Myers, Large-scale absence of sharks on reefs in the greater-Caribbean: A footprint of human pressures.PLOS ONE5, e11968 (2010).
19. B. L. Richards, I. D. Williams, O. J. Vetter, G. J. Williams, Environmental factors affecting large-bodied coral reef fish assemblages in the Mariana Archipelago.PLOS ONE7, e31374 (2012).
20. M. O. Nadon, J. K. Baum, I. D. Williams, J. M. Mcpherson, B. J. Zgliczynski, B. L. Richards, R. E. Schroeder, R. E. Brainard, Re‐creating missing population baselines for Pacific reef sharks.Conserv. Biol.26, 493–503 (2012).
21. J. R. Rizzari, A. J. Frisch, K. A. Magnenat, Diversity, abundance, and distribution of reef sharks on outer-shelf reefs of the Great Barrier Reef, Australia.Mar. Biol. 161, 2847–2855 (2014).
22. J. B. C. Jackson, M. X. Kirby, W. H. Berger, K. A. Bjorndal, L. W. Botsford, B. J. Bourque, R. H. Bradbury, R. Cooke, J. Erlandson, J. A. Estes, T. P. Hughes, S. Kidwell, C. B. Lange, H. S. Lenihan, J. M. Pandolfi, C. H. Peterson, R. S. Steneck, M. J. Tegner, R. R. Warner, Historical overfishing and the recent collapse of coastal ecosystems.Science293, 629–638 (2001).
23. J. M. Pandolfi, R. H. Bradbury, E. Sala, T. P. Hughes, K. A. Bjorndal, R. G. Cooke, D. McArdle, L. McClenachan, M. J. H. Newman, G. Paredes, R. R. Warner, J. B. C. Jackson, Global trajectories of the long-term decline of coral reef ecosystems.Science301, 955–958 (2003).
24. H. K. Lotze, B. Worm, Historical baselines for large marine animals.Trends Ecol. Evol.24, 254–262 (2009).
25. S. Jennings, N. V. C. Polunin, Effects of fishing effort and catch rate upon the structure and biomass of Fijian reef fish communities.J. Appl. Ecol.33, 400–412 (1996). 26. I. Mosquera, I. M. Côté, S. Jennings, J. D. Reynolds, Conservation benefits of marine
reserves for fish populations.Anim. Conserv.3, 321–332 (2000).
27. G. R. Russ, A. C. Alcala, Marine reserves: Rates and patterns of recovery and decline of predatory fish, 1983-2000.Ecol. Appl.13, 1553–1565 (2003).
28. T. R. McClanahan, N. A. J. Graham, J. M. Calnan, M. A. MacNeil, Toward pristine biomass: Reef fish recovery in coral reef marine protected areas in Kenya.Ecol. Appl.17, 1055–1067 (2007).
29. T. R. McClanahan, N. A. J. Graham, M. A. MacNeil, N. A. Muthiga, J. E. Cinner, J. H. Bruggemann, S. K. Wilson, Critical thresholds and tangible targets for ecosystem-based management of coral reef fisheries.Proc. Natl. Acad. Sci. U.S.A.108, 17230–17233 (2011).
30. K. A. Karr, R. Fujita, B. S. Halpern, C. V. Kappel, L. Crowder, K. A. Selkoe, P. M. Alcolado, D. Rader, Thresholds in Caribbean coral reefs: Implications for ecosystem-based fishery management.J. Appl. Ecol.52, 402–412 (2015).
31. M. A. MacNeil, N. A. J. Graham, J. E. Cinner, S. K. Wilson, I. D. Williams, J. Maina, S. Newman, A. M. Friedlander, S. Jupiter, N. V. C. Polunin, T. R. McClanahan, Recovery potential of the world’s coral reef fishes.Nature520, 341–344 (2015).
32. E. E. DeMartini, A. M. Friedlander, S. A. Sandin, E. Sala, Differences in fish-assemblage structure between fished and unfished atolls in the northern Line Islands, central Pacific.Mar. Ecol. Prog. Ser.365, 199–215 (2008).
33. C. Mora, A clear human footprint in the coral reefs of the Caribbean.Proc. Biol. Sci.275, 767–773 (2008).
34. S. A. Sandin, J. E. Smith, E. E. DeMartini, E. A. Dinsdale, S. D. Donner, A. M. Friedlander, T. Konotchick, M. Malay, J. E. Maragos, D. Obura, O. Pantos, G. Paulay, M. Richie, F. Rohwer, R. E. Schroeder, S. Walsh, J. B. C. Jackson, N. Knowlton, E. Sala, Baselines and degradation of coral reefs in the Northern Line Islands.PLOS ONE3, e1548 (2008). 35. I. D. Williams, J. K. Baum, A. Heenan, K. M. Hanson, M. O. Nadon, R. E. Brainard, Human,
oceanographic and habitat drivers of central and western Pacific coral reef fish assemblages.PLOS ONE10, e0120516 (2015).
36. J. F. Bruno, Coral reefs: Building a better crystal ball.Curr. Biol.23, R473–R475 (2013). 37. B. Worm, M. Sandow, A. Oschlies, H. K. Lotze, R. A. Myers, Global patterns of predator
diversity in the open oceans.Science309, 1365–1369 (2005).
E. L. C. Shepard, V. J. Wearmouth, R. P. Wilson, M. J. Witt, J. D. Metcalfe, Scaling laws of marine predator search behaviour.Nature451, 1098–1102 (2008).
39. N. Tamburello, I. M. Côté, N. K. Dulvy, Energy and the scaling of animal space use.
Am. Nat.186, 196–211 (2015).
40. M. E. Hunsicker, L. Ciannelli, K. M. Bailey, J. A. Buckel, J. W. White, J. S. Link, T. E. Essington, S. Gaichas, T. W. Anderson, R. D. Brodeur, K.-S. Chan, K. Chen, G. Englund, K. T. Frank, V. Freitas, M. A. Hixon, T. Hurst, D. W. Johnson, J. F. Kitchell, D. Reese, G. A. Rose, H. Sjodin, W. J. Sydeman, H. W. van der Veer, K. Vollset, S. Zador, Functional responses and scaling in predator–prey interactions of marine fishes: Contemporary issues and emerging concepts.Ecol. Lett.14, 1288–1299 (2011).
41. C. Mellin, J. Ferrarisb, R. Galzinc, M. Harmelin-Viviend, M. Kulbickib, T. Lison de Lomae, Natural and anthropogenic influences on the diversity structure of reef fish communities in the Tuamotu Archipelago (French Polynesia).Ecol. Model.218, 182–187 (2008). 42. K. T. Frank, B. Petrie, N. L. Shackell, The ups and downs of trophic control in continental
shelf ecosystems.Trends Ecol. Evol.22, 236–242 (2007).
43. D. J. McCauley, H. S. Young, R. B. Dunbar, J. A. Estes, B. X. Semmens, F. Micheli, Assessing the effects of large mobile predators on ecosystem connectivity.Ecol. Appl.22, 1711–1717 (2012).
44. M. J. Caley, M. H. Carr, M. A. Hixon, T. P. Hughes, G. P. Jones, B. A. Menge, Recruitment and the local dynamics of open marine populations.Annu. Rev. Ecol. Syst. 27, 477–500 (1996).
45. M. A. Hixon, J. P. Beets, Predation, prey refuges, and the structure of coral-reef fish assemblages.Ecol. Monogr.63, 77–101 (1993).
46. M. A. Hixon, M. H. Carr, Synergistic predation, density dependence, and population regulation in marine fish.Science277, 946–949 (1997).
47. P. J. Mumby, A. J. Edwards, J. E. Arias-González, K. C. Lindeman, P. G. Blackwell, A. Gall, M. I. Gorczynska, A. R. Harborne, C. L. Pescod, H. Renken, C. C. C. Wabnitz, G. Llewellyn, Mangroves enhance the biomass of coral reef fish communities in the Caribbean.Nature427, 533–536 (2004).
48. J. K. Baum, R. A. Myers, D. G. Kehler, B. Worm, S. J. Harley, P. A. Doherty, Collapse and conservation of shark populations in the Northwest Atlantic.Science299, 389–392 (2003). 49. R. A. Myers, B. Worm, Extinction, survival or recovery of large predatory fishes.Philos.
Trans. R. Soc. Lond. B Biol.360, 13–20 (2005).
50. M. J. H. Newman, G. A. Paredes, E. Sala, J. B. C. Jackson, Structure of Caribbean coral reef communities across a large gradient of fish biomass.Ecol. Lett.9, 1216–1227 (2006). 51. A. M. Friedlander, E. E. DeMartini, Contrasts in density, size, and biomass of reef
fishes between the northwestern and the main Hawaiian islands: The effects of fishing down apex predators.Mar. Ecol. Prog. Ser.230, 253–264 (2002).
52. C. Ward-Paige, J. Mills Flemming, H. K. Lotze, Overestimating fish counts by non-instantaneous visual censuses: Consequences for population and community descriptions.PLOS ONE5, e11722 (2010).
53. F. Pina-Amargós, G. González-Sansón, F. Martín-Blanco, A. Valdivia, Evidence for protection of targeted reef fish on the largest marine reserve in the Caribbean.PeerJ2, e274 (2014).
54. J. C. Lang, K. W. Marks, P. A. Kramer, P. Richards Kramer, R. N. Ginsburg,AGRRA Protocols Version 5.4. Atlantic and Gulf Rapid Reef Assessment(University of Miami, 2010). 55. D. J. McCauley, K. A. McLean, J. Bauer, H. S. Young, F. Micheli, Evaluating the
performance of methods for estimating the abundance of rapidly declining coastal shark populations.Ecol. Appl.22, 385–392 (2012).
56. R. Froese, D. Pauly, FishBase; www.fishbase.org.
57. H. Vallès, H. A. Oxenford, The utility of simple fish community metrics for evaluating the relative influence of fishing vs. other environmental drivers on Caribbean reef fish communities.Fish Fish.16, 649–667 (2015).
58. S. Jennings, N. V. C. Polunin, Relationships between catch and effort in Fijian multispecies reef fisheries subject to different levels of exploitation.Fisheries Manag. Ecol.2, 89–101 (1995).
59. S. Jennings, J. L. Blanchard, Fish abundance with no fishing: Predictions based on macroecological theory.J. Anim. Ecol.73, 632–642 (2004).
60. M. R. Heupel, D. M. Knip, C. A. Simpfendorfer, N. K. Dulvy, Sizing up the ecological role of sharks as predators.Mar. Ecol. Prog. Ser.495, 291–298 (2014).
61. K. Warren-Rhodes, Y. Sadovy, H. Cesar, Marine ecosystem appropriation in the Indo-Pacific: A case study of the live reef fish food trade.AMBIO J. Hum. Environ.32, 481–488 (2003). 62. J. P. Hawkins, C. M. Roberts, Effects of artisanal fishing on Caribbean coral reefs.
Conserv. Biol.18, 215–226 (2004).
63. C. Mora, O. Aburto-Oropeza, A. A. Bocos, P. M. Ayotte, S. Banks, A. G. Bauman, M. Beger, S. Bessudo, D. J. Booth, E. Brokovich, A. Brooks, P. Chabanet, J. E. Cinner, J. Cortés, J. J. Cruz-Motta, A. C. Magaña, E. E. DeMartini, G. J. Edgar, D. A. Feary, S. C. A. Ferse, A. M. Friedlander, K. J. Gaston, C. Gough, N. A. J. Graham, A. Green, H. Guzman, M. Hardt, M. Kulbicki, Y. Letourneur, A. L. Pérez, M. Loreau, Y. Loya, C. Martinez,
I. Mascareñas-Osorio, T. Morove, M.-O. Nadon, Y. Nakamura, G. Paredes, N. V. C. Polunin, M. S. Pratchett, H. R. Bonilla, F. Rivera, E. Sala, S. A. Sandin, G. Soler, R. Stuart-Smith, E. Tessier, D. P. Tittensor, M. Tupper, P. Usseglio, L. Vigliola, L. Wantiez, I. Williams,
S. K. Wilson, F. A. Zapata, Global human footprint on the linkage between biodiversity and ecosystem functioning in reef fishes.PLOS Biol.9, e1000606 (2011).
64. T. D. Brewer, J. E. Cinner, R. Fisher, A. Green, S. K. Wilson, Market access, population density, and socioeconomic development explain diversity and functional group biomass of coral reef fish assemblages.Glob. Environ. Chang.22, 399–406 (2012).
65. J. E. Cinner, N. A. J. Graham, C. Huchery, M. A. Macneil, Global effects of local human population density and distance to markets on the condition of coral reef fisheries.
Conserv. Biol.27, 453–458 (2013).
66. M. H. Graham, Confronting multicollinearity in ecological multiple regression.Ecology 84, 2809–2815 (2003).
67. A. Zuur, E. N. Ieno, N. Walker, A. A. Saveliev, G. M. Smith,Mixed Effects Models and Extensions in Ecology with R(Springer, 2009).
68. B. M. Bolker, M. E. Brooks, C. J. Clark, S. W. Geange, J. R. Poulsen, M. H. H. Stevens, J.-S. S. White, Generalized linear mixed models: A practical guide for ecology and evolution.Trends Ecol. Evol.24, 127–135 (2009).
69. K. P. Burnham, D. R. Anderson,Model Selection and Multimodel Inference: A Practical Information-Theoretic Approach(Springer, ed. 2, 2002).
70. S. Nakagawa, H. Schielzeth, A general and simple method for obtainingR2from generalized linear mixed-effects models.Methods Ecol. Evol.4, 133–142 (2013). 71. R Development Core Team,R: A Language and Environment for Statistical Computing
(R Foundation for Statistical Computing, 2011); www.R-project.org.
72. D. Bates, M. Mächler, B. Bolker, S. Walker, Fitting linear mixed-effects models using lme4.
J. Stat. Softw.67, 1–48 (2015).
73. H. Skaug, D. Fournier, A. Nielsen, A. Magnusson, B. Bolker,Generalized Linear Mixed Models Using‘AD Model Builder’. R Package Version 0.7(2013).
74. K. Barton,MuMIn: Multi-Model Inference. R Package Version 1.15.6(2016); http://CRAN.R-project.org/package=MuMIn.
75. B. A. Thompson, M. Beasley, C. A. Wilson, Age distribution and growth of greater amberjack,Seriola dumerili, from the north-central Gulf of Mexico.Fish. Bull.97, 362–371 (1999).
76. K. Pakoa, Vital statistics of marine fishes of Vanuatu.Naga21, 27–29 (1998). 77. R. Claro, J. P. García-Arteaga, inEcología de los Peces Marinos de Cuba, R. Claro, Ed.
(Instituto de Oceanologia Academia de Ciencias de Cuba and Centro de Investigaciones de Quintana Roo, 1994), pp. 321–402.
78. J. P. García-Arteaga, R. Claro, S. Valle, Length-weight relationships of Cuban marine fishes.Naga20, 38–43 (1997).
79. International Game Fish Association,Database of IGFA Angling Records Until 2001
(International Game Fish Association, 2001); www.igfa.org/Fish/Fish-Database.aspx. 80. R. E. Crabtree, E. C. Cyr, J. M. Dean, Age and growth of tarpon,Megalops atlanticus, from
South Florida waters.Fish. Bull.93, 619–628 (1995).
81. J. A. Bohnsack, D. E. Harper,Length-Weight Relationships of Selected Marine Reef Fishes from the Southeastern United States and the Caribbean(NOAA Technical
Memorandum NMFS-SEFC-215, National Technical Information Service, 1988), p. 35. 82. S. C. Manickchand-Heileman, D. A. T. Phillip, Age and growth of the yellowedge
grouper,Epinephelus flavolimbatus, and the yellowmouth grouper,Mycteroperca interstitialis, off Trinidad and Tobago.Fish. Bull.98, 290–298 (2000).
83. J. P. García-Arteaga, Y. S. Reshetnikov, Age and growth of the barjack (Caranx ruber) off the coast of Cuba.J. Ichthyol.25, 120–131 (1985).
84. Y. Bouchon-Navaro, C. Bouchon, D. Kopp, M. Louis, Weight–length relationships for 50 fish species collected in seagrass beds of the Lesser Antilles.J. Appl. Ichthyol. 22, 322–324 (2006).
85. IGFA Staff, R. Crawford, Eds.World Record Game Fishes, 1993(The International Game Fish Association, 1993).
86. R. Claro, Ecología y ciclo de vida de la rabirrubia,Ocyurus chrysurus(Bloch), en la plataforma cubana. I. Identidad, distribución, hábitat, reproducción y alimentación.
Rep. Invest. Inst. Oceanol. Acad. Cienc.15, 1–34 (1983).
87. S. J. Green, J. L. Akins, I. M. Côté, Foraging behaviour and prey consumption in the Indo-Pacific lionfish on Bahamian coral reefs.Mar. Ecol. Prog. Ser.433, 159–167 (2011). 88. J. N. De Araujo, A. S. Martins, Age and growth of coney (Cephalopholis fulva), from the
central coast of Brazil.J. Mar. Biol. Assoc. U.K.86, 187–191 (2006).
89. J. E. Randall, Tagging reef fishes in the Virgin Islands.Proc. Gulf Caribb. Fish. Inst.14, 201–241 (1962).
90. L. H. Bullock, M. D. Murphy, M. F. Godcharles, M. E. Mitchell, Age, growth, and reproduction of jewfishEpinephelus itajarain the eastern Gulf of Mexico.Fish. Bull.90, 243–249 (1992).
91. R. Froese, J. T. Thorson, R. B. Reyes Jr., A Bayesian approach for estimating length-weight relationships in fishes.J. Appl. Ichthyol.30, 78–85 (2014).
92. R. E. Crabtree, P. B. Hood, D. Snodgrass, Age, growth, and reproduction of permit (Trachinotus falcatus) in Florida waters.Fish. Bull.100, 26–34 (2002).
94. V. C. Gaut, J. L. Munro, The biology, ecology and bionomics of the grunts, Pomadasyidae, inCaribbean Coral Reef Fishery Resources(International Center for Living Aquatic Resources Management, 1983), pp. 110–141.
95. M. T. Oliveira, M. N. Santos, R. Coelho, V. Monteiro, A. Martins, P. G. Lino, Weight–length and length–length relationships for reef fish species from the Cape Verde
Archipelago (tropical north-eastern Atlantic).J. Appl. Ichthyol.31, 236–241 (2015). 96. F. Torres Jr., Tabular data on marine fishes from Southern Africa. Part 1: Length-weight
relationships.Fishbyte9, 50–53 (1991).
97. A. M. Vaz-dos-Santos, B. Gris, A. M. Vaz-dos-Santos, B. Gris, Length-weight relationships of the ichthyofauna from a coastal subtropical system: A tool for biomass estimates and ecosystem modelling.Biota Neotrop.16, e20160192 (2016).
98. S. Jennings, F. Mélin, J. L. Blanchard, R. M. Forster, N. K. Dulvy, R. W. Wilson, Global-scale predictions of community and ecosystem properties from simple ecological theory.
Proc. Biol. Sci.275, 1375–1383 (2008).
99. E. Chassot, S. Bonhommeau, N. K. Dulvy, F. Mélin, R. Watson, D. Gascuel, O. Le Pape, Global marine primary production constrains fisheries catches.Ecol. Lett.13, 495–505 (2010). 100. S. K. Wilson, N. A. J. Graham, N. V. C. Polunin, Appraisal of visual assessments of habitat
complexity and benthic composition on coral reefs.Mar. Biol.151, 1069–1076 (2007). 101. N. A. J. Graham, K. L. Nash, The importance of structural complexity in coral reef
ecosystems.Coral Reefs32, 315–326 (2013).
102. L. Alvarez-Filip, N. K. Dulvy, J. A. Gill, I. M. Côté, A. R. Watkinson, Flattening of Caribbean coral reefs: Region-wide declines in architectural complexity.Proc. Biol. Sci.276, 3019–3025 (2009).
103. P. L. Munday, G. P. Jones, M. S. Pratchett, A. J. Williams, Climate change and the future for coral reef fishes.Fish Fish.9, 261–285 (2008).
104. I. Nagelkerken, C. M. Roberts, G. van der Velde, M. Dorenbosch, M. C. van Riel, E. Cocheret de la Morinière, P. H. Nienhuis, How important are mangroves and seagrass beds for coral-reef fish? The nursery hypothesis tested on an island scale.Mar. Ecol. Prog. Ser.244, 299–305 (2002).
105. D. Chapman, E. A. Babcock, S. H. Gruber, J. D. Dibattista, B. R. Franks, S. A. Kessel, T. Guttridge, E. K. Pikitch, K. A. Feldheim, Long-term natal site-fidelity by immature lemon sharks (Negaprion brevirostris) at a subtropical island.Mol. Ecol.18, 3500–3507 (2009).
106. Y. V. Jhala, R. Gopal, Q. Qureshi,Status of Tigers, Co-Predators and Prey in India(TR 2011/ 003, National Tiger Conservation Authority, 2008).
107. A. R. E. Sinclair, K. Merzger, J. S. Brashares, A. Nkwabi, G. Sharam, J. M. Fryxell, Trophic cascades in African savanna: Serengeti as a case study, inTrophic Cascades: Predators, Prey, and Changing Dynamics of Nature, J. Terbogh, J. A. Estes, Eds. (Island Press, 2010), pp. 255–274.
108. R. C. Babcock, N. T. Shears, A. C. Alcala, N. S. Barrett, G. J. Edgar, K. D. Lafferty, T. R. McClanahan, G. R. Russ, Decadal trends in marine reserves reveal differential rates of change in direct and indirect effects.Proc. Natl. Acad. Sci. U.S.A.107, 18256–18261 (2010).
109. M. J. Paddack, J. D. Reynolds, C. Aguilar, R. S. Appeldoorn, J. Beets, E. W. Burkett, P. M. Chittaro, K. Clarke, R. Esteves, A. C. Fonseca, G. E. Forrester, A. M. Friedlander, J. García-Sais, G. González-Sansón, L. K. B. Jordan, D. B. McClellan, M. W. Miller, P. P. Molloy, P. J. Mumby, I. Nagelkerken, M. Nemeth, R. Navas-Camacho, J. Pitt, N. V. C. Polunin, M. C. Reyes-Nivia, D. R. Robertson, A. Rodríguez-Ramírez, E. Salas, S. R. Smith, R. E. Spieler, M. A. Steele, I. D. Williams, C. L. Wormald, A. R. Watkinson, I. M. Côté, Recent region-wide declines in Caribbean reef fish abundance.Curr. Biol.19, 590–595 (2009).
110. Socioeconomic Data and Applications Center,Global Rural-Urban Mapping Project—
Settlement Points(Columbia University, 2010); http://sedac.ciesin.columbia.edu/data/ set/gpw-v3-population-density/data-download.
111. E. Sanderson, M. Jaiteh, M. A. Levy, K. H. Redford, A. V. Wannebo, G. Woolmer, The human footprint and the last of the wild: The human footprint is a global map of human influence on the land surface, which suggests that human beings are stewards of nature, whether we like it or not .BioScience52, 891–904 (2002).
112. European Commission,Global Land Cover 2000—Products(European Commission, 2003); http://forobs.jrc.ec.europa.eu/products/glc2000/products.php.
113. L. J. McCook, Macroalgae, nutrients and phase shifts on coral reefs: Scientific issues and management consequences for the Great Barrier Reef.Coral Reefs18, 357–367 (1999). 114. A. S. Wenger, M. I. McCormick, I. M. McLeod, G. P. Jones, Suspended sediment alters
predator–prey interactions between two coral reef fishes.Coral Reefs32, 369–374 (2013).
115. C. Mora, S. Andrèfouët, M. J. Costello, C. Kranenburg, A. Rollo, J. Veron, K. J. Gaston, R. A. Myers, Coral reefs and the global network of marine protected areas.Science312, 1750–1751 (2006).
116. B. S. Halpern, The impact of marine reserves: Do reserves work and does reserve size matter?Ecol. Appl.13, 117–137 (2003).
117. J. Claudet, C. W. Osenberg, L. Benedetti-Cecchi, P. Domenici, J.-A. García-Charton, Á. Pérez-Ruzafa, F. Badalamenti, J. Bayle-Sempere, A. Brito, F. Bulleri, J.-M. Culioli,
M. Dimech, J. M. Falcón, I. Guala, M. Milazzo, J. Sánchez-Meca, P. J. Somerfield, B. Stobart, F. Vandeperre, C. Valle, S. Planes, Marine reserves: Size and age do matter.
Ecol. Lett.11, 481–489 (2008).
118. J. P. Kritzer, Effects of noncompliance on the success of alternative designs of marine protected-area networks for conservation and fisheries management.
Conserv. Biol.18, 1021–1031 (2004).
119. United Nations Environment Programme World Conservation Monitoring Centre, WorldFish Centre, World Resources Institute, The Nature Conservancy,Global Distribution of Warm-Water Coral Reefs, Compiled from Multiple Sources, Including the Millennium Coral Reef Mapping Project(United Nations Environment Programme World Conservation Monitoring Centre, 2010); http://data.unep-wcmc.org/datasets/1. 120. N. V. C. Polunin, C. M. Roberts, Greater biomass and value of target coral-reef fishes in
two small Caribbean marine reserves.Mar. Ecol. Prog. Ser.100, 167–176 (1993). 121. C. Giri, E. Ochieng, L. L. Tieszen, Z. Zhu, A. Singh, T. Loveland, J. Masek, N. Duke,Status
and Distribution of Mangrove Forests of the World Using Earth Observation Satellite Data
(United States Geological Survey, 2011); http://data.unep-wcmc.org/datasets/4. 122. M. J. Behrenfeld, P. G. Falkowski, Photosynthetic rates derived from satellite-based
chlorophyll concentration.Limnol. Oceanogr.42, 1–20 (1997).
123. Oregon State University,Ocean Productivity: Online VGPM Data(Oregon State University, 2013); http://orca.science.oregonstate.edu/1080.by.2160.monthly.hdf.vgpm.m.chl.m.sst.php. 124. National Oceanic and Atmospheric Administration,The AVHRR Pathfinder Version 5.2
Dataset(National Oceanic and Atmospheric Administration, 2013); www.nodc.noaa.gov/ SatelliteData/pathfinder4km/.
125. K. S. Casey, T. B. Brandon, P. Cornillon, R. Evans, inOceanography from Space, V. Barale, J. F. R. Gower, L. Alberotanza, Eds. (Springer Netherlands, 2010;
http://www.nodc.noaa.gov/SatelliteData/pathfinder4km/), pp. 273–287. 126. I. Chollett, P. J. Mumby, F. E. Muller-Karger, C. Hu, Physical environments of the
Caribbean Sea.Limnol. Oceanogr.57, 1233–1244 (2012).
127. I. Chollett, P. J. Mumby, Predicting the distribution ofMontastraeareefs using wave exposure.Coral Reefs31, 493–503 (2012).
128. A. R. Harborne, P. J. Mumby, K.Żychaluk, J. D. Hedley, P. G. Blackwell, Modeling the beta diversity of coral reefs.Ecology87, 2871–2881 (2011).
129. A. M. Friedlander, E. K. Brown, P. L. Jokiel, W. R. Smith, K. S. Rodgers, Effects of habitat, wave exposure, and marine protected area status on coral reef fish assemblages in the Hawaiian archipelago.Coral Reefs22, 291–305 (2003).
130. C. J. Fulton, D. R. Bellwood, Wave exposure, swimming performance, and the structure of tropical and temperate reef fish assemblages.Mar. Biol.144, 429–437 (2004). 131. J. H. Carleton, T. J. Done, Quantitative video sampling of coral reef benthos: Large-scale
application.Coral Reefs14, 35–46 (1995).
132. L. Alvarez-Filip, J. A. Gill, N. K. Dulvy, Complex reef architecture supports more small-bodied fishes and longer food chains on Caribbean reefs.Ecosphere2, 1–17 (2011).
Acknowledgments:We thank the Belize Fisheries Department, the Bahamas Fisheries Department, Comisión Nacional de Agricultura y Pesca in Mexico, and Centro de Inspección y Control Ambiental in Cuba for research permits. We also thank the staff of the Itajara research vessel in Cuba, Bahamas National Trust, the Bahamas Fisheries Department, FRIENDS of the Environment, D. Knowles, T. Higgs, C. Layman, and J. Pawlik for logistical support. We are thankful to L. Valdivia, L. Carr, S. Hackerott, K. Dubois, I. Vu, C. Fieseler, E. Duffy, L. Deignan, F. Pina, M. Armenteros, J. Rodriguez, and D. Munoz for field assistance and helpful discussions. We thank C. Layman, A. Hurlbert, C. Peterson, J. Baum, N. Dulvy, C. Mora, and anonymous reviewers for providing helpful comments that improved this manuscript.
Funding:This project was funded in part by a University of North Carolina at Chapel Hill Royster Society fellowship to A.V., by the Rufford Small Grants for Nature Conservation to C.E.C., by the National Geographic Society (grant #8514-08), by the University of North Carolina at Chapel Hill, and by an NSF grant (OCE-0940019) to J.F.B.Author contributions:A.V. designed the project. A.V., C.E.C., and J.F.B. performed the research and fieldwork. A.V. performed the data analysis. C.E.C. and J.F.B. contributed to data analysis and results discussion. A.V., C.E.C., and J.F.B. wrote the manuscript. A.V. claims responsibility for all figures in the main text and the Supplementary Materials.Competing interests:The authors declare that they have no competing interests.Data and materials availability:All data needed to evaluate the conclusions in the paper are present in the paper and/or the Supplementary Materials. Additional primary data and R code related to this paper may be requested from the authors.
Submitted 8 June 2016 Accepted 16 January 2017 Published 1 March 2017 10.1126/sciadv.1601303