SYSTEM PARAMETERS AND PERFORMANCE SPECIFICATIONS FOR THE APPLICATION OF DIFFRACTION ENHANCED IMAGING AND MULTIPLE
IMAGE RADIOGRAPHY TO BREAST IMAGING
Christopher Allen Parham
A dissertation submitted to the faculty of the University of North Carolina at Chapel Hill in partial fulfillment of the requirements for the degree of Doctor of Philosophy in the
Department of Biomedical Engineering.
Chapel Hill 2006
© 2006
ABSTRACT
CHRISTOPHER ALLEN PARHAM: System Parameters And Performance Specifications For The Application Of Diffraction Enhanced Imaging And Multiple
Image Radiography To Breast Imaging (Under the direction of Etta D. Pisano, M.D.)
The Diffraction Enhanced Imaging (DEI) method is a novel x-ray imaging technique that dramatically extends the capability of conventional x-ray imaging. X-ray imaging has traditionally been dependent on x-ray absorption to generate contrast, and is the physical mechanism of contrast in planar x-ray imaging and computed tomography. DEI utilizes the Bragg peak of perfect crystal diffraction to convert angular changes into intensity changes, providing a large change in intensity for a small change in angle. The use of a silicon analyzer crystal in the path of the x-ray beam generates two additional forms of image contrast, refraction and extinction. Objects that have very little absorption contrast may have considerable refraction and extinction contrast, this improving visualization and extending the utility of x-ray imaging. An area of medicine where this technique could have a dramatic impact is in breast imaging, where the key diagnostic structures often have low absorption contrast, especially in the early stages of disease. In order to develop a DEI clinical prototype imaging system, a systematic assessment of the engineering parameters for the breast
imaging application must be determined. This body of work investigates the primary imaging parameters of DEI (x-ray beam energy, crystal reflections, angular sampling) and
TABLE OF CONTENTS
Chapter Page
1. INTRODUCTION...1
1.1 Overview...1
1.2 Objectives ...2
1.3 Organization...3
2. OVERVIEW OF BREAST ANATOMY AND BREAST CANCER ...6
2.1 Epidemiology of Breast Cancer ...6
2.2 Anatomy and Development of the Human Breast ...7
2.3 Benign Conditions ...9
2.4 Pre-Malignant and Malignant Tumors...12
2.5 Mammography Classification Schemes for Malignancy...16
3. PHOTON INTERACTIONS WITH MATTER ...24
3.1 The Photoelectric Effect ...24
3.2 Breamsstrahlung and Characteristic X-rays...27
3.3 X-ray Absorption ...30
3.4 X-ray Refraction ...31
3.5 Coherent Scattering...33
3.7 Energy Deposition, Dose, and Health Effects ...37
4. OVERVIEW OF CURRENT MAINSTREAM IMAGING MODALITIES USED FOR BREAST IMAGING ...44
4.1 X-ray Imaging ...44
4.2 Ultrasound Imaging ...49
4.3 Magnetic Resonance Imaging...56
4.4 Computed Tomography ...66
4.5 Single Photon Emission Computed Tomography (SPECT) And Scintimammography ...72
4.6 Positron Emission Tomography (PET)...76
5. SCREEN FILM AND DIGITAL MAMMOGRAPHY ...82
5.1 Historical Overview of Mammography Development ...82
5.2 Clinical Trials and Evidence for Use ...85
5.3 Screen Film System Design Characteristics ...88
5.4 Computer Aided Diagnosis Applications for Mammography ...89
6. FUNDAMENTAL PHYSICAL PRINCIPLES OF DIFFRACTION ENHANCED IMAGING...93
6.1 Synchrotron X-ray Generation...93
6.2 Bragg’s Law of Diffraction...94
6.3 Properties of Diffraction Enhanced Imaging ...94
6.4 Experimental Setup at the National Synchrotron Light Source...98
7. MULTIPLE IMAGE RADIOGRAPHY ...101
8. IMAGING PROCEDURES AND QUALITY CONTROL FOR USING DIFFRACTION ENHANCED IMAGING AND
MULTIPLE IMAGE RADIOGRAPHY AT THE NATIONAL
SYNCHROTRON LIGHT SOURCE ...104
8.1 NSLS DEI acquisition parameters and system tuning...104
9. DEI/MIR SYSTEM STABILIZATION...109
9.1 Description of Crystal Alignment and Stability at the NSLS X-15A Beamline...109
9.2 Initial Thoughts Regarding Sources of Analyzer Drift...110
9.3 Theoretical Explanation of Thermal Drift ...111
9.4 Retrofitting of Aluminum Filter Assembly...112
9.5 Retrofitting of Monochromator Crystal Assembly ...114
9.6 Post-upgrade Stability...117
10. READER STUDY ANALYSIS OF SYSTEM PARAMETERS FOR DIFFRACTION ENHANCED IMAGING...123
10.1 Introduction...123
10.2 Experimental DEI Setup at the National Synchrotron Light Source ...124
10.3 Application of Research to Non-Synchrotron Based Imaging ...125
10.4 Methods...126
10.5 Results...132
10.6 Discussion ...135
10.7 Conclusion ...137
11. MULTI-PARAMETER, MULTI-ENERGY MEASUREMENTS OF BREAST TISSUE USING PLANAR MIR ...139
11.1 Introduction...139
11.3 Results...142
11.4 Discussion ...153
11.5 Conclusion ...154
12. ANALYSIS OF BREAST CANCER CONTRAST MECHANISMS USING MULTIPLE IMAGE RADIOGRAPHY...156
12.1 Introduction...156
12.2 Materials and Methods...157
12.3 Results...160
12.4 Discussion ...165
12.5 Conclusion ...167
13. APPLICATION OF DATA TO THE DEVELOPMENT OF A CLINICAL DIFFRACTION ENHANCED IMAGING/MULTIPLE IMAGE RADIOGRAPHY SYSTEM ...168
13.1 Introduction...168
13.2 Estimated Flux Requirements ...168
13.3 Incident X-ray Flux into Solid Angle Using an Emission Line Source ...169
13.4 X-ray Tube Flux...170
13.5 Estimated Image Acquisition Time ...171
13.6 Application of Research to a Non-Synchrotron Based Prototype DEI System...173
LIST OF TABLES
10.1: Summary of reader study data with respect to x-ray beam energy...135
10.2: Summary of reader study data with respect to crystal reflection...135
10.3: Summary of reader study data with respect to rocking curve position...135
12.1: MIR diameter calibration...161
12.2: MIR index of refraction calibration ...161
LIST OF FIGURES
2.1: Breast anatomy ...8
2.2: Graphical depiction of a breast fibroadenoma ...10
2.3: Full field mammogram with benign fibroadenoma ...11
2.4: Close up view of fibroadenoma ...11
2.5: Digital radiograph of a malignant mass ...17
2.6: Magnified view of malignant mass...18
2.7: Model of tumor development and detectability...19
2.8: Breast Imaging Reporting and Data System (BI-RADS) categories...23
3.1: Elementary depiction of the photoelectric effect ...24
3.2: Example of the photoelectric effect on the atomic level ...26
3.3: Generation of bremsstrahlung radiation ...28
3.4: Generation of Kα and Kβ characteristic x-rays ...29
3.5: X-ray attenuation ...31
3.6: Refraction of visible light ...32
3.7: Refraction of x-rays through a cylindrical Lucite rod ...33
3.8: Compton scatter in an atom ...35
3.9: Compton scatter from a free electron ...36
3.10: Radiation quality factors...39
3.11: Relative sensitivity of biological tissues to radiation ...40
3.12: Generation of a free radical through direct action ...41
3.13: X-ray induced indirect free radical formation ...42
4.2: Cross section of a double-emulsion film ...48
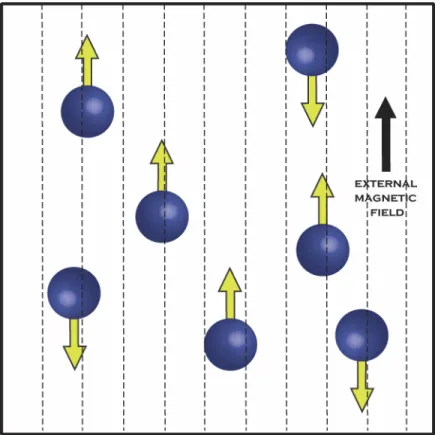
4.3: Protons with randomly distributed magnetic moments ...57
4.4: Protons with an external magnetic field applied, having both parallel and anti-parallel alignments...58
4.5: Net magnetization of protons in external magnetic field...60
4.6: Change in net magnetization after introduction of the RF pulse ...61
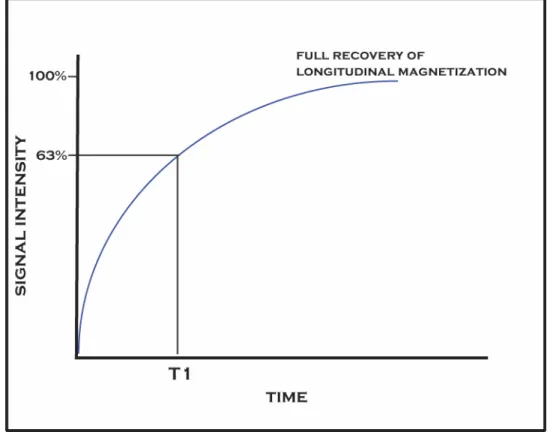
4.7: T1 Longitudinal relaxation curve ...62
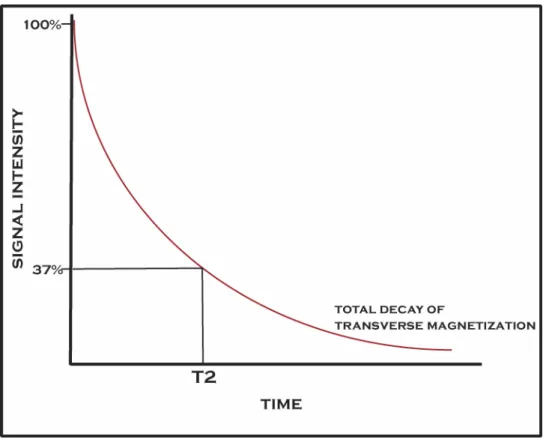
4.8: T2 transverse magnetization decay curve ...64
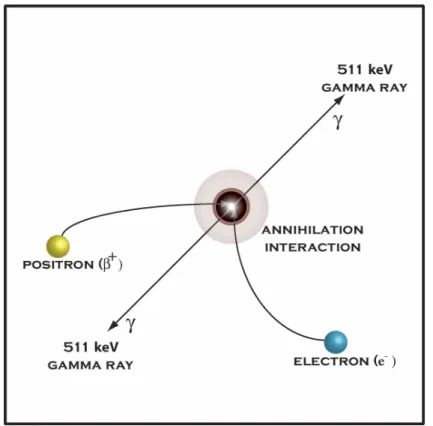
4.9: Annihilation interaction from positron-electron collision ...78
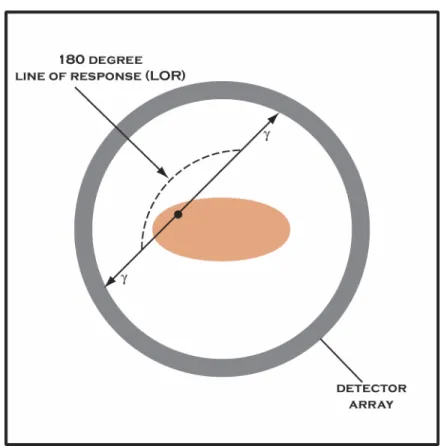
4.10: Coincidence detection in PET imaging ...79
6.1: National Sychrotron Light Source experimental floor ...93
6.2: Illustration demonstrating Bragg's law of x-ray diffraction ...94
6.3: Illustration of analyzer crystal rocking curve ...96
6.4: Passage of x-ray beam through the monochromator and analyzer crystal ...98
6.5: DEI setup at the NSLS X15A beamline ...99
8.1: Calculated Bragg angles for energy selection and DEI system tuning...105
8.2: Crystal theta and chi angles of rotation ...107
9.1: Aluminum filter heatsink ...113
9.2: Thermal lading on second monochromator crystal...115
9.3 Annotated graph of thermal loading on second monochromator crystal ...116
9.4 Overhead view of retrofitted second monochromator base and support plate with water cooling lines ...117
9.5: 18 keV DEI system stability test...120
9.7: 40 keV DEI system stability test...121
9.8: NSLS X-ray ring current during 40 keV stability tests ...121
10.1: Examples of Contrast-Detail Phantom at 18 keV...128
10.2: Examples of Contrast-Detail Phantom at 30 keV...128
10.3: MISTY Phantom regions of interest at 30 keV ...129
11.1: Contributions of absorption, incoherent scatter, and coherent scatter in breast tissue vs. energy ...140
11.2: Digital radiograph of breast specimen ...142
11.3: Synchrotron radiographs acquired at 18, 25, 30, 40, 50, and 60 keV...143
11.4: Breast specimen image using MIR at 18 keV with sampling parameters of ±5 microradians with a theta increment of 0.5 microradians...144
11.5: Breast specimen image using MIR at 25 keV with sampling parameters of ±5 microradians with a theta increment of 0.5 microradians...145
11.6: Breast specimen image using MIR at 30 keV with sampling parameters of ±5 microradians with a theta increment of 0.4 microradians...146
11.7: Breast specimen image using MIR at 40 keV with sampling parameters of ±4 microradians with a theta increment of 0.4 microradians...147
11.8: Breast specimen image using MIR at 50 keV with sampling parameters of ±3 microradians with a theta increment of 0.3 microradians. ...148
11.9: Breast specimen image using MIR at 60 keV with sampling parameters of ±2 microradians with a theta increment of 0.2 microradians...149
11.10: 18 keV dose distribution ...150
11.11: 25 keV dose distribution ...150
11.12: 30 keV dose distribution ...151
11.13: 40 keV dose distribution ...151
11.14: 50 keV dose distribution ...152
11.16: Photon flux vs. Energy used for MIR ...153
12.1: Estimation of fiber diameter using MIR ...158
12.2: Selection of fiber with relation to background ...159
12.3: Selection of fiber and background region...159
12.4: Nylon fiber refraction profile...160
12.5: Fitting of simulated cylinder to nylon fiber ...160
12.6: Nylon fiber fitting calibration values...162
12.7: Breast cancer specimen with spiculations 1-5 ...163
12.8: Breast cancer specimen with spiculations 6-10 ...163
12.9: Breast cancer specimen with spiculations 11-15 ...164
LIST OF ABBREVIATIONS
ALND axillary lymph node dissection BNL Brookhaven National Laboratory
CNB core needle biopsy
DEI diffraction enhanced imaging
DEI-CT diffraction enhanced imaging computed tomography
DNA deoxyribonucleic acid
DW Darwin width
FNA fine needle aspiration FWHM full width at half maximum MIR multiple image radiography
MIR-CT multiple image radiography computed tomography
MGD mean glandular dose
NNT number needed to treat
NSLS National Synchrotron Light Source PET positron emission tomography
Chapter 1: Introduction
1.1Overview
Diffraction Enhanced Imaging (DEI) is a novel x-ray imaging modality capable of generating image contrast from x-ray absorption, refraction, and ultra-small angle scatter (Chapman et al. 1997). Applications of this method to biology and materials science have generated impressive gains in both contrast and resolution, indicating the potential for use in mainstream medical imaging (Pisano et al. 2000; Chapman et al. 1998; Fiedler et al. 2004; Keryiläinen et al. 2005; Muehleman et al. 2004; Li et al. 2004). An area where DEI may be particularly effective is in breast imaging, where the diagnostic structures of interest often have low absorption contrast, making them difficult to see. Structures with low absorption contrast, such as the speculations extending from a malignant mass, have high refraction and ultra-small angle scatter contrast. The long term goal of the DEI research and development group is to design a DEI mammography system with the potential to increase the sensitivity and specificity of x-ray-based breast imaging. In order to accomplish this goal, the first step is to determine the synchrotron-based optimal performance characteristics for DEI breast imaging using.
energy, analyzer crystal reflection, and analyzer crystal rocking curve position are essential for determining what current x-ray sources may be compatible. In addition, it is essential to determine the contribution and importance of absorption, refraction, and ultra-small angle scatter have on structural visualization in the breast.
1.2Objectives
The goal of the research presented is to investigate the utility of Diffraction Enhanced Imaging and Multiple Image Radiography for the application of breast imaging, and in the process determine the optimal system parameters for this application both using a
synchrotron and conventional x-ray source.
Aim 1: To develop imaging and quality control procedures for breast imaging at the National Synchrotron Light Source, including standardization of image normalization and processing. Science requires precision, accuracy, and reproducibility, which is difficult to accomplish with manual processing of image plates.
Aim 2: To stabilize the crystal optics used in a DEI system to minimize or eliminate system instability and analyzer drift. In order to utilize more elaborate and complicated processing algorithms such as MIR and MIR-CT, maintaining a stable system over time is a mandatory prerequisite.
Aim 3: To perform a reader study using conventional mammography phantoms that investigates the primary DEI system parameters. This study provides insight into how the incident x-ray beam energy, analyzer crystal reflection, and rocking curve position affects image feature visualization.
multiple x-ray beam energies. This study builds upon the phantom based parameter study and investigates the energy dependence of absorption, refraction, and ultra-small angle scatter for breast tissue. The beam energies selected for the study area based on the characteristic x-ray energies for molybdenum and tungsten x-ray tubes.
Aim 5: To demonstrate that 60 keV x-rays can be used to generate diagnostically useful soft tissue images without relying on x-ray absorption. Producing soft tissue radiographs without absorption is a paradigm shift in x-ray imaging theory, relying on completely different contrast mechanisms.
Aim 6: To analyze the materials properties of breast cancer spiculations using Multiple Image Radiography and determine of these values are consistent across different specimens. In order to more accurately determine the optimal energy for a non-synchrotron based DEI/MIR system, determining which contrast mechanisms are necessary to produce diagnostically useful images is critical.
Aim 7: To generate the technical specifications and requirements for a non-synchrotron based laboratory DEI/MIR system.
1.3Organization
cancers appear on conventional mammograms. This chapter also provides a general description of how cancers are diagnosed and current methods of treatment.
The information presented in Chapter 3 provides an overview of x-ray generation, photonics, and photon interactions with matter. This chapter explains the physical mechanisms of x-ray absorption, refraction, and scatter and how they relate to DEI. The topics of energy deposition, dose measurement, and the associated health effects of radiation exposure are also discussed.
An overview of the physics, development, and use of the mainstream imaging modalities used for breast imaging is presented in Chapter 4. The modalities described are x-ray imaging, ultrasound, magnetic resonance imaging, computed tomography, single photon emission computed tomography, scintimammography, and positron emission tomography. Chapter 5 expands on the development of mammography, with special emphasis on the development of the first dedicated mammography unit and subsequent major improvements. A description of the clinical trials performed to assess the utility of mammography and mortality reduction are presented to give the reader an idea of what challenges will have to be overcome of DEI is to become a clinically useful imaging modality.
to separate the contrast mechanisms in breast tissue and aid in determining the optimal system parameters.
Chapter 8 describes the imaging method and quality control procedures developed for breast imaging at the National Synchrotron Light Source. Implementing these procedures using MIR required an extensive overhaul of the system optics to reduce system instability, which is described in Chapter 9.
An initial assessment of the optimal imaging parameters for DEI are presented in Chapter 10, utilizing breast imaging phantoms to determine how DEI performs under various system parameters. Chapter 11 build upon the initial parameter study by using actual breast
specimens and increasing the beam energy to 60 keV, an energy where there is nominal absorption contrast in soft tissue. This study also utilizes the Multiple Image Radiography technique to generate images representing an object’s x-ray absorption, refraction, and ultra-small angle scatter. An analysis of contrast mechanisms in breast cancer speculations are presented in Chapter 12.
Chapter 2: Overview of Breast Anatomy and Breast Cancer
2.1 Epidemiology of Breast Cancer
Breast cancer is currently the most common cancer in females, and is second only to lung cancer for cancer deaths in women. The most recent epidemiological studies indicate that an estimated 211,300 women will be diagnosed with breast cancer in 2003, and nearly 40,000 will die from this disease (Jamal et al. 2003). Approximately 1 in 10 women with a breast lump or abnormal mammogram will have a breast cancer (Kerlikowske et al. 2003).
The incidence of breast cancer is highest in North America and Northern Europe, and lowest in Asia and Africa. While the overall mortality rates from breast cancer have been relatively constant since 1950, there have been fluctuations among different subgroups. Mortality rates for women under 55 have decreased, while an increase has been observed for women over 55 (Chevarley and White 1997).
Women of higher socioeconomic status have an increased risk of developing breast cancer, with nearly a two-fold difference from the highest to lowest socioeconomic classes. The prevailing theory explaining this is a difference in educational and occupational trends that influence parity, age at first birth, and the age at menarche (Kelsey, Fischer and Holford 1981). Breast cancer is the most common cancer in women in every major ethnic group, but there are differences in incidence rates. Most ethnic differences are attributable to differences in lifestyle and socioeconomic status, some of which are also associated with treatment and survival. With a disparity in the utilization and availability of health care, an analysis based solely on race becomes confounded by other factors. Over the last two decades, the mortality rate from breast cancer has decreased by approximately 7% in younger white women.
African American women have yet to realize similar mortality reductions, and older African American women have experienced an increase in mortality, despite a lower incidence of disease than their white counterparts (Mandelblatt et al. 2004). While there are numerous factors that may be contributing to excess mortality, a portion may be due to low rates of screening, failure to receive timely and complete diagnostic follow-up, or receiving suboptimal treatment (Mandelblatt et al. 2004).
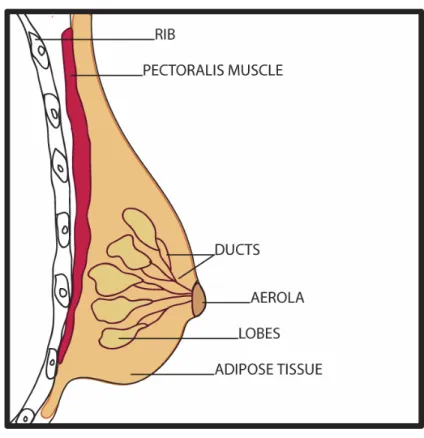
2.2Anatomy and Development of the Human Breast
FIGURE 2.1: Breast anatomy
Male and female breast development is similar until puberty, at which time the female breast undergoes significant hormonally-induced changes. Pre-pubertal development is marked by the creation, elongation, and branching of lactiferous ducts. Increasing levels of estrogen at menarche induces the development of the lobular terminal ducts (Bartow 1999). During puberty in females, the breast begins to grow and the aerolae enlarge. The lactiferous ducts lead to the formation of buds that form 15 to 20 lobules of glandular tissue (Moore 1992).
2.3 Benign Conditions
The most common benign breast conditions are fibrocystic changes, breast inflammation, and benign breast tumors. Fibrocystic changes can be classified as non-proliferative and proliferative. Non-proliferative fibrocystic changes are associated with an increase in the dense fibrous stroma and a cystic dilation of the terminal ducts. Since the terminal ducts are responsive to hormone levels, lumps associated with fibrocystic changes can fluctuate in size and tenderness during the menstrual cycle. Proliferative fibrocystic changes are proliferative epithelial changes that can not be predicted from clinical or radiographic studies. Ductal epithelial hyperplasia is the most common form and in some cases can lead to papillary structures within the lumen of the peripheral ducts, a condition also referred to as
papillomatosis (Bartow 1999). Histologically, fibrocystic changes occur in three stages. The first stage is marked by a proliferation of stroma, frequently in the upper outer quadrant of the breast, which leads to induration and tenderness. Progression leads to adenosis, which can result in cyst formation. Cysts at this stage range from microscopic to approximately 1 cm in diameter. In the later stages of fibrocystic change, larger cysts are present but with a decrease in pain experienced by the patient (Beckman 1998).
The most common benign tumor of the breast originates from the terminal duct lobular unit and is called a fibroadenoma. A fibroadenoma is a round, rubbery, and well
FIGURE 2.2: Graphical depiction of a breast fibroadenoma
FIGURE 2.3: Full field mammogram with benign fibroadenoma
Unfortunately, there is at least some ambiguity even when using a combination of mammography and ultrasound for characterization. If a portion of the lesion is obscured by structural noise and its borders are not clearly defined, further investigation, including biopsy, may be warranted.
Intraductal papilloma is another benign tumor occurring in middle-aged and older women that is often associated with a serous or bloody nipple discharge. An intraductal papilloma is a single tumor that is attached to the wall of the larger ducts by a fibrovascular stalk.
Benign tumors can also originate from the fatty tissue of the breast, but their
characteristics can make them difficult to distinguish from malignancy. Lipomas are benign tumors that are composed of mature fat cells, and are the most common mesenchymal tumor. They are generally a few centimeters in size but can be diffuse and rubbery. Fat necrosis is uncommon and usually the result of trauma, presenting as a solitary, tender, ill-defined mass. The radiographic similarities of fat necrosis with malignant conditions often requires further evaluation and biopsy to establish a diagnosis (Beckman 1998).
A disease found predominantly in the fifth and sixth decades of life is mammary duct ectasia, and can also mimic a carcinoma clinically and on a mammogram. Mammary duct ectasia refers to a dilation of the large and intermediate breast ducts, a result of the shortening and dilation of the subaerola as they involute. This condition is associated with chronic intraductal and periductal inflammation, and presents with a thick gray to black nipple discharge, pain, and nipple tenderness (Beckman 1998).
2.4 Pre-Malignant and Malignant Tumors
DCIS is a lesion which lies along a spectrum of disease that has the potential to progress from atypical hyperplasia to invasive breast cancer (Burstein et al. 2004). Changes in the surrounding breast parenchyma may be associated with DCIS, which can help in
radiographic detection. High-grade ductal carcinoma has been associated with the breakdown of the myoepithelial cell layer and basement membrane surrounding the ductal lumen,
proliferation of fibroblasts, lymphocyte infiltration, and angiogenesis in the surrounding stromal tissues (Burstein et al. 2004). Recent data indicates that DCIS represents a stage of disease in which the molecular changes that are found in invasive breast cancers are already present, but the lesion has not developed a fully malignant phenotype. The step leading to invasive disease is usually associated with a gain of function in the malignant cells and a concomitant loss of function and integrity in the surrounding normal tissues. Before the use of widespread screening mammography, DCIS was normally diagnosed after finding a palpable lesion or other atypical clinical finding that warranted further investigation. With the advent of widespread screening mammography, the incidence of DCIS has increased from 4800 cases in 1983 to more than 50,000 cases in 2004. Approximately 90 percent of ductal carcinomas in situ are diagnosed while they are clinically occult because of
Lobular carcinoma in-situ (LCIS) is a pre-malignant condition that has the potential to develop into breast cancer. In contrast to intraductal carcinoma, lobular carcinomas develop in the terminal duct lobular unit. The cells of LCIS are generally smaller and more
monotonous than cells in intraductal cancers. The cells are typically round, with regular nuclei and minute nuclei. These cells do not form papillary or cribiform structures, instead appearing as solid clusters that fill and distend the terminal ducts. However, the distention of the ductal system is normally less than that observed with ductal carcinoma in situ. The progression of lobular carcinoma in situ does not normally undergo central necrosis as often occurs with intraductal carcinoma, but microcalcifications may be present in the ducts (Bartow 1999). A lack of significant distention in the ducts combined with a reduced prevalence of associated microcalcifications makes lobular carcinoma in situ difficult to detect radiographically, especially in its early stages. Histologically a neoplastic lesion, LCIS has long been considered a marker for increased breast carcinoma risk rather than a precursor for invasive carcinoma, because it appears to confer an equally increased risk of breast carcinoma in both the contralateral and ipsilateral breasts (Hwang et al. 2004).
Invasive ductal carcinoma is the most common type of breast cancer, comprising 70 to 80 percent of invasive lesions. The invasion of malignant cells into the stroma usually causes a fibroblastic proliferation of the surrounding tissue known as desmoplasia. It is the
desmoplastic process that leads to the formation of a hard, fixed mass that is often the first clinical sign of ductal carcinoma (Bartow 1999).
1999). As with lobular carcinoma in situ, invasive lobular carcinoma is characterized by small, round cells that have little cytoplasm and extend into the breast stroma in a single file. The invasion of lobular carcinoma does not cause significant destruction to the surrounding normal anatomic structures or produce a significant connective tissue response (Arpino et al. 2004). The distinctive growth pattern of invasive lobular carcinoma does not normally create a mass that can be detected clinically or indirect changes that can be detected by
mammography. An additional difficulty with lobular carcinomas is that they have an
increased tendency to form multifocal and multicentric distributions, and bilateral occurrence (Arpino et al. 2004).
Tubular carcinoma is a rare from of mammary carcinoma, representing approximately 2% of all breast cancers. The cells of tubular carcinoma are well differentiated and are arranged in small tubules usually one cell layer thick immersed in an abundant desmoplastic stroma. Approximately 50% of tubular carcinomas are associated with microcalcifications.
Radiographically, tubular carcinomas can resemble the benign conditions referred to as radial scar and sclerosing adenosis (Damiana and Eusebi 2002).
circumscription, where normal breast tissue is never found within the tumor nodule. Cells associated with medullary carcinoma also have a high mitotic rate and large vesicular nuclei (Damiana and Eusebi 2002). The prognosis for patients with medullary carcinoma is
considerably better than those with infiltrating ductal carcinoma (Bartow 1999). Mucinous carcinomas are also well circumscribed tumors, often with multilobulated borders. These tumors are characterized as having invasive carcinoma cells immersed in large amounts of extracellular mucin. Mucin is a nitrogenous substance found in mucous that serves as a lubricant. Histologically, mucinous carcinoma is defined by the accumulation of extracellular epithelial mucins in the stroma of the breast. The five year prognosis for patients with mucinous carcinoma is good, with a disease free percentage ranging from 84-100%, a prognosis considerably better than for infiltrating ductal or lobular carcinoma (Damiana and Eusebi 2002).
2.5 Mammography Interpretation and Classification Schemes for Malignancy Although each clinician may have a particular system for reading mammograms, most have adopted a systematic and generalized procedure for mammographic interpretation. The first step in the process is comparing radiographs of the right and left breast for symmetry, and comparing these films with previous mammograms if available. Features that may indicate an abnormality include masses, clustered microcalcifications, architectural
FIGURE 2.6: Magnified view of malignant mass
FIGURE 2.7: Model of tumor development and detectability (Beckman 1998) Calcifications are another indictor of a possible malignancy, but their size and structural pattern are what lead the radiologist towards a benign or suspicious classification. For example, large calcifications referred to as “popcorn” calcifications are almost always benign. Calcifications that appear as tortuous parallel lines are most likely just calcified vessel walls, and benign oil cysts are described as having circular calcifications with lucent centers. Suspicious calcifications are very small, usually 0.1 to 1 mm in diameter, and are found in clusters. A cluster is typically defined as 5 or more calcifications within an area of 1.0 cm2. The probability of an underlying cancer increases in proportion with the number of clustered calcium specks (Donegan 2002).
One of the key prognostic indicators of survival is the size and distribution of a
tumor staging system is based on the size of the tumor, the extent of nodal involvement, and whether the tumor has undergone metastasis. The system known as the TNM staging
classification which is published by the American Joint Committee on Cancer (AJCC) underwent a significant modification in 2002. Using the TNM system allows for an easily recognized descriptor to be applied to a tumor that can be interpreted by a diverse team of health care professionals. One of the most important aspects of a tumor is size, which has been shown to have a direct correlation to patient outcome. The categories into which tumor sizes are separated are based on the survival rates associated with the general size of a tumor. Progression of a malignancy to the lymph node system is another prognostic indicator of disease status and survival, which is reflected in the various staging levels for nodal status. The most profound factor, as well as the most difficult to assess, is whether a malignancy has metastasized. If a cancer has been detected in a site distant from the primary tumor, the highest and least favorable classifications are applied.
The TNM staging system is effective for pathologic classification, but it is not an effective classification scheme for breast cancer screening. Breast imagers are charged with the task of interpreting mammograms and determining the likelihood that a cancer is present, a process which involves the experience of the radiologist and statistical probability. In order to standardize the assessment of risk so that it can be understood and quickly interpreted by a wide range of health care professionals, the American College of Radiology (ACR)
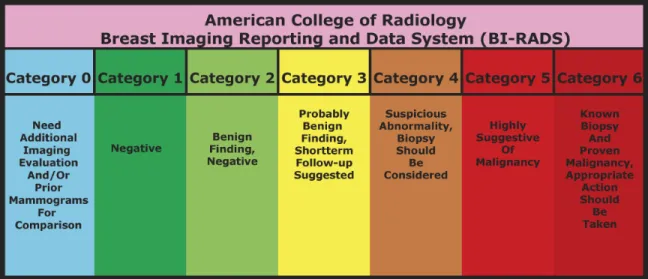
developed the Breast Imaging Reporting and Data System (BI-RADS). The Breast Imaging Reporting and Data System was created with the primary objective of improving
standardized reports across mammographic facilities, which can potentially reduce the report interpretation time for a primary care physician. Improvements in communication among health care professionals can encourage follow-up and compliance, and using a standardized method could help to optimize the standard of care by balancing benefits and resources. (Lacquement, Mitchell and Hollingsworth 1999).
Lesions that do not have a classic appearance of malignancy but do have a wide range of probability of malignancy are placed in Category 4. Lesions in Category 4 indicate a suspicious abnormality, and a biopsy should be considered. Most recommendations for interventional procedures are placed in this category, which is subdivided into three
subsections, 4A, 4B, and 4C. Dividing this category into three sections allows a radiologist to further define the relevant probability of malignancy, and use this information to work with the patient to make an informed decision on the best course of action (Breast Imaging-Reporting and Data System 2006).
If a lesion has a high probability of malignancy, greater than 95%, a Category 5 assessment is given indicating that appropriate action should be taken. Lesions that are deemed almost certainly malignant are in this category where a one-stage surgical treatment may be considered without a preliminary biopsy. Lesions which have been identified in an imaging study and have been proven malignant by biopsy are given a Category 6 assessment (Breast Imaging-Reporting and Data System 2006).
The BI-RADS assessments have been adopted and are now required by the United States Food and Drug Administration for reporting of mammographic findings and management recommendations. Studies evaluating the effectiveness of BI-RADS indicate that the
Chapter 3: Photon Interactions with Matter
3.1 The Photoelectric Effect and X-ray Absorption
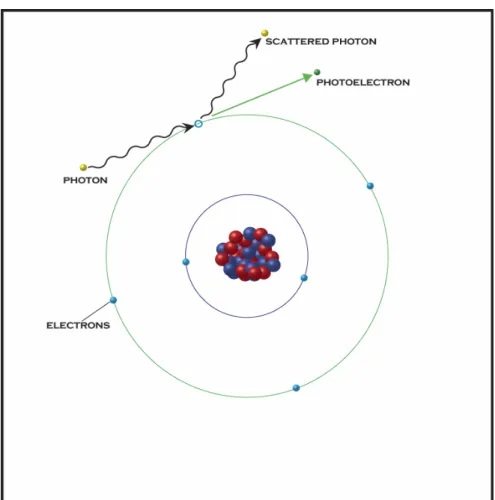
The most important underlying physical interaction in conventional radiography is the photoelectric effect. In its most general sense, the photoelectric effect is the process by which electrons are emitted from a surface as a result of incident electromagnetic radiation.
FIGURE 3.1: Elementary depiction of the photoelectric effect
First discovered in 1887 by Heinrich Rudolph Hertz, Hertz observed that ultraviolet light affects the voltage at which sparking occurs between electrodes. While the idea was
wave, then the number and energy of the ejected electrons would be a function of the intensity of incident wave. One of Hertz’s assistants, Philipp Lenard, performed a series of experiments that demonstrated conclusively that the energy of the electrons was independent of the intensity of the incident light.
As was often the case in the early 20th century, Albert Einstein was able to provide the clarity and insight to fully describe why the experimental data and established theory were inconsistent. In 1905, Einstein proposed his theory of the photoelectric effect, which introduced the revolutionary idea that light travels in packets, or quanta. Einstein proposed that the frequency of these individual quanta, or photons, determined the energy of the electrons ejected from a surface. The energy of each quanta was defined by the equation, E=hf, where h is Planck’s constant (h = 6.626069 x 10⁻³⁴ Joule seconds), and f is the
component of this process in conventional imaging is through absorption via the photoelectric effect.
The probability of photoelectric absorption occurring per unit mass is proportional to Z3/E3, where Z is the atomic number and E is the energy of the incident photon (Bushberg et al. 2002). For medical imaging, the equation is often simplified to reflect the effect of beam energy, making the probability of photoelectric absorption proportional to 1/E3. Since
contrast in conventional radiography is based on absorption, absorption contrast will decrease rapidly at higher energy levels. An exception to this trend occurs at the K-absorption edge of an atom, a characteristic energy specific to each element. The probability that a photoelectric interaction will occur increases significantly when the incident photon energy is just below the K-absorption energy, or K-edge (Bushberg et al. 2002).
Since photoelectric absorption is increased with higher atomic number and lower beam energy, imaging breast tissue becomes a challenging endeavor. Most of the primary elements in soft tissue are composed of hydrogen, carbon, nitrogen and oxygen, all of which have relatively low atomic numbers and absorption edges below 1 keV (Bushberg et al. 2002). Both the relatively low average atomic number and low absorption edge of the primary elements composing the parenchyma of breast tissue make determining differences between benign and malignant features challenging, especially in the early stages of disease.
3.2 Bremsstrahlung and Characteristic X-rays
2 2 1
mv
KE = .
Electrons emitted into a metal, such as the anode of an x-ray tube, can be deflected as they pass by the dense atomic nuclei and decelerate rapidly.
FIGURE 3.3: Generation of bremsstrahlung radiation
Accelerated electrons interacting with an atom can produce another type of x-ray based primarily on the object's atomic properties, known as characteristic x-rays. If an accelerated electron encounters an electron in an atomic orbital, part of its energy can be transferred and raise the impacted electron to a higher energy level. Ejection of the impacted electron can occur if the energy transferred is equal to or greater than the binding energy of that electron. If an interaction occurs that ejects one of these electrons, an electron from a higher energy level will drop to fill the gap. Since these electrons are going from a high energy level to a lower energy level, the change in energy level is accompanied with a release of energy. An electron that transitions from the second energy level to the first energy level (n=2 to n=1) are referred to as a Kα x-rays. Transitions from the third energy level to the first energy level
(n=3 to n=1) are classified as Kβ x-rays.
There are numerous transitions that can occur based on this electronic collision, but the interactions that generate characteristic x-rays are produced by transitions in the lower atomic energy levels.
The energy output spectrum of an x-ray target will depend on the properties of the metal being used. Determining the average energy needed for a particular imaging application is important in selecting a target. For applications that utilize monochromatic x-rays, the characteristic x-rays produced by a target are of particular importance.
3.3 X-ray Absorption
The photon interaction that has had the most profound impact on conventional radiography is x-ray absorption. When x-ray photons encounter matter, the interaction leads to an
attenuation of the incident x-rays, with a portion of the x-rays being absorbed and a portion being transmitted. X-ray attenuation is a loss in photon intensity based on electron density and mean atomic number of an object. Scattering of x-rays can also occur as photons pass through matter and lead to a loss in intensity, but this component is difficult to measure in conventional radiography. Quantification of the amount of photons that are absorbed as they pass through an object of thickness X is determined by how many photons are transmitted (It)
FIGURE 3.5: X-ray attenuation
The degree to which photons are attenuated as they pass through matter is a materials property that can be measured, and is termed the attenuation coefficient (µ) with units of cm-1. Differences in the linear attenuation coefficients allow for x-ray image contrast, with the highest contrast being between areas of high and low attenuation.
The linear absorption coefficient is proportional to the density of the material traversed, and the tabulated value is often expressed as µ/ρ. This value is called the mass absorption coefficient and it is independent of the physical state of the material (solid, liquid, or gas). 3.4 X-ray Refraction
The refraction of light as it passes from one medium to another was first discovered by Willebrord Snell, and the law that defines this process is known at Snell's law.
Mathematically, this relationship is defined as
) sin( )
sin( 1 2 2
1 θ n θ
n =
FIGURE 3.6: Refraction of visible light
Figure 3.6 illustrates the passage of an electromagnetic wave passing from one medium to another, with the deviation depending on the index difference. Using the classic example of visible light, the illustration demonstrates light moving from one index of refraction to a medium with a higher index of refraction. This example is commonly used to demonstrate refraction of visible light, but the law also applies for x-rays. However, for x-rays, the real parts of the complex refractive indices are less than unity and can be expressed as
δ − =1
n .
When using high-energy x-rays and materials with a low average atomic number, an approximation for δ is
π λ δ
2 2
e r N
where N is the number of electrons per unit volume of the sample material, re is the classical
electron radius, and λ is the x-ray wavelength. Using these equations one can show that for a linear interface between two regions with distinct refractive indices, an incident photon will be deflected at an angle ∆θ approximated by
1 2 1 )tan
( θ
θ ≅ n −n
∆ .
FIGURE 3.7: Refraction of x-rays through a cylindrical Lucite rod The above diagram demonstrates the refraction of an x-ray as it passes from air through a cylindrical Lucite rod (Kiss, Sayers and Zhong 2003).
3.5 Coherent Scattering
they can undergo a scattering event. In its most general definition, scattering is an angular deviation in the path of a photon secondary to an interaction with another object. The characteristics of the photon, the medium it is traveling in, and the properties of the object it encounters has a profound impact on the outcome of the interaction. For this discussion, a description of the basics of x-ray scattering is sufficient to describe the primary interactions necessary for describing a DEI system.
Interactions that occur without a loss or transfer of energy are elastic, and x-ray
interactions that occur without an associated loss of energy in the incident photon are referred to as elastic scatter, or coherent scatter. In a coherent scattering event, the energy of the primary x-ray photon is first completely absorbed and then re-emitted by the electrons of a single atom. There is no net energy loss in the interaction, but the direction of the photon re-emission is completely arbitrary.
For medical imaging, coherent scatter interactions are far less significant than
photoelectric interactions or scattering events that occur with a loss of energy, known as incoherent scattering. Further discussions of DEI will demonstrate the importance of coherent scattering in this imaging modality.
3.6 Incoherent Scattering
Compton effect. Arthur Compton was awarded the 1927 Nobel Prize in Physics for his work leading to the understanding of this effect.
A Compton scattering interaction can be described as a collision between an x-ray photon and an electron in the outer energy level of an atom. The energy binding the outer electrons is minimal, and all of the energy lost in the interaction between the photon and the electron is transferred as kinetic energy to the electron. This transfer of energy results in a photon with decreased energy, or increased wavelength, and the ejection of the impacted electron from the atom.
Both energy and momentum are conserved in the collision, so the energy and angular deviation of the scattered photon will depend on the amount of energy transferred to the electron. The Compton scattering equation used to describe the change in wavelength is
(
)
)2 1 ( sin 2 cos 1
' θ 2 θ
λ λ
mc h mc
h
= −
= −
where λ is the incident photon wavelength and λ' is the scattered photon wavelength.
FIGURE 3.9: Compton scatter from a free electron
similar energy and direction when compared with the desired photons used to generate an image. The similarity in energy and direction makes their removal by anti-scatter grids and energy filters difficult. For this reason, Compton scattering can reduce resolution and contrast by blurring the resulting image. Ingenious methods have been used to reduce the impact of Compton scattering on radiography, but no methods in conventional x-ray imaging have been successful in completely eliminating this effect (Hendee and Ritenour 2002).
3.7 Energy Deposition, Dose, and Health Effects
The development and use of imaging systems that use ionizing radiation are both enabled and grounded by the electromagnetic radiation used to visualize the internal structure of an object or patient. Ionizing radiation is defined as radiation which has enough energy to cause atoms to lose electrons and become ions. X-ray imaging is the most commonly used ionizing imaging modality, but many other anatomical and functional imaging modalities utilize ionizing radiation to obtain diagnostic information. An unavoidable consequence of using ionizing radiation is the dose associated with its use, and an understanding of how dose is measured and the associated health effects are essential. As with other systems of
measurement, the quantification of radiation exposure has evolved and changed producing numerous units and methods.
Dose is defined as the amount of radiation exposed to or absorbed by a subject or object. The Roentgen, named after the discoverer of x-rays Wilhelm Conrad Roentgen, is a unit of
air in the volume element. One Roentgen (R) is defined as 2.58 x 10⁻⁴ Coulombs of charge
produced by x-ray or gamma rays per kilogram of air. The Roentgen is also defined as the amount of x- and/or gamma radiation that produces a charge of 1 esu (2.08 x 10⁹ ion-pairs) in 1 cc of dry air at standard temperature and pressure. Use of the Roentgen is limited to
measuring x and gamma radiation, and more importantly it is not a measure of absorbed dose. Its use is not common in medical imaging devices, but its use does persist because the measurement of air ionization is still widely used in other areas.
A more useful measurement of radiation for biological imaging applications takes into account the dose of radiation absorbed by a subject or object, which is expressed in rad. A
rad is equal to 100 ergs (1 erg = 10-7 J) of energy absorbed by 1 gram of tissue. The
internationally adopted unit of absorbed radiation is the gray, named for the English medical
physicist L.H. Gray, and is equal to 100 rads. A rad or gray is not a measure of total energy, it is a measure of how much dose is absorbed per gram of tissue. In order to determine how much total energy was delivered, one must know the amount of tissue exposed. Both the rad and gray provide a measure of absorbed dose, but it is still just a measure of the amount of energy left behind in a tissue.
FIGURE 3.10: Radiation quality factors
For example, 1 gray of alpha particles will have a deleterious effect on biological tissue that is judged to be 20 times greater than 1 gray of x-rays. Multiplication of the absorbed dose and the appropriate quality factor produce a measure known as the equivalent dose. The unit of equivalent dose is rem (roentgen equivalent man) and the equation is expressed as
Equivalent Dose = Absorbed Dose x Quality Factor.
The modern unit sievert is typically used instead of rem, and is equal to 100 rem. For example, an equivalent dose of 300 rem is equal to 3 sievert (Hall 1978).
FIGURE 3.11: Relative sensitivity of biological tissues to radiation A term known as the effective dose is calculated by adding the product of the equivalent doses of the types of tissues irradiated and their weighting factor expressed as
∑
=
= n
1 i
Factor) Weighting
Tissue x Dose Equivalent (
Dose
Effective .
Biological systems rely on a hyper-complex system of molecules and structures to carry out the functions necessary for life. Ionizing radiation can disrupt cellular operations which can lead to a loss of function or death of the cell. Molecules in the body are united by
One of the most sensitive and critical components of the cell is its DNA (deoxyribonucleic acid), which is involved in cellular replication, transcription, and subsequent translation. If an ionization event takes place in the DNA leading to the ejection of an electron, an electrical charge can form in the DNA. Interactions that take place in this manner are called a direct action, in that the ionization event occurs directly in the DNA or from a neighboring
molecule.
FIGURE 3.12: Generation of a free radical through direct action
Approximately 2/3 of free radical generation from x-rays is classified as an indirect action,
FIGURE 3.13: X-ray induced indirect free radical formation
Once a free radical is generated, it can react very strongly with other molecules to restore a stable electron configuration. If a free radical interacts with a DNA molecule, it can create an error that does nothing, causes a temporary dysfunction, or destabilizes the cell, leading to eventual cellular death (Grosch and Hopwood 1979).
Excessive radiation exposure can lead to cell death, which can be manifested in two basic forms. Ionization can disrupt cellular functions to the point where the cell can no longer sustain itself, leading to cell death. Mitotic inhibition can also occur, allowing the cell to function, but no longer replicate. Effects that have an impact on the cellular level can be scaled to the organ, system, or organism level. A dose of 100 gray to the entire body can lead to death within 24 to 48 hours. A whole body dose of 2.5 to 5 gray can produce death within several weeks. Localized radiation exposure to organs and other body parts can lead to focal cellular death and dysfunction, with the impact of damage determined in part by the
Chapter 4: Overview of Current Mainstream Imaging Modalities
Used for Breast Imaging
4.1 X-ray Imaging
X-ray imaging as is known today was born with the fortuitous and seminal
observation by the German physicist Wilhelm Conrad Röntgen on the evening of November 8, 1895. Roentgen had been working on the phenomena associated with the passage of electric current through a vessel filled with gas at low pressure. These experiments had already been performed and studied by several other prominent physicists leading to the description of cathode rays. Röntgen had created a sealed tube and sealed it in a thick, black carton placed in a dark room. During this experiment, Röntgen noticed that a paper plate covered on one side with barium platinocyanide placed in the path of the rays fluoresced, even at a distance of two meters from the discharge tube. Realizing that there was an interaction occurring between the sealed tube and the plate, he placed objects of different thicknesses in the path of the rays and recorded the result. He noticed that the exposure of the plate was variable, and related to the thickness of the object. Being the daring and fearless scientist, he quickly made the transition to human testing and placed his wife's hand in the path of the beam and recorded the result. What was generated was the first radiograph, an image of the bony structure of his wife's hand along with an image of the ring she was
mechanism of their creation was unknown, Röntgen called them "X-rays". The name stuck, and his discovery led to a revolution in medicine and materials science. Röntgen was awarded the first Nobel Prize in Physics in 1901.
A major step towards efficient and practical radiographic imaging came from the American engineer and physical chemist William D. Coolidge with the invention of what is now referred to the Coolidge x-ray tube. In 1905, Coolidge was an engineer working for the General Electric Research Laboratory and was charged with replacing the carbon filaments in electric light bulbs of the day with a more durable element, tungsten. Coolidge was
successful in this endeavor, and realized that he could apply his discoveries with the tungsten light bulb to another product manufactured by General Electric, x-ray tubes. X-ray generators of the day used residual gas molecules as an electron source, but Coolidge proposed using a heated tungsten as the electron source, which led to the use of significantly higher operating voltages. Coolidge created a "hot cathode" tube, which was able to produce higher energy x-rays and was far more stable than previous x-ray systems. While there have been
advancements and refinements made to the first Coolidge cathode, the fundamental design of current x-ray tubes is essentially the same.
X-ray sources for the current generation of radiographic imaging systems use a design based on Coolidge's "hot cathode" tube. An electron beam is generated at the cathode, which as in Coolidge's day, is usually made of tungsten with a current applied at the cathode. A high voltage is applied across the cathode and anode, which creates a high potential
tungsten makes it an ideal choice for use as a cathode. An electrostatic focusing cup
surrounds the point of ejection, which helps to focus the electron stream towards the anode. Electrons being emitted from the cathode are focused across the vacuum of the x-ray tube to the anode, with the velocity across the gap determined by the voltage applied across the circuit. The energy spectrum and general output characteristics of an x-ray tube are primarily determined by the anode material and configuration. Selecting the proper anode material is based heavily on the application, specifically on what modality and what structure is to be imaged.
For mammography, the most common anode material is molybdenum, but rhodium is also used (Bushberg et al. 2002). Molybdenum's Kα of 18 keV provides the appropriate
spectrum for imaging soft tissue. For mammography systems, the anode is often stationary and mounted in a copper block to reduce heat. A major engineering problem is the generation of heat in the anode by the focused electron beam. X-ray tubes that have a stationary anode are more prone to heating because the primary means of heat removal is the surrounding copper anode, even with its high thermal conductance. Advancements in x-ray tube
development have led to the use of a rotating anode, which rotates so that the electron beam from the cathode does not impact the same area on the anode.
FIGURE 4.2: Cross section of a double-emulsion film.
When incident radiation, in this case an x-ray, strikes one of the silver halide granules, an electron is released. These electrons become trapped in regions of the crystal lattice of the silver bromide granules known as sensitivity centers. The presence of electrons in the lattice can react with the Ag+ ions of the disassociated silver halide, leading to a reduction event and the deposition of metallic silver primarily across the silver bromide granules. A developing solution is added that facilitates additional silver deposition at the sensitivity centers. Sodium thiosulfate or ammonium thiosulfate is used to remove the granules, thus ending the
development process. The amount of blackening in a region of the film is dependent on the amount of free silver deposited in the region, which is directly related to the amount of x-rays incident in that region (Hendee and Ritenour 2002).
stopping power of intensifying screens is much greater than film, allowing for image creation with a lower overall photon count. Photons that strike the active layer of the intensifying layer are absorbed, causing visible light to be emitted. The wavelength of light emitted is determined by the composition of the active layer, and should correspond closely with the spectral sensitivity of the film used. Benefits of using intensifying screens include: reduced exposure time and decreased motion unsharpness in the image, reduced tube voltage and improved contrast in the image, reduced heat production in the x-ray tube, reduced tube current allowing for smaller focal spots, and reduced patient radiation exposure (Hendee and Ritenour 2002). The primary disadvantage of using intensifying screens is the divergence of light from the point of emission on the screen to the film, which can lead to blurring of the final image. However, the benefits of intensifying screens generally outweigh the small loss in resolution, with film alone being used only in situations where extremely fine detail is required.
4.2 Ultrasound Imaging
Ultrasound imaging has found a niche in a myriad of medical disciplines and has
dramatically extended the ability to diagnose and evaluate internal structures that is both non-ionizing and safe. Ultrasound is defined as a mechanical disturbance that moves as a pressure wave through a medium, and the interaction of this pressure wave with the internal structures of an object can generate an image based on how much of the wave is reflected. Given the importance of ultrasound in breast imaging, an understanding of the physics and applications of the modality is essential.
result of pressure or twisting. The reverse is also true, where the application of a voltage at the opposite sides of a piezoelectric crystal produces a deformation in the crystal. This seminal discovery provided the theory necessary to enable others to build upon and
eventually find practical applications. With the general theory established, finding materials that had the appropriate piezoelectric properties under normal environmental conditions was a challenge. The French physicist Paul Langevin was successful in using this theory to develop piezoelectric materials as senders and receivers of high-frequency mechanical disturbances, leading to the use of ultrasound for the detection of submarines during World War I. Development continued on what eventually became known as SONAR (sound navigation and ranging) during World War II. The first industrial uses of ultrasound were proposed by Soviet Physicist Sokolov in 1928, through his suggestion that ultrasound could be used to detect hidden flaws in material. The first medical uses of ultrasound in the 1930s were limited to therapeutic applications for cancer treatments and physical therapy for various ailments, but a synergistic collaboration between physicians and engineers in the 1940s would introduce the diagnostic applications of ultrasound (Hendee and Ritenour 2002).
image. The strength of the reflection is determined in part by the angle at which the ultrasound wave strikes a reflecting interface, known as the angle of incidence. Maximum reflection of the beam producing the strongest echo occurs at 90 degrees, when the reflector is perpendicular to the ultrasound beam. The strength of the reflection, or echo, decreases as the angle of incidence decreases. At high angles of incidence, the ultrasound wave is
deflected away from the crystal and no echo is recorded. The shape of the transducer and the geometry of the transducer elements is application dependent and each has benefits
depending on the application. Two common transducer designs are a curved array, where the transducer elements are arranged along a curved surface, and a linear array in which the elements are fired in a certain way to generate a radial distribution of ultrasound beams. For the breast imaging application, linear transducers are typically used with an output frequency of 7.5 to 10 MHz (or higher) (Zwiebel and Sohaey 1998).
Ultrasound can also be used to measure the change in frequency that occurs when an ultrasound wave is reflected from moving objects, known as the Doppler effect. The general equation for the Doppler shift in frequency ∆ν is
θ ν ν
ν 2 ⎟cos
⎠ ⎞ ⎜ ⎝ ⎛ = ∆ c o
where νois the frequency of the ultrasound from the source, ν is the velocity of the object being measured, c is the velocity of ultrasound in the medium, and θ is the angle between the ultrasound beam and the direction of motion of the object. If object or objects in the path of the beam are moving away from the transducer, then the reflected waves will have a longer wavelength and lower frequency than the incident waves. Conversely, if reflecting object or objects are moving towards the transducer, then the reflected wave will have a shorter wavelength and a higher frequency than the incident waves. One can use this information to determine velocity, which is useful in a variety of medical applications, from determining vascular flow to measuring blood flow and distribution in the heart (Hendee and Ritenour 2002).
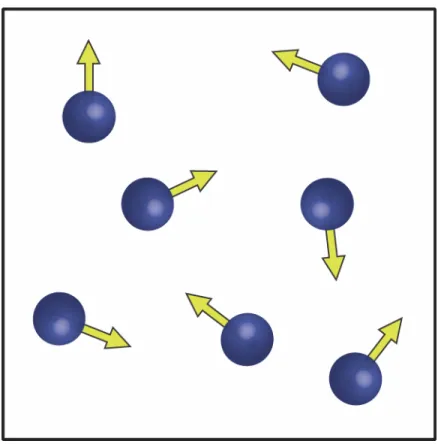
Tissues in the body are composed mostly of water, and molecules in a fluid medium are in continuous random motion. If no external force is applied to the medium, then the
distribution of the molecules will be uniform. The pressure wave from an ultrasound
rarefraction, which creates a longitudinal wave. A zone of compression and the adjacent zone of rarefraction are considered to be one cycle of an ultrasound wave. The distance covered by the cycle is known as the wavelength, and the number of cycles per unit time is defined as the frequency of the wave measured in hertz, kilohertz, or megahertz (Hendee and Ritenour 2002).
As ultrasound waves pass through a medium, energy can be removed from the beam through the processes of absorption, reflection, scattering, refraction, diffraction,
interference, and divergence. Attenuation is a general term referring to any interaction that removes energy from the ultrasound beam. Absorption of ultrasound waves occurs when a portion of the energy is converted to other forms of energy, which could be heating of the medium or an increase in overall molecular entropy. Reflection is defined as an orderly deflection of all or part of the beam, and less orderly changes in direction are referred to as scatter (Hendee and Ritenour 2002).
scatter events. Nonspecular scatter facilitates visualization of tissue parenchyma (Hendee and Ritenour 2002).
The use of ultrasound for the detection of breast lesions was first reported in 1951 by Wild and Neil (Wild and Neil 1951). They reported the use of ultrasound in differentiating
between breast cysts and sold masses, which continues to be one of the most important uses of ultrasound in breast imaging. Attempts were made in the early 1980s to use ultrasound to increase the cancer detection rate in radiographically dense breasts, but it became apparent that both the false-positive and false-negative rates for ultrasound diagnosis were too high to be of general benefit. Studies have shown that up to 45% of breast masses cannot be
identified with ultrasound, and microcalcifications found at the earliest stages of disease can not be seen with ultrasound. The use of ultrasound for screening was subsequently
abandoned, and its use is currently restricted to the assessment of mass lesions detected with mammography or physical examination (Zwiebel and Sohaey 1998).
The structural features of breast tissue have characteristic signatures on ultrasound, which is used for image interpretation and diagnosis. Certain features, such as Cooper ligaments, are strongly echogenic and are easily seen on ultrasound. Cooper ligaments can mimic the appearance of breast cancer because they are highly attenuating and may cast acoustic shadows. Adipose tissue in the breast is hypoechoic, and glandular tissue in the breast is medium in echogenicity. Differences in these normal structural features as well as lesions generate ultrasound contrast (Zwiebel and Sohaey 1998).
imperceptible wall, (2) a smooth inner surface, (3) anechoic contents, and (4) a strong backwall (far wall) echo or enhanced through-transmission of ultrasound (Zwiebel and Sohaey 1998). Diagnostically, the most common use of ultrasound is to differentiate between cysts and solid lesions detected mammographically. In this case, ultrasound is used to prove that a lesion thought to be a cyst is indeed a cyst. If a lesion is thought to be a cancer
mammographically, biopsy is an obligatory step making further ultrasound analysis
unnecessary. Studies have shown that ultrasound is 96% to 100% accurate for differentiating between solid masses in the breast (Zwiebel and Sohaey 1998).
If a palpable mass if found in a woman less than 30 years of age, the mass is very likely to be benign based on the incidence of breast cancer in this demographic. Concerns in regards to radiation exposure in this age group make mammography an undesirable first option. Ultrasound can be used to determine if a lesion is a benign cyst or if it is solid, which would warrant further investigation. If a lesion is found to be solid, a single-view mammogram can be obtained to determine if suspicious microcalcifications are present. Both the mammogram and ultrasound information are used to determine whether the patient should undergo a biopsy for a more definitive evaluation. Ultrasound is useful in patients with suspected breast inflammation in determining whether a frank abscess is present which requires drainage. For invasive procedures, ultrasound is used to guide aspiration or core biopsy of
mammographically identified lesions as well as masses that are palpable but can not be visualized using mammography (Zwiebel and Sohaey 1998).
The ubiquitous presence of ultrasound in breast imaging clearly demonstrates the
ability when compared to mammography alone. However, ultrasound is but one tool used to supplement or extend the diagnostic capabilities of mammography.
4.3 Magnetic Resonance Imaging (MRI)
Magnetic Resonance Imaging (MRI) has evolved spectacularly over the past two decades and has become a ubiquitous modality in the field of radiology. Current MRI systems and their development can be traced back to a similar technology, nuclear magnetic resonance (NMR). The first successful NMR experiment was conducted in 1946 by American scientists Felix Bloch and Edward Purcell. Felix Bloch of Stanford University and Edward Purcell of Harvard University independently discovered that when certain nuclei were placed in a magnetic field they absorbed energy in the radiofrequency range of the electromagnetic spectrum, and re-emitted this energy when the nuclei returned to their original state. Sir Joseph Larmor had previously demonstrated that the angular frequencies of precession are proportional to the strength of the magnetic field, known as the Larmor relationship. The seminal observations made by Bloch and Purcell led to the development of NMR
second dimension of spatial orientation that later became the foundation of MRI. Another essential step in obtaining MR images was discovered by Dr. Peter Mansfield, who demonstrated that the use of gradients in the magnetic field produced signals that could rapidly and effectively be analyzed and transformed into an image (Hendee and Ritenour 2002). Dr. Paul Lauterbur shared the 2003 Nobel Prize in Physiology and Medicine with Sir Peter Mansfield "for their discoveries concerning magnetic resonance imaging".
The basic theory of MRI deals with the behavior of nuclear magnetic moments by using the hydrogen nucleus as a model. The hydrogen nucleus consists of a single proton, which behaves as a small magnet with a magnetic moment that has both magnitude and direction. Hydrogen containing materials, such as the human body, have a proton distribution such that the magnetic moments of the individual nuclei are oriented in random directions.