Detect Theft using Machine Learning in Smart
Grid
M. Blessa Binolin Pepsi1 1
Assistant Professor(Senior Grade)
Department of Information Technology, Mepco Schlenk Engineering College, Sivakasi, Tamilnadu, India.
Abstract: Nowadays, Electricity theft is one of the major problems across all cities in the world. Nontechnical losses, particularly due to electrical theft, have been a major concern in power system industries. Large scale consumption of electricity in a
fraudulent manner may imbalance the demand supply gap to a great extent. So, keeping focus on these points, this system
proposes a comprehensive top-down scheme based on decision tree (DT) and support vector machine (SVM). The existing
schemes identify theft only at the transmission and distribution levels but not at the consumer level. The proposed scheme is
based on the combination of DT and SVM classifiers for rigorous analysis of gathered electricity consumption data. Unlike
existing schemes, the proposed scheme is capable enough to precisely detect and locate real time electricity theft at every level in
power transmission and distribution (T&D). In other words, the proposed scheme can be viewed as a two level data processing
and analysis approach, since the data processed by DT are fed as an input to the SVM classifier. Furthermore, the obtained results
indicate that the proposed scheme reduces false positives to a great extent and is practical enough to be implemented in real time
scenarios.
Keywords:Decision Tree, Support Vector Machine, Data Analytics, Initial entropy, Information gain.
I. Introduction
In recent days the main issue in cities meets the problem of electricity theft. Avoiding this problem is so tedious task.
The loss by the providers is enormous. So we must be so aware about theft deduction. According to the recent survey conducted
by Northeast group, LLC, more than $89.3 billion are almost lost every year worldwide due to electricity theft. India alone loses
nearly $16.2 billion per year, witnessing the highest levels of electrical theft. Electricity theft refers to intentional and illegal
usage of electricity by various means. Unlike technical loses which are generally caused during the generation and transmission
phase of electric power, the nontechnical ones cannot be computed or estimated precisely. In today’s world, the manual inspection
is to be done to identify the increased electricity theft in suspected area. But this can be time consuming and costly affair. Hence
this proposed work defines a method to identify an electrical theft using data analytics. The main goal of the work is to analyse a
huge data of smart grid using machine learning techniques to detect theft.
II. Relevant Work
Prior to our work, Stephen McLaughlin et. al. introduced A Multi-Sensor Energy Theft Detection Framework for
Advanced Metering Infrastructures [1]. The advanced metering infrastructure (AMI) is a crucial component of the smart grid,
replacing traditional analog devices with computerized smart meters. Smart meters have not only allowed for efficient
management of many end-users, but also have made AMI an attractive target for remote exploits and local physical tampering
in practice, the individual methods exhibit many false positives. In this paper, we present AMIDS, an AMI intrusion detection
system that uses information fusion to combine the sensors and consumption data from a smart meter to more accurately detect
energy theft. AMIDS combines meter audit logs of physical and cyber events with consumption data to more accurately model
and detect theft-related behavior. Our experimental results on normal and anomalous load profiles show that AMIDS can identify
energy theft efforts with high accuracy. Furthermore, AMIDS correctly identified legitimate load profile changes that more
elementary analyses classified as malicious.
Yong Sheng and Steven M.Rovnyak introduced Decision Tree-Based Methodology for High Impedance Fault Detection
[4]. This paper presents a high impedance fault (HIF) detection method based on decision trees (DTs). The features of HIF, which
are the inputs of DTs, are those well-known ones, including current [in root mean square (rmse)], magnitudes of the second, third,
and fifth harmonics, and the phase of the third harmonics. The only measurements needed in the proposed method are the current
signals sampled at 1920 Hz. It will reduce the cost of hardware compared with methods that use high sampling rates. A new HIF
model is also used. The data of current signals are from the simulation of Electromagnetic Transients Program (EMTP). The DT
algorithm trained can successfully distinguish the HIFs from most normal operations on simulation data, including switching
loads, switching shunt capacitors, and load transformer inrush currents.
III. Objective
The main goal of this work is,
To analyze the large datasets of Smart Grid obtained from the utility server in SG environment.
To detect the theft happened in the Smart Grid environment.
To classify the datasets as theft or no theft decision tree classification algorithm is used
To find Predicted Electricity for more accuracy in classification using SVM.
IV. Proposed System
A typical SmartGrid is comprised of numerous interconnected entities. These include power gener-ation, transmission
lines, distribution stations, and end users. Initially, the power is generated at power generation unit and is transmitted to the
different distribution stations through high-voltage transmission lines. After this, the power is redistributed across various sectors
and areas. Usually, electrical theft may occur at any level of power transmission as mentioned above.
In order to identify these thefts, the proposed scheme employs data analytics on data aggregated from various entities.
For collecting the related electricity consumption data on a real-time basis, smart meters and sensors are assumed to be deployed
across all levels. The data from smart meters and sensors are gathered through the Internet. Smart meter uses wireless medium to
communicate the readings of the meter to the utility. Once these data values are collected, they are then relayed to a central utility
server for further processing. The server performs the analytics on the received data using SVM and DT to precisely identify the
potential areas of the electric theft in the distribution network.
In order to validate the working of the proposed scheme, energy consumption dataset for various homes in USA has been taken [
]. In addition other features such as temperature and season with respect to date and time is taken from historical meteorological
From this dataset after preprocessing, five parameters are given as input to the Decision Tree. They are number of persons,
season, temperature, number of appliances and Timeslot. The number of appliances and timeslot is obtained from the US
electricity consumption dataset. Then the number of persons is obtained from the average electricity consumption in particular
area published by US government. Finally, season and temperature values are obtained from the Meteorological data of US.
Then these five parameters are given as input to the Decision tree C4.5 Algorithm. Decision Tree classifies the
data into theft and notheft. Then we set the priority to the constructed Decision tree using setting the priority algorithm. With that
algorithm weights, we find the predicted electricity for individual data. Then we give the Decision tree input as well as the
Predicted Electricity as input to the SVM for more accuracy in classification.
V. Implementation
The overall proposed work includes the following steps,
We analyze large dataset of electricity user consumption record to get the number of appliances used. Then we analyze the
US average electricity consumption record the average number of persons. Finally in last step of preprocessing data, we get the
season and temperature of particular time slot from the meteorological data.
The parameters used to construct a Decision Tree are Season, Temperature, Timeslot, number of persons and number of
appliances. C4.5 Algorithm is used for the construction of Decision Tree. In that C4.5 Algorithm, the Initial Entropy(IE) and
then the Information Gain(IG) for each and every attributes are calculated. Then attributes are splitted based on the values having
higher Information Gain.
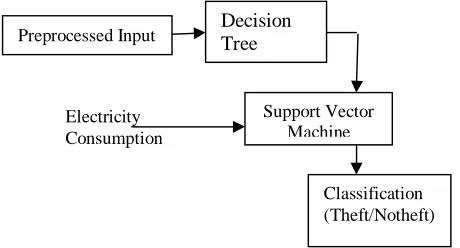
The overall system architecture of proposed work,
Fig. 1: Proposed System Design
After the decision tree is constructed, the priority value is given for the attributes present in same level of the tree. Then
weights are defined using the priority value for each and every individual data to find the Predicted Electricity.
Along with the data given as input the Decision tree, actual electricity consumption and predicted electricity are given as
input to the Support Vector Machine(SVM).Then normalized data being non linear Radian Basis Kernel (RBF) function is taken
as well as optimal values for modelling parameters are chosen. Finally train and test the classifier. From the result reduce the false
positive rates in theft detection.
A. Decision Tree
Decision Tree
Preprocessed Input
Support Vector Machine
Classification (Theft/Notheft) Electricity
Decision Tree refers to a classification technique that segregates the attributes into classes based on their respective features.
During DT classification, the training set is classified into predefined classes and a discrete label is assigned to each entry of a
class. This classification can either be done by the experts based on their experience, or using different logical models. However,
the classification performed by expert(s) is done at the expense of time and cost. The major advantage of In the proposed scheme,
DT is used in theft detection by calculating the expected electricity usage of the consumers. In this approach, an attribute is
selected to partition the samples based on entropy and information gain.
Decision Tree can be carried out in following steps:
1) Let S be set of samples and Fr(Ci,S) be the frequency of samples in S that belongs to class Ci Assuming that there are k
distinct classes and a total number of samples in S are |S|.
Then, the entropy (E) of S is calculated as follows
2) Once E(S) is calculated, S is partitioned into n number of out-comes with respect to an attribute say x. Thus, the E(S) with
respect to x (i.e.,Ex(S)) becomes the weighted sum of all the individual entropies of its subsets (Si). The final entropy and
information gain (IG) after the partitioning are calculated as follows
3) TheIG is calculated for all the attributes, and an attribute with maximum IG is selected to partition S which becomes the
parent node of the DT. This procedure is repeated and the child nodes are created in a similar manner until all the entries are
classified to a single output class.
The aim of proposed DT is to predict the electricity consumption of consumers. This is achieved by extracting the
priorities of the features from the constructed DT. For this purpose, the data are collected, relevant features are extracted, and DT
is formed.
B. Setting up the priority
After the formation of DT, weights are assigned to all attributes for predicting the expected electricity usage of a consumer. This
prediction is done based on the priorities of the respective attributes. The priorities are decided according to the occurrence of an
attribute in DT.
This algorithm stated below results in the prioritization of attributes using which the prediction of electricity consumption is done.
Setting the Priority can be carried out in following steps:
2: Initialize i=1
3:functionTrk()
4: if(i== 1)then //Root node
5: S(i,1) = k
6: S(i,2) = 1 //Top Priority
7: i=i+1
8: Trleft(k)
9: Trright(k)
10: else //Nonroot node
11: if( (left(k) != NULL) || (right(k) != NULL) ) then
12: for(a=1 ; a≤ i ; a++) do
13: if( S(a,1) ==k )then
14: returnS
15: else
16: S(i,1) = k
17: S(i,2) = i //Set Priority
18: end if
19: end for
20: end if
21: if(S(i−1) ==n) then //All attributes explored
22: returnS
23: else
24: Trleft(k)
25: Trright(k)
26: end if
27: end if
28:end function
Once the priorities are set, the value of predicted electric-ity (PE) is calculated. For every attribute i, weight wi is assigned to it
based upon its priority. The contribution of spe-cific attribute to PE is calculated using the weights assigned to the respective
feature. This weight is calculated for all the attributes, and finally, PE returns the expected electricity consumption of the
consumer using equation mentioned below
C. Support Vector Machines
SVM is the supervised machine learning method which is used for classification of data. The primary goal of using SVM is
to classify the unseen data accurately by minimizing the classification error using a decision function. This is achieved by training
the SVM on the training data and afterward using it to predict the output class of the unseen data. In this section, SVM-based
approach has been put forth for the purpose of theft detection.
The various steps used in SVM classifier are
Data Preprocessing
Data Normalization
Choice of appropriate kernels
Choose Modelling Parameters
Train and Test the Classifier.
i) Data Preprocessing
In this step, raw data from various sensors and smart meters deployed in the SG environment are collected and
transformed into the format recognized by SVM classifier. For this, all the categorical attributes in the collected data need to be
converted into numeric format.
ii) Data Normalization
Data normalization is one of the main strategies that needs to be employed before performing classification using
SVM. The basic purpose of data normalization is to keep check on the attributes having greater range of numeric values, so that
the smaller sized values are not neglected. If X is the data value such that X∈D, where D is the domain of X, then the
normalization of X can be performed using a normalization function as mentioned below
Where X’ represents the data value after normalization. Xmax andXmin are the maximum and minimum data values in D,
respectively. Apart from this, a and b are the minimum and maximum values in the specified output range, respectively.
iii) Choice of appropriate kernels
Choosing kernels according to the problem is also a very important task in SVM classification. One must choose
the best available kernel that fits the respective problem. In the proposed scheme, as the data are nonlinear in nature and features
are also less in number, therefore, the nonlinear kernel is best suited for classification purposes. Gaussian radial basis function
(RBF) kernel is the most commonly used nonlinear kernel in software packages that separates the solution sets which are not
Where xi is the support vector and xj is the current data value. In representation of RBF kernel, (1/2σ2) is replaced with γ as
shown in equation below
The primary objective of this kernel is to build the decision boundary that classifies the training set into two separate parts. The
mathematical representation of this decision boundary function using the RBF kernel is as follows
Where w is the normal vector to the decision boundary and b is the regularization parameter inm-dimensional feature space
(represented by m). The robustness of f(x) can be ensured by minimizing the value of norm ||w|| and by adding slack variables to
counter the occurrence of inequalities in the classification problem. The above decision function can now be represented as an
optimization problem which is given by
where C is the additional regularization parameter used to tradeoff between maximization of margin and minimization of training
error. The above equation can be solved using the Lagrange multipliers (αi , βi ≥0) can be represented as below
iv) Choose Modelling Parameters
For RBF kernel, two modeling parameters namely C and γ need to be chosen before using RBF as a kernel function.
These two parameters have a direct affect on the accuracy of the SVM classifier; thus, selecting the right values for these
parameters is an important task. In the proposed scheme, a library for support vector machine (LIBSVM) is used for optimizing
these parameters on the basis of cross validation and grid search. In cross validation, the training set is divided into various folds
(say k), out of which, randomly chosen k−1subsets are used for training the classifier, and the remaining one is used for testing.
Then, grid-search method is used for finding the values of C and γ. First, loose grid search with cross-validation is performed with
respect to C and γ values. Then, a finer grid search in the neighborhood of the (C, γ) pair (which gives the best cross-validation
accuracy during the loose search) is performed to get the best values of C and γ. The classifier is again trained on the basis of the
VI. Performance Measure
Practical scenario to identify theft at consumer level has been proposed. In order to identify the fraudulent consumers, a top down
scheme is stated with the usage of data analytics. To detect them features namely number of heavy appliances, number of persons,
season, time slot, and temperature are given as input to the Decision Tree. The input data includes 5, 00,00
0 records for analysis. The expected electricity consumption for the consumer during a particular time is calculated. This
consumption along with other features is given as input to the SVM classifier which is trained on the collected dataset. This
classifier is then used to classify the consumers as normal or fraud based upon their features differentiated by theft and no theft.
Decision Tree coupled with SVM is tested and results proved to be better than other existing models. The experimental data was
preprocessed and executed in statistical analytics tool R to calculate the results.
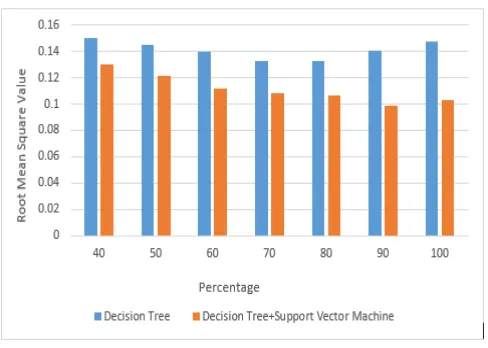
The below results were tested using cross validation approach. The percentage increase in x-axis elaborates the split up for
training and testing.
The root mean square value of decision tree is compared with decision tree coupled with SVM. This provides good results with
the maximum accuracy of 93.14% on percentage split of 70% with the low root mean square value as 0.151. Thereby the
proposed scheme gives good result for accuracy to identify electrical theft.
Figure 2: Performance analysis of DT vs DT coupled with SVM
VII. Conclusion:
Hence the proposed scheme is based on the combination of DT and SVM classifiers for rigorous analysis of gathered
electricity consumption data and it is capable enough to precisely detect and locate real time electricity theft at every level in
power transmission and distribution (T&D). Furthermore, the obtained results reduce false positives to a great extent and are
VIII. References:
[1] S. McLaughlin, B. Holbert, A. Q. Fawaz, R. Berthier, and S. Zonouz, “A multi-sensor energy theft detection framework for
advanced metering infrastructures,” IEEE J. Sel. Areas Commun., vol. 31, no. 7, pp. 1319– 1330, Jul. 2013.
[2] R. Gholami, X. Guo, M. D. A. Higon, and S. Y. T. Lee, “Information and communications technology (ICT) international
spillovers,”IEEE Trans. Eng. Manage., vol. 56, no. 2, pp. 329–340, May 2009.
[3]D. Alahakoon and X. Yu, “Smart electricity meter data intelligence for future energy systems: A survey,” IEEE Trans. Ind.
Informat., vol. 12, no. 1, pp. 425–436, Feb. 2016.
[4] Y. Sheng and S. Rovnyak, “Decision tree-based methodology for high impedance fault detection,” IEEE Trans. Power Del.,
vol. 19, no. 2, pp. 533–536, Apr. 2004.
[5] L. Wei, H. Zhu, Z. Cao, X. Dong, W. Jia, Y. Chen, and A. V. Vasilakos, “Security and privacy for storage and computation in
cloud computing,” Inf. Sci., vol. 258, pp. 371–386, 2014.
[6] R. Gholami, X. Guo, M. D. A. Higon, and S. Y. T. Lee, “Information and communications technology (ICT) international
spillovers,”IEEE Trans. Eng. Manage., vol. 56, no. 2, pp. 329–340, May 2009.
[7] L. Wei, H. Zhu, Z. Cao, W. Jia, and A. V. Vasilakos, “SecCloud: Bridging secure storage and computation in cloud,” inProc.
IEEE 30th Int. Conf. Distrib. Comput. Syst. Workshops (ICDCSW), 2010, pp. 52–61.
[8] L. Wei, H. Zhu, Z. Cao, X. Dong, W. Jia, Y. Chen, and A. V. Vasilakos, “Security and privacy for storage and computation in
cloud computing,” Inf. Sci., vol. 258, pp. 371–386, 2014.
[9] S. Lighari, D. Hussain, A. Shaikh, and B. Jensen, “Attacks and their defenses for advanced metering infrastructure,” inProc.
6th Int. Congr. Ultra Mod. Telecommun. Control Syst. Workshops (ICUMT), Oct. 2014, pp. 148–151.
[10] W. Wang and Z. Lu, “Cyber security in the smart grid: Survey and challenges,” Comput. Netw., vol. 57, no. 5, pp. 1344–
1371, 2013.
[11] Open Energy Information [Online]. Available:
http://en.openei.org/datasets/dataset/commercial-and-residential-hourly-load-profiles-for-alltmy3-locations-in-the-united-states, Accessed on: Jul. 2015.
[12] AccuWeather Incorporation [Online]. Available: http://www.accuweather.com/en/us/united-states-weather, Accessed on: Jul.
[13] US Energy Information Administration. [Online].
Available:http://www.eia.gov/consumption/residential/data/2009/index.cfm?view=consumption, Acce