Combinatoric Models of Information Retrieval
Ranking Methods and Performance Measures for
Weakly-Ordered Document Collections
Lewis Church
A dissertation submitted to the faculty of the University of North Carolina at Chapel Hill in partial fulfillment of the requirements for the degree of Doctor of Philosophy in the School of Information and Library Science.
Chapel Hill 2010
Approved by:
Robert M. Losee, Advisor
c 2010 Lewis Church
Abstract
LEWIS CHURCH: Combinatoric Models of Information Retrieval Ranking Methods and Performance Measures for Weakly-Ordered Document
Collections
(Under the direction of Robert M. Losee)
This dissertation answers three research questions: (1) What are the characteristics of a combinatoric measure, based on the Average Search Length (ASL), that performs the same as a probabilistic version of the ASL?; (2) Does the combinatoric ASL measure produce the same performance result as the one that is obtained by ranking a collection of documents and calculating the ASL by empirical means?; and (3) When does the ASL and either the Expected Search Length, MZ-based E, or Mean Reciprocal Rank measure both imply that one document ranking is better than another document ranking?
Concepts and techniques from enumerative combinatorics and other branches of math-ematics were used in this research to develop combinatoric models and equations for several information retrieval ranking methods and performance measures. Empirical, statistical, and simulation means were used to validate these models and equations.
The document cut-off performance measure equation variants that were developed in this dissertation can be used for performance prediction and to help study any vector V
Dedication
To my mother, Arlen Elizabeth Church To the memory of my father, Lewis Church, Sr.
To my wife, Dr. Lila Teresa Church
Acknowledgments
To the casual observer, a doctoral dissertation may appear to be solitary work. Com-pleting a project of this magnitude requires a network of support, however, and I am indebted to many people. I am especially grateful to my dissertation advisor and com-mittee chair, Dr. Robert M. Losee, and his fellow comcom-mittee members Dr. Robert E. Burgin, Dr. Claudia J. Gollop, Dr. Jane Greenberg, Dr. Richard Marciano, and Dr. Paul Solomon.
The original members of my committee remained with me even though this jour-ney took more time than I expected to complete the dissertation. I especially thank Dr. Richard Marciano for agreeing to come on as a new committee member at a point where my dissertation work was at a very advanced stage.
I am indebted to my wife, Lila Teresa Church, who was a doctoral student for most of the years that I was a doctoral student. She provided much advice and encouragement during these years. It was wonderful not having to explain to her why I had to study so much and how my life was continuously being impacted by the many demands that the doctoral program placed upon me.
Table of Contents
List of Tables xxii
List of Figures xxvii
List of Abbreviations xxxi
List of Symbols and Notation xxxiii
1 Introduction 1
1.1 Research Goals and Questions . . . 3
1.2 Significance of this Research . . . 4
1.3 Wider Applicability of the Extended Measures . . . 9
1.4 Summary . . . 10
2 Background 11 2.1 Several Alternative Measures That Are of Interest . . . 14
2.1.1 Expected Search Length . . . 15
2.1.2 Mean Reciprocal Rank . . . 16
2.2 Mathematical Presentation and Techniques . . . 17
2.2.1 Notation . . . 18
2.2.2 Proofs . . . 18
2.2.3 Probability Theory and Models . . . 19
2.2.4 Simulation . . . 20
2.2.5 The Query-Document Model . . . 21
2.2.6 The Relationship Between the Query-Document Model and Weak 4-Compositions . . . 22
2.2.7 Combinatorial Generation and Enumeration Algorithms . . . 27
2.3 Term and Query Operations . . . 29
2.3.1 Lexical Analysis . . . 30
2.3.2 Stoplists . . . 32
2.3.3 Stemming . . . 34
2.4 An Historical Overview of Information Retrieval Research . . . 35
2.5 IR Performance Evaluation and Test Collections . . . 39
2.5.1 IR Performance Evaluation . . . 40
2.5.2 A Formal Definition of a Test Collection . . . 41
2.5.3 Several Generations of Test Collections . . . 42
2.5.5 Text REtrieval Conference (TREC) . . . 45
2.6 Constructing Single Term Queries . . . 47
2.7 Language Models and Relative Entropy . . . 49
2.8 Statistical Significance in Query System Performance . . . 54
2.9 Significant Sample Sizes for Document Collections and Queries . . . . 57
2.10 Summary . . . 59
3 Method 61 3.1 Instruments . . . 61
3.1.1 The Cystic Fibrosis Test Collection . . . 62
3.1.2 Synthetic Datasets and Random Sets of Queries . . . 63
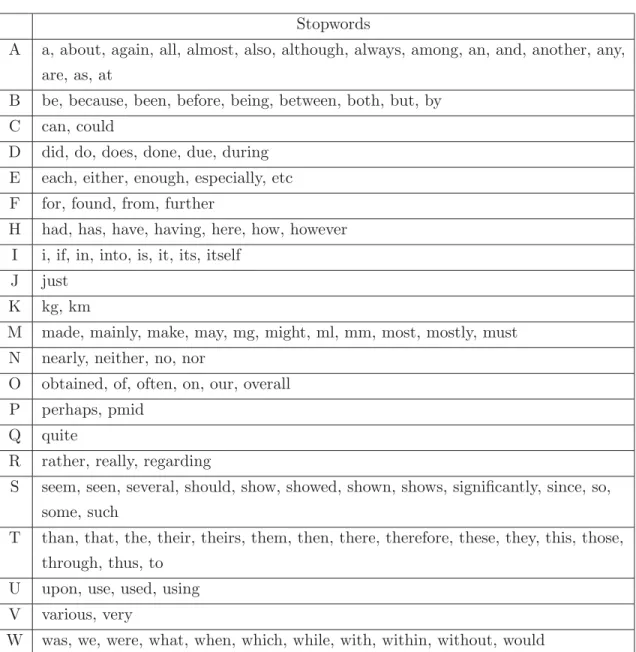
3.1.3 PubMed stopword list . . . 63
3.1.4 Lexical Analyzer . . . 63
3.1.5 Porter stemmer . . . 65
3.2 Procedure . . . 65
3.2.1 Adapt the Cystic Fibrosis test collection . . . 65
3.2.2 Create Synthetic Datasets and Random Sets of Queries . . . . 72
3.3 Quality of Ranking Calculations for the Coordination Level Matching,
Inverse Document Frequency, and Decision-Theoretic Ranking Methods 87
3.4 An Example of How to EstimateQ for the CLM Ranking Method . . 97
3.5 The Three Research Questions . . . 103
3.5.1 What would be the characteristics of a combinatoric measure, based on the ASL, that performs the same as a probabilistic
mea-sure of retrieval performance, also based on the ASL? . . . 104
3.5.2 Does the ASL measure produce the same performance result as the result that would be obtained by a process that ranks docu-ments and, then, calculates the Average Search Length from this
empirical ranking data? . . . 106
3.5.3 When does the ASL measure and one of these measures (i.e., MZE, ESL, and MRR) both imply that one document ranking is
better than another document ranking? . . . 108
3.6 Summary . . . 109
4 Characteristics of a Combinatoric-Based Quality of Ranking
Mea-sure 110
4.1 Essential Characteristics . . . 111
4.2 The Document Collection Sample Space and Its Division Into Four
Quad-rants . . . 113
4.3 Handling Mathematical Singularities . . . 117
4.4 What and Why Do We Count? . . . 122
4.5 Determining the Number of Qualifying Document Collections for Quad-rant I (each weak 4-composition in this quadQuad-rant represents a document collection that has at least one relevant document and zero non-relevant
4.6 Determining the Number of Qualifying Document Collections for Quad-rant II (the single weak 4-composition in this quadQuad-rant represents the
empty collection of documents forN = 0) . . . 125
4.7 Determining the Number of Qualifying Document Collections for Quad-rant III (each weak 4-composition in this quadQuad-rant represents a document collection that has zero non-relevant documents and at least one relevant document) . . . 126
4.8 Determining the Number of Qualifying Document Collections for Quad-rant IV (each weak 4-composition in this quadQuad-rant represents a document collection that has at least one relevant document and at least one non-relevant document) . . . 128
4.9 Summary . . . 139
5 A Combinatoric Model of Q for the Coordination Level Matching Ranking Method 141 5.1 Ranking By Coordination Level Matching . . . 144
5.2 Two Basic Ways to Count the Number of Qualifying Weak 4-Compositions 145 5.3 The Number of Distinct 2-Partitions . . . 147
5.4 Divisor Pairs and Prime Power Factorizations . . . 149
5.5 Basic Divisor Pair-Related Definitions . . . 152
5.6 Number-Theoretic-Based Fundamentals of a Solution . . . 154
5.6.1 The General Constraints . . . 155
5.8 Counting by the Principle of Inclusion-Exclusion . . . 159
5.8.1 An Overview . . . 161
5.8.2 Running Example: The Superset for a Set of Divisor Pairs and Its Cardinality . . . 162
5.8.3 Applicability of the Principle of Inclusion-Exclusion to This Re-search . . . 164
5.8.4 More Basic Definitions and Lemmas . . . 164
5.8.5 Lemmas for the Establishment of Essential Bijections . . . 172
5.8.6 Entity-Relationship Models and Diagrams . . . 185
5.8.7 Running Example: Intersection of Three Sets of Generally Qual-ifying Weak 4-Compositions . . . 190
5.9 CalculatingQCLM for a Document Collection of Size N . . . 194
5.10 A Refinement of the Calculations for QCLM . . . 197
5.10.1 The Number of Qualifying Weak Compositions for Quadrants I, II, and III . . . 198
5.10.2 The Number of Qualifying Weak Compositions for Quadrant IV (each weak 4-composition in this quadrant represents a document collection that has positive numbers of relevant and non-relevant documents) When At Least One of the Parameters r1,r0,s1, and s0 Has a Value of Zero . . . 199
5.11 A Further Refinement of the Calculations for QCLM . . . 206
5.11.1 All four of the values assigned to the variables r1, s0, r0, and s1 are identical . . . 211
5.11.2 Only two of the four values assigned to r1, s0, r0, and s1 are mutually distinct . . . 213
5.11.3 Only three of the four values assigned to r1, s0, r0, and s1 are mutually distinct . . . 218
5.11.4 All four of the values assigned to r1, s0, r0, and s1 are mutually distinct . . . 222
5.12 Mean and Variance . . . 228
5.13 Example: An Application of the Principle of Inclusion-Exclusion . . . 230
5.13.1 The 1-subsets and Their Cardinalities . . . 232
5.13.2 The 2-subsets and Their Cardinalities . . . 233
5.13.3 The 3-subsets and Their Cardinalities . . . 234
5.13.4 The 4-subset and Its Cardinality . . . 234
5.13.5 The Resultant Cardinality . . . 235
5.14 Summary . . . 237
6 Combinatoric Models ofQ for the Inverse Document Frequency and Decision-Theoretic Ranking Methods 239 6.1 Combinatoric Model ofQ for the IDF Ranking Method . . . 241
6.2 Summary for the Inverse Document Frequency Ranking Method . . . 244
6.3 A Combinatoric Model ofQ for the DT Ranking Method . . . 246
6.3.1 Mean and Variance . . . 254
6.4 Summary for the DT Ranking Method . . . 257
7 Characteristics of a Combinatoric-Based A and ASL Performance
Measure 259
7.1 Notation and Definitions . . . 262
7.2 A Combinatoric Model ofA . . . 264
7.2.1 An example of a sample space for an optimal ordering of 8
docu-ments . . . 264
7.2.2 Permutations, permutation trees,r-permutations, andr
-combina-tions . . . 267
7.2.3 Compute the Average Unnormalized Position of a Relevant
Doc-ument from a Sample Space of Orderings . . . 277
7.2.4 Derivation of the Formula for A . . . 282
7.3 Gaussian Polynomials and Some of Their Properties . . . 286
7.3.1 A Motivating Example: The Use of Gaussian Polynomials to
Ob-tain Document Position Distributional Information . . . 287
7.3.2 Reciprocity and Unimodality . . . 289
7.3.3 Additional Important Relationships . . . 290
7.3.4 Performance Evaluation Implications for Information Retrieval
7.4 Probability Mass Functions, Generating Functions, and Probability
Gen-erating Functions . . . 295
7.5 The Distribution of the Sums of the Positions of the Relevant Documents
in an Optimal Ranking . . . 298
7.5.1 Another Motivating Example: The Use of Gaussian Polynomials and Probability Generating Functions to Obtain Search Length
Means and Variances . . . 301
7.5.2 Two Functions That Calculate the Sums of the Minimum and
Maximumk Values in a Range of Integers . . . 309
7.5.3 The Example Continued — The Distribution of Total Search
Length Values For Feature Frequency 0 . . . 311
7.5.4 The Example Continued — The Distribution of Total Search
Length Values For Feature Frequency 1 . . . 312
7.5.5 The Example Continued — The Combined Distribution of Total
Search Length Values . . . 313
7.6 Useful Definitions and Theorems . . . 314
7.7 Expected Value and Variance of the Normalized Search Length . . . . 317
7.8 Expected Value and Variance of the Unnormalized Search Length . . 322
7.9 Retrieval Status Value, Weights, and Document Ranking . . . 326
7.10 A Family of ASL Measures . . . 327
7.10.1 The ASLr Measure (a refined estimate of the Average Search
Length) . . . 330
7.10.2 The ASLg Measure (the gold standard for estimating the Average
7.11 Summary . . . 338
8 Validation of the Formulas for the Q, A, and ASL Measures 340 8.1 The Validation of Q . . . 343
8.1.1 Test Data Generation . . . 343
8.1.2 Empirical Data Supports the Validation of Q . . . 347
8.2 The Validation of Q Estimates That Were Obtained by Random Sam-pling . . . 348
8.2.1 Test Data Generation . . . 349
8.2.2 Empirical Data Supports the Validation of Q Estimates That Were Obtained by Random Sampling . . . 350
8.3 The Validation of A . . . 350
8.3.1 Boundary Conditions . . . 352
8.3.2 The Determination of Cardinalities for Two Combined Sets of Boundary Conditions . . . 358
8.3.3 Test Data Generation . . . 365
8.3.4 Empirical Data Supports the Validation of A . . . 368
8.4 The Validation of ASL . . . 369
8.4.1 Test Data Generation . . . 370
8.4.2 Empirical Data Supports the Derivation of ASL . . . 370
8.5.1 Test Data Generation . . . 372
8.5.2 Empirical Data Supports the Validation of ASLr . . . 373
8.6 The Validation of ASLg . . . 374
8.6.1 Test Data Generation . . . 377
8.6.2 Empirical Data Supports the Validation of ASLg . . . 378
8.6.3 An Example That Illustrates the Calculation of ASLg By Three Different Methods . . . 378
8.7 Summary . . . 384
9 The ASL Performance Measure Variants and Empirical Document Rankings 385 9.1 The Datasets . . . 387
9.2 The Analysis . . . 388
9.3 Summary . . . 391
10 The ASL Measure and Three Frequently-Used Performance Mea-sures 393 10.1 Regions of Agreement and Disagreement About Relative Rankings . . 395
10.1.1 More Information About Performance Measure Disagreements 398 10.2 Characteristics to Consider When Comparing Measures . . . 401
10.2.2 Does the Measure Assume That the Ranked Documents Are Strongly
Ordered? . . . 406
10.2.3 Is the Measure Based on a Single Query? . . . 411
10.2.4 Is the Measure Defined Even When There Are No Relevant Doc-uments? . . . 411
10.2.5 Does an Increase in the Measure’s Value Correspond to an In-crease in Performance? . . . 413
10.2.6 Do the Measures Use the Same Range of Values to Report Per-formance? . . . 413
10.3 Weakly and Strongly Ordered Rankings . . . 414
10.3.1 What Does “Rank” Mean When Entities Are Weakly Ordered? 418 10.3.2 Nondeterministic Rankings . . . 418
10.3.3 Smoothing for Nondeterministic Rankings . . . 419
10.4 Several Sum and Binomial Identities . . . 420
10.4.1 Manipulation of Sums . . . 420
10.4.2 Basic identities . . . 421
10.4.3 Symmetry . . . 422
10.4.4 Addition . . . 423
10.4.5 Convolution identities . . . 423
10.4.6 Sum of the first n positive integers . . . 424
10.4.8 Absorption identities . . . 425
10.5 A General Framework For Handling Ties . . . 425
10.5.1 Important Commonalities . . . 429
10.5.2 Commonalities for Precision, Recall, and Average Search Length 432 10.6 Derivations for the ESL, ASL, Precision, Recall, MZE, and RR Measures 441 10.6.1 Expected Search Length . . . 441
10.6.2 Average Search Length . . . 454
10.6.3 Precision . . . 460
10.6.4 Recall . . . 461
10.6.5 MZ-Based E Measure . . . 461
10.6.6 Reciprocal Rank . . . 462
10.7 Operationalizing What It Means For One Document Ranking to be Bet-ter Than Another Document Ranking . . . 477
10.8 Validation . . . 478
10.9 Example: Comparing Type-T and Type-D Versions of the ASL Measure 480 10.10Example: Comparing the ASL Measure With the MZE, ESL, and RR Measures . . . 487
10.11Summary . . . 493
11.1 Goals . . . 497
11.2 Questions . . . 498
11.3 Steps . . . 499
11.4 Problems Conducting the Research . . . 500
11.5 Findings . . . 504
11.6 Implications and Recommendations . . . 508
11.7 Future Research . . . 510
11.8 Summary . . . 512
Appendices 514 A Creating the Modified Cystic Fibrosis Test Collection 515 A.1 Create the CF test collection . . . 515
A.1.1 Transform the queries . . . 515
A.1.2 Transform the documents . . . 516
A.1.3 Transform the relevance judgments . . . 517
A.2 Select the best single term description of each query in the CF test collection . . . 517
C The Derivation of A Formula to Calculate the Expected Position of
a Specified Relevant Document in An Equivalence Class 535
D Derivation of the Alternate Equation for Q for the IDF Ranking
Method 540
E The Number of Qualifying Weak4-Compositions for Selected
Rank-ing Methods 544
List of Tables
3.1 The PubMed Stopword List. . . 64
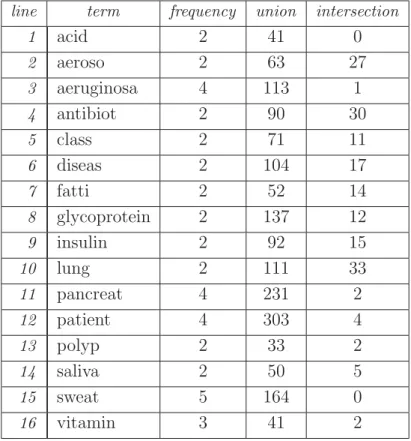
3.2 The Single Term Query Descriptions With Plural Frequencies. . . 70
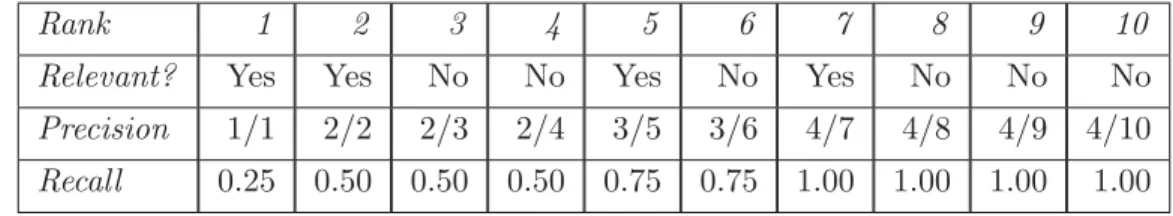
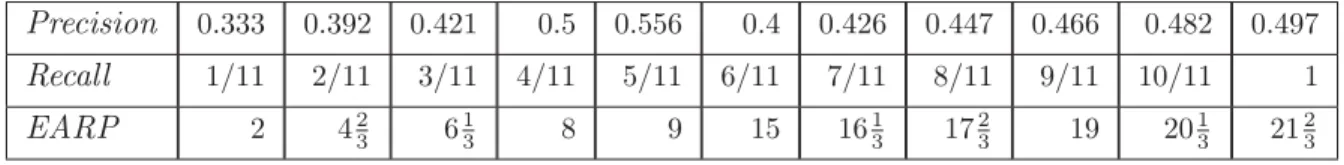
3.3 Actual Recall and Precision Table For A Query With Four Relevant Doc-uments. . . 74
3.4 Interpolated Recall and Precision Table. . . 75
3.5 A Ranking That Has Multiple Documents With The Same RSV . . . 77
3.6 Expected Actual Recall Position (EARP) Table. . . 84
3.7 Interpolated Recall and Precision Table. . . 84
3.8 Sample Space for a 4 Document Collection. . . 99
3.9 Number of Weak Compositions of Size 4 for Selected Values ofN. . . . . 103
3.10 Comparing Quality of Ranking Methods. . . 105
3.11 Ranked List of Ten Documents. . . 107
4.1 Quadrant I Outcomes. . . 125
4.2 Quadrant III Outcomes. . . 127
4.3 Quadrant IV Outcomes (p= 0 and q= 0 andN ≥2). . . 129
4.4 Quadrant IV Outcomes (p= 0 and q∈(0,1) and N ≥3). . . 131
4.6 Quadrant IV Outcomes (p∈(0,1) andq = 0 andN ≥3). . . 133
4.7 Quadrant IV Outcomes (p∈(0,1) andq = 1 andN ≥3). . . 135
4.8 Quadrant IV Outcomes (p= 1 and q= 0 andN ≥2). . . 136
4.9 Quadrant IV Outcomes (p= 1 and q∈(0,1) and N ≥3). . . 138
4.10 Quadrant IV Outcomes (p= 1 and q= 1 andN ≥2). . . 139
4.11 Number of Outcomes for the Four Quadrants. . . 140
5.1 Divisor Pair Mappings for N = 12. . . . 152
5.2 Divisor Pair Mappings for N = 8. . . . 158
5.3 The Divisor Pairs forN = 8 and Their Associated ˜D and ˜G Sets. . . 160
5.4 Sets of Divisor Pairs, Greatest Common Divisor Pairs, and Cardinalities. 167
5.5 List of the Sixteen Possibilities for Matches/Differences between the Values of the Corresponding Components (N = no, blank=yes). . . 174
5.6 The Divisor Pairs forN = 8 and Their Associated Sets. . . 194
5.7 The Four Possibilities for the Evaluation ofS. . . . 210
5.8 The Four Possibilities for Two Duplicate Components. . . 226
5.9 Number of Qualifying Contributions-Related Values (1≤N ≤20). . . . 236
6.1 Outcomes for the Joint Conditionp ≤t and t =m. . . . 242
6.3 The Three Cases for the Decision-Theoretic (DT) Condition in Quadrant IV. . . 253
6.4 Number of Qualifying Contributions (1≤N ≤20). . . 256
7.1 Feature Weights for Several Ranking Methods. . . 329
7.2 Document Distribution at the Front and Rear of An Actual Ranking. . . 333
8.1 Minimum Sample Sizes for Estimating Q With the Specified Margin of Error. . . 349
8.2 Wilcoxon signed ranks test with continuity correction (α = 0.01, two-tailed). . . 351
8.3 The relationships between p, t, p, t,A, and A when a collection has at least one relevant document (both A and A are defined for each of the 9 categories). . . 353
8.4 The relationships betweenp, t, p, t,A,and A when a collection does not have any relevant documents (A is defined, but A is undefined for each of the three categories). . . 353
8.5 Special Scenarios for A and A (Before Subsumption). . . 354
8.6 Combined Sets of Boundary Conditions forAandA (After Subsumption). 361
8.7 Combined Set of Boundary Conditions A (The Number of Weak 4-Compo-sitions When None of the Relevant Documents Contain the Query Term). 363
8.8 Combined Set of Boundary Conditions B (The Number of Weak 4-Com-positions When There is at Least One Relevant Document and Every Relevant Document Contains the Query Term). . . 364
8.9 Feature Weights for Several Ranking Methods. . . 376
9.1 Test Results for Kolmogorov-Smirnov test (two-tailed) for a test collection of 10 million synthetic documents and 100 unique randomly-generated queries. . . 389
10.1 Important Characteristics of the ASL, ESL, MZE, and MRR Performance Measures. . . 403
10.2 The MSL and ASL for Each Possible Sequence of Two Relevant Documents (A & B) and One Non-relevant Document (C). . . 409
10.3 Important Characteristics of the Extended and Adapted Versions of the ASL, ESL, MZE, and MRR Performance Measures. . . 413
10.4 Ranked List of Seventeen Documents (R=relevant). . . 416
10.5 Values of Selected Performance Measures For All Cut-off Points For Two Equivalence Classes. The higher ranked equivalence class has 30 docu-ments, the lower-ranked one has 20 documents. The number of relevant documents in these classes are, respectively, 10 and 5. . . 491
10.6 Values of Selected Performance Measures For All Cut-off Points For Two Equivalence Classes. The higher ranked equivalence class has 20 docu-ments, the lower-ranked one has 30 documents. The number of relevant documents in these classes are, respectively, 5 and 10. . . 492
B.1 The Unigram Language Models for the Documents . . . 524
B.2 The Unigram Language Model for the Corpus . . . 525
B.3 Document Term Probabilities for Query q (before smoothing) . . . 526
B.4 Estimated Probabilities for Query q (before smoothing) . . . 526
B.5 Document Term Probabilities for Query q (after smoothing) . . . 528
B.6 Estimated Probabilities for Query q (after smoothing) . . . 529
B.8 The Nine Most Discriminating and the Nine Least Discriminating Terms 534
E.1 Number of Qualifying Contributions (1 ≤N ≤40) . . . 544
E.2 Number of Qualifying Contributions (41 ≤N ≤120) . . . 545
List of Figures
2.1 The relationships between the sets of compositions and weak compositions. 23
2.2 The relationships between N, R, S, r0, r1, s0, s1, n0, and n1 can be succinctly expressed by this 2x2 contingency table. . . 25
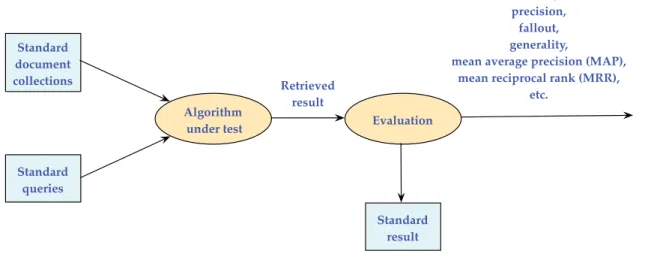
2.3 The Prototypical Experimental Retrieval Performance Evaluation Schema. Source: Adapted from Mooney (2006). . . 41
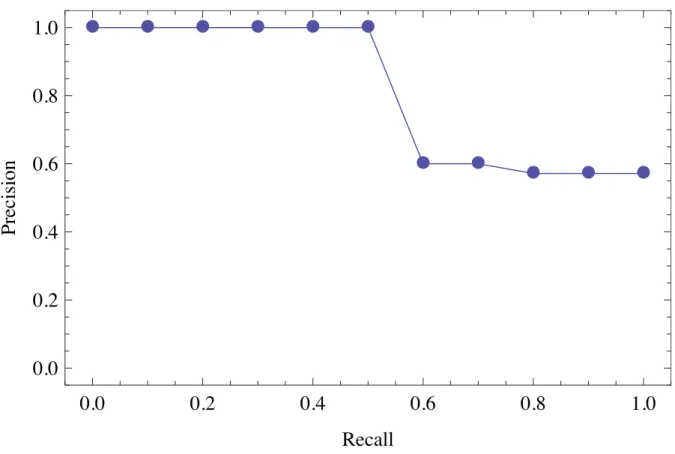
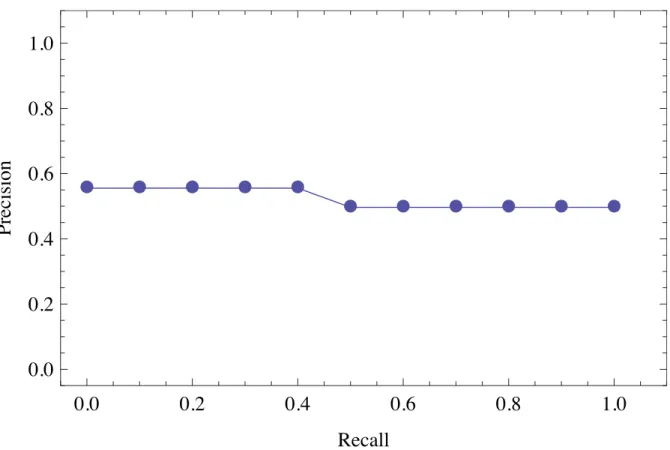
3.1 Recall-precision graph for the data in Table 3.4 on page 75. . . 75
3.2 Recall-precision graph for the data in Table 3.4. . . 85
3.3 Recall-precision graphs for the Cystic Fibrosis test collection and its three derivatives. . . 88
3.4 Recall-precision graphs for the four derivatives of the Cystic Fibrosis test collection and a synthetic collection. Each collection has 1239 documents. 89
4.1 The various conditions under which p,q, and t are defined/undefined. . . 115
5.1 Injective, Surjective, and Bijective Functions. . . 168
5.2 The Bijection Between Sets ˜D(8)2 and ˜G(8)2 . . . . 179
5.3 Example of the Intersection Between Three ˜G Sets WhenN = 8. . . . . 186
5.4 ER Notation. . . 188
5.5 ER Diagram of the Main Relationships. . . 191
5.7 This figure corresponds to the discussion in Section 5.10. . . 197
5.8 This figure corresponds to the discussion in Section 5.11. . . 207
5.9 Plot of the mean (Q) and standard deviation Q(1− Q)
for B for the CLM ranking method when 1≤N ≤200. . . . 237
6.1 Plot of the mean (Q) and standard deviation Q(1− Q) for B for the IDF ranking method when 1≤N ≤200. . . . 244
6.2 Plot of the mean (Q) and standard deviation Q(1− Q)
for B for the DT ranking method when 1≤N ≤200. . . . 257
7.1 This depicts an optimal ordering ofN documents. . . 265
7.2 This diagram details each of the 15 possible sample points that can occur in the sample space that is associated with an optimal ordering of 8 doc-uments (i.e., N = 8), with 5 of the documents having feature frequency 0 and 3 of them having feature frequency 1. . . 266
7.3 A permutation tree for 4 distinct objects named A, B, C, and D. . . 269
7.4 A generalized version of a permutation tree forr-permutations. . . 272
7.5 These are equivalent ways of viewing the number of members in an r -permutation from a counting perspective. . . 275
7.6 Distributions of A values for N = 10, 20, and 50, respectively. . . . 285
7.7 The frequency distribution and graph of the probability mass function for the data in Figure 7.2 on page 266. . . 298
7.8 The Two General Ranking Possibilities. . . 328
8.1 RSVs and Their Relation to Query and Document Weights. . . 376
10.1 This figure details the categories of agreement and disagreement on relative levels of performance for measuresm1 andm2 between 2 points iand j in a ranked vector V of documents, with point ioccurring, before, or at, the same ordinal position as point j. . . . 399
10.2 A Line Plot of the MSL and ASL From the Data in Table 10.2 on page 409. 411
10.3 These are the 6 levels of the RSV factor from Table 10.4 . . . 417
10.4 This diagram details the relationship between V (the vector of ranked documents) and T (the tie vector). . . 427
10.5 Vpre and Vc have the same number of sequences. . . 431
10.6 This diagram details the basic relationships that are associated with the equivalence class Ec that contains document cut-off k for the ASL,
preci-sion, recall, and MZE measures. . . 436
10.7 This diagram details the basic relationships that are associated with the equivalence class Ec˜ that contains the sth relevant document for the ESL measure. . . 448
10.8 This diagram details the relationships that are associated with the cut-off class E˜c for the ESL measure. . . 465
10.9 The information in this table is based on a set of documents that has three equivalence classes, namely,E1, E2,and E3. The E1 equivalence class has three documents (only 1 is relevant),E2 has five documents (4 of them are relevant), and E3 also has five documents (but only 2 are relevant). . . . 481
10.11Areas of agreement and disagreement for the ASL measure when it is compared to the MZE, ESL, and RR performance measures for the BC, CLM, DT, IDF, RC, and WC ranking methods. . . 488
10.12The left column contains the distinct plots from Figure 10.11 on page 488, along with detailed information for each of them. . . 494
List of Abbreviations
ASK Anomalous State of Knowledge
ASL Average Search Length
CF Cystic Fibrosis
CLM coordination level matching
DB database system
DT decision-theoretic
ESL Expected Search Length
GCD greatest common divisor
IDF inverse document frequency
IR information retrieval
IRS information retrieval system
IRDBS information retrieval-database system
MRR Mean Reciprocal Rank
MZE MZ-based E measure
List of Symbols and Notation
[k] the set of the first k positive integers . . . 22
N number of documents in a collection . . . 24
R number of relevant documents in a collection . . . 24
S number of non-relevant documents in a collection . . . 24
ni number of documents with feature frequency i . . . 24
ri number of relevant documents with feature frequencyi . . . 24
si number of non-relevant documents with feature frequency i . . . 24 n
k
number of combinations of n things taken k at a time . . . 26
Ck(n) number of compositions of n into k parts . . . 26
˜
Ck(n) number of weak compositions of n into k parts . . . 26
C(n, k) number of combinations of n things taken k at a time . . . 26
n! number of permutations of n distinct objects . . . 26
Σ summation . . . 51
loga natural logarithm of a . . . 51
P(a) probability of event a . . . 51
P(a|b) probability of event a given that event b has occurred . . . 51
Pr(a) probability of event a . . . 51
Pr(a|b) probability of event a given that event b has occurred . . . 51
Π multiplication . . . 52
a∝b a is proportional to b . . . 54 |a| cardinality of set/bag a . . . 66
a the greatest integer that is less than or equal to a . . . 83
a the least integer that is greater than or equal to a . . . 83
max(a, b) maximum of a and b . . . 90
N the set of natural numbers . . . 94
Q quality of a ranking method . . . 113
τ(N) the number of unique divisors of a positive integer N . . . 151
Z+ the set of positive integers . . . . 156
A normalized average position of a relevant document . . . 262
ASL Average Search Length . . . 263
@k document cut-off at positionkin ranked vectorV of documents 449
ESL@k(V,x) ESL at position k for a request of x documents . . . 449 ASL@k(V) ASL at position k in a ranked vectorV of documents . . . 459 P@k(V) precision at positionk in a ranked vectorV of documents . . . 460 R@k(V) recall at position k in a ranked vectorV of documents . . . 461 MZE@k(V) MZE at position k in a ranked vector V of documents . . . 462 RR@k(V) reciprocal rank at positionk in a ranked vectorV of documents 463
Chapter 1
Introduction
The purpose of this research was to investigate the characteristics of analytic measures for studying and predicting the performance of information retrieval (IR) systems and of systems that had both information retrieval and database capabilities. The use of these measures for prediction, rather than mainly for retrospection, was quite different from how many IR performance measures had been used in the past and were currently being used. Some related work, in a distributed database context, focuses on “analytical techniques for predicting the performance of various collection fusion scenarios” (Losee and Church, 2004).
Each of these types of systems was assumed to reference documents that were stored in a centralized database. In this dissertation, the former type of system was referred to as an information retrieval system (IRS) and the latter type was referred to as an information retrieval-database system (IRDBS). In particular, the research concentration in this dissertation was on a measure known as the Average Search Length (ASL) (Losee, 1998) and two measures that were closely related to it: the normalized average position of a relevant document (A) and the quality of a ranking method (Q).
Rijsbergen, 1979), and the reciprocal rank measure (Voorhees, 2001) that were defined at all points in a ranking and yielded correct results for both strongly- and weakly-ordered document collections; (3) a method that generated graphs which illustrated regions of agreement and disagreement between two performance measures for a vector of ranked documents; and (4) a procedure that determined when two performance measures con-sidered a document ranking for a vector V1 to be better than a document ranking for a vector V2.
The measures that were developed for this dissertation could aid in the understand-ing and prediction of system performance for sunderstand-ingle information retrieval queries that were submitted to either an information retrieval system or to an integrated informa-tion retrieval-database system. The mathematical models constructed for this research produced analytic results that were empirically validated.
There is a multitude of information retrieval performance measures, some more in-tuitive and easier to understand than others. Generally, a performance measure can be used in either a predictive or retrospective manner. Many of these measures can be more easily used retrospectively than predictively due to the problem of parameter estimation. Each performance measure possesses both strong and weak points. The determination of which measure is (more) appropriate for a particular situation is influenced by the goal(s) of the study or the audience.
Croft and Harper, 1979), decision-theoretic ranking (Losee, 1998), and coordination level matching (Losee, 1987).
1.1
Research Goals and Questions
This research developed combinatorial equations for the Average Search Length (ASL) measure and its independent variables, namely, the normalized average position of a rele-vant document (A), and the quality of a ranking method (Q) in a centralized information retrieval context. This research also extended the ASL, MZ-based E measure (MZE) (van Rijsbergen, 1979), Expected Search Length (ESL) (Cooper, 1968), and Mean Reciprocal Rank (MRR) (Voorhees, 2001) measures in two ways: (1) the values of each of these measures were calculable at an arbitrary position in a ranking and (2) the calculated values were correct even if the documents in a ranking are weakly-ordered.
Combinatoric arguments were utilized to help develop this descriptive information and proofs were constructed to show the equivalence of these combinatoric-based equations with their respective probabilistic counterparts. These entities were used to help char-acterize and predict the performance of various scenarios when optimal ranking (Losee, 1998), worst-case ranking, random ranking, and various other degrees of non-optimal ranking were assumed. Definitions of the major concepts, that were introduced above, immediately follow the statement of the three research questions below.
The research questions were:
1. What would be the characteristics of a combinatoric measure (CM ASL), based on the ASL, that performs the same as a probabilistic measure of retrieval performance, also based on the ASL?
actual rankings?]
3. When does the ASL measure and one of these measures (i.e., MZE (van Rijsber-gen, 1979), ESL (Cooper, 1968), and MRR (Voorhees, 2001)) both imply that one document ranking is better than another document ranking?
These three Research Questions (RQs) are occasionally referred to as RQ #1, RQ #2, and RQ #3, respectively, in the remainder of this dissertation.
1.2
Significance of this Research
The equations and techniques that were developed from this research could be used to predict and study performance, in terms of the Average Search Length (an intuitive measure for the user), for the inverse document frequency, coordination level matching, and decision-theoretic ranking methods ranking methods — without the need to estimate quality of ranking values from historical data. These equations and techniques could also be used to determine when two performance evaluation measures consider one document ranking to be better than another document ranking.
Based on the literature review for this dissertation, a novel aspect of this research was that these equations were developed by using a largely combinatoric approach. Combi-natoric techniques and results from combiCombi-natorics opened up new avenues of exploration and provided more insight into how various parameters interacted to affect the inverse document frequency, coordination level matching, and decision-theoretic ranking meth-ods.
compare more measures with respect to how well they agreed and disagreed with specific document rankings. The knowledge gained can help researchers and practitioners better understand the strengths and weaknesses of various ranking methods.
From an IR perspective, the use of combinatoric techniques means that the typical IR assumptions of term independence, uniformly distributed values, and equiprobable events can often be relaxed, or even eliminated, on a joint or individual basis, in order to develop better and more accurate models. Sometimes, during performance evaluation, if the probability of an event is not known, then this probability is either estimated or a subjective probability is provided. Combinatoric techniques often give researchers the ability to calculate an exact probability which can be used in lieu of an estimated or subjective one.
In particular, several combinatoric concepts and techniques are used in upcoming chapters to enable the calculation of exact (or close to exact) values for quality of rank-ing measures; normalized and unnormalized search lengths; and their associated means and standard deviations. Each of these are discussed in detail later, starting with the next chapter. Also, these chapters contain several illustrative examples. The concepts and techniques that are alluded to at the beginning of this paragraph include, but are not limited to, probability generating functions, Gaussian polynomials, compositions, partitions, k-subsets, permutations, combinations, asymptotics, and the Principle of In-clusion and ExIn-clusion. Citations for these concepts and techniques are provided as they are introduced in the subsequent chapters.
Historically, the preponderance of performance research in information retrieval (IR) has been of an experimental nature concerned with effectiveness rather than efficiency (Vogt, 1999; Grossman and Frieder, 2004).
and corporate environments. (Blanco and Silvestri, 2008)
Analytic models (Losee, 1998; Losee and Paris, 1999), where the focus is on prediction rather than experimentation, do not have the quantity of associated research as does research based on experimentation. In recent years, though, the interest in analytical research has increased. A large factor in this has been the ever-increasing size of document collections and the influence of the World Wide Web (Dong and Watters, 2004). During this time, there has been significant increases in computational speed (e.g., processor speed, memory access) and storage capacities with, of course, positive impacts on the performance of IR systems. However, the gains made in computational speed (which was growing at a linear rate) were more than offset by the growth of the sizes of document collections (which were growing at an exponential rate). “While people enjoy having access to this diverse data, they also have to face the problem of efficiently finding the information they really want” (Dong and Watters, 2004). This is a burden that should fall on the system, and not on the user.
A key to alleviating, or ameliorating this burden, is a better understanding of the search process and the impact that it has on the internal workings of a search engine and some of the choices that the engine has to make. Given the high degree of interest in the database and IR research communities in the development of IR systems that are either built on top of relational database systems or that integrate relational database and IR capabilities (e.g., IRDB systems), it is crucial that system developers have a better understanding of the factors that influence ranking, selectivity, and various execution costs. Analytic models of performance can help provide this insight. In addition, they can be used to help predict ranking, selectivity, and the choosing of one access plan over another in an IRDB system.
applications such as customer support, health care, and digital libraries require capabil-ities for both data and text management” (Chaudhuri et al., 2005). Neither traditional database (DB) management systems nor IR systems are flexible enough to handle these types of applications because they require that these systems handle both structured data and text well. DB systems are very good at handling structured data such as customer records for a business whereas IR systems are good at handling unstructured entities such as text documents. Neither is much good at handling each other’s bread-and-butter kinds of applications. Many years ago, when application uses did not have the degree of overlap that we have today, one could very much just exclusively use an IR or DB system, depending on the application. However, application requirements have changed much over just the past decade or so. The passage below provides insight into why systems that combine both IR and DB functionality are very important today.
DB and IR systems are currently separate technologies. Thirty years ago, the application classes that drove the progress of these systems were disjoint and did indeed pose very different requirements: classical business applications like payroll or inventory management on the DB side, and abstracts of publications or patents on the IR side. The situation is radically different today. Virtually all advanced applications need both structured data and text documents, and information fusion is a central issue. Seamless integration of structured data and text is at the top of the wish lists of many enterprises. Example applications that would benefit include the following:
• Customer support systems that track complaints and response threads and must ideally be able to automatically identify similar earlier requests. • Health care systems that have access to the electronic information produced
by all hospitals, medical labs, and physicians (with appropriate measures for privacy and authorization), and have the capability of monitoring trends and generating early alerts about health crises such as epidemic diseases.
• Intranet search engines for organizations with richly structured data sources in addition to traditional document repositories. (Chaudhuri et al., 2005)
are nearer the front of the sequence than those that are less likely to be relevant. This process is known as ranking. The primary benefit of ranking is that it puts the results (e.g., documents) into a known order and thereby saves the user from possibly having to inspect all of the documents just to find a few useful ones. There are many ways to rank documents. For example, the vector space model does it one way and the probabilistic model does it another way (Dominich, 2001). And, within the framework of a particular model, there are often several variations on that model’s basic ranking algorithm. For example, the information retrieval literature has a variety of term weighting schemes that have been considered for the vector space model (Salton and Buckley, 1988; Lee, 1995). Each model and associated ranking algorithm(s) have their own particular strengths and weaknesses. No one ranking algorithm always performs better than an arbitrary, but different, ranking algorithm in every situation. This is due in large part to the myriad of applications that a retrieval model and ranking algorithm may have to deal with over a wide spectrum of query-document search models and scenarios. One ranking algorithm, or method, may work well when the document collection is of moderate size and, say, it contains a high percentage of relevant documents for the query submitted to its associated IR (or IRDB) system. Another ranking algorithm may perform well when the document collection is large but not so well when it is small or of moderate size.
Chaudhuri et al. provide additional justification for why a single ranking algorithm is inappropriate for all situations, noting that:
in terms of scores. Also, some applications may wish to produce variable-length result lists by thresholding on absolute scores rather than presenting the top k with a fixed k, if some of the top k results are only marginally relevant. (Chaudhuri et al., 2005)
Suppose that, based on certain parameters and their values, it is possible to determine which of several ranking algorithms will perform better in some situations than in others. Also, suppose that for a particular document collection and query, an IR (or IRDB) system can estimate the values of these parameters. These assumptions, if valid, give the retrieval system the ability to choose the best algorithm in its repertoire for the situation at hand. This was a major goal of this research and represents one of the ways in which the research in this dissertation can be applied.
1.3
Wider Applicability of the Extended Measures
The performance measure equation extensions that were developed in this dissertation for the ASL, MZE, ESL and MRR measures had a wider range of applicability than the settings that they were used in for the dissertation. These measures, and the methodol-ogy that was used to develop their associated equations, could also be applied in many settings where the query-document model was different than the one that was used in this dissertation.
contained, and the number of relevant documents that each class contained. In addition to this common information, all the performance measure combinatoric models required the document cut-off value and, if the measure was the ESL, also required the requested number of relevant documents. This relevance and RSV information could be obtained efficiently; to collect this information, only a single had to be made over the documents in a vector V of ranked documents.
IR performance evaluation software, like the trec eval programs (Voorhees and Har-man, 2005), often lets the user of that software conflate graded relevance values, or continuous relevance values, to binary relevance values (Kek¨al¨ainen and J¨arvelin, 2002). This was accomplished by establishing a threshold value for the relevance value. Any document that had an RSV that equals or exceeds this threshold value was considered to be a relevant document by the software; otherwise, the document was considered to be a non-relevant document.
1.4
Summary
Chapter 2
Background
Retrieval performance measures attempt to provide some indication of how well an in-formation retrieval system performed (if used in a retrospective manner) or is expected to perform (if used in a predictive manner). The Average Search Length is the major measure that is used in this research. Much terminology and concepts appear as part of this research. Definitions of many of them are a part of this chapter. It is important to note that the research that is discussed in this document uses a single term model.
all of the query terms be present in a document for a match to occur? Do multiple occurrences of a query term mean that they have more weight than a lesser number of occurrences?
Each of the above examples represents issues that have the potential to complicate a retrieval model. The effect of this is that it may hinder the understanding of the characteristics of the information retrieval (IR) model under investigation.
The discussion of the definitions for the terminology and concepts that are used in this research starts by stating that the formula for the Average Search Length (Losee, 1998) is
ASL =NQA+Q A+ 1/2, (2.0.1)
then proceeds by specifying the roles of the independent variables, followed later with a more in depth treatment of these entities. Briefly, N is the number of documents to be ranked, Q is the probability that the ranking is optimal, and A is the normalized expected position of a relevant document from the front (i.e., document position 1) of the ranking. In the above formula,A is defined as 1− Aand Qis defined as 1− Q. The values of Q and A are in the closed interval [0,1].
The major part of the process of estimating the ASL involves computing the weighted mean ofAandA with the weights beingQ(the proportion of rankings that are optimal) and Q (the proportion of rankings that are worst-case), respectively.
the methods they use will likely have much in common with those used in this research. Documents with a binary query feature with frequency d may be presented to the user in 1 of 2 distinct orders: all the documents with feature frequency d precede any document with feature frequency d = 1−d (optimal ranking) or vice versa (worst-case ranking). Furthermore, it is assumed that the term weight ford is greater than that for
d. In essence, this holds when the query terms are positive discriminators. If the terms are not positive discriminators, then the features must be switched (re-parameterized) so that the product of d and the term weight is greater than the product of d and the term weight. If we letd= 1, then, in a best-case (or optimal) ranking, all the documents with feature frequency 1 are retrieved before those with feature frequency 0. Likewise, in a worst-case ranking, all the documents with feature frequency 0 are retrieved before those with feature frequency 1.
The mean position, A, on a unit scale, of a relevant document can be computed as the sum of the weighted positions of those relevant documents with feature frequencies
d and d, respectively. These weighted positions are normed to be in the closed interval [0,1]. A document at the front of the ordering has a position of 0 because it is at the low end of the spectrum (good performance), and a document at the back has a position of 1 because it is at the high end (bad performance). A can be viewed as the expected proportion of all documents that must be examined in the search process to reach the average position of a relevant document in the ordering. It can also be viewed as the mean normalized position of a relevant document in the ordering.
The variable A is computed by noting that documents with feature frequency d are at the low end of theA spectrum (good performance) and those with feature frequency
d are at the high end of the spectrum (poor performance). The formula forA is
A= 1 + Pr(d)−Pr(d|rel)
Notationally, the equation can be simplified by letting p= Pr(d|rel) and t= Pr(d):
A= 1 +t−p
2 . (2.0.3)
A ranking is an ordering or sequencing. With respect to the ranking of documents, in response to a query, an optimal ranking is a sequence where the documents that contain the query term are at the front of the sequence and any that do not contain the term appear after the last document that contains the term in that sequence. A worst-case ranking is the polar opposite (i.e., all of the documents that contain the term are at the rear of the sequence, all of the other documents are at the front). A random-case ranking is a sequencing where it is equally likely for any document, whether or not it contains the term, to occupy an arbitrary position in that sequence.
2.1
Several Alternative Measures That Are of
Inter-est
Of course, the ASL measure is far from the only measure that can be used to help assess ranking performance. Some of the many other measures are the Expected Search Length (ESL) (Equation 2.1.1 on the following page), the Mean Reciprocal Rank (MRR) (Equa-tion 2.1.3 on page 17), and the MZ-based E measure (MZE) (Equa(Equa-tion 2.1.4 on page 17). These three measures are of great interest for the last of the three research questions being addressed by this dissertation. The discussion for this third research question takes place in Chapter 10 (The ASL Measure and Three Frequently-Used Performance Measures).
2.1.1
Expected Search Length
The ESL (Cooper, 1968) is similar to the Average Search Length. The major difference is that it counts the mean number of non-relevant documents retrieved before the kth relevant document is retrieved in a rank-ordered vectorV of documents. In other words, it counts the mean number of non-relevant documents retrieved in order to produce a given number k of relevant documents. For a query q, a vector V of ranked documents, and a request for the first x relevant documents, the ESL can be defined as
ESL(V, x) =j + i·s
r+ 1, (2.1.1)
where l is the level at which the xth relevant document occurs, j is the total number of documents irrelevant toq in all levels which precede levell in the weak ordering,iis the number of documents irrelevant toqin levell,sis the number such that the sth relevant document found in level l of the weak ordering would complete the search for request q,
and r is the number of documents level l which are relevant to q.
Caution must be taken when referring to the Expected Search Length (ESL), though, because Cooper’s definition is not universally used (Korfhage, 1997). Some researchers in the IR community have defined the ESL to be the mean number of total documents (i.e., both relevant and non-relevant) retrieved in order to obtain the xth relevant document in a rank-ordered vectorV of documents. In other words, this alternative ESL definition counts the mean number of total documents retrieved in order to produce a given number
2.1.2
Mean Reciprocal Rank
There are several performance evaluation measures in IR that are based on the concept ofreciprocal rank (RR). The most well-known one is themean reciprocal rank (MRR). It is used very heavily in the TREC Question Answering (QA) tracks (Voorhees and Tice, 1999; Voorhees, 1999) to assess the performance of an IR system on a set of questionsQ.
More formally, the reciprocal rank at document cut-off value k on a rank-ordered vector V of answers is defined as
RR@k(V) = ⎧ ⎪ ⎪ ⎪ ⎪ ⎪ ⎪ ⎨ ⎪ ⎪ ⎪ ⎪ ⎪ ⎪ ⎩
1/i, if ∃i≤k, such thatV[i] is a correct answer, and ∀j < i, V[j] is an incorrect answer;
0, otherwise.
(2.1.2)
The above expression indicates that if a correct answer occurs among the first k
answers in a rank-ordered vectorV of answers, then the expression’s value is the reciprocal of the rank that corresponds to the first correct answer. If there is no correct answer among the first k answers, then the reciprocal rank is defined to be 0. For example, assume that k = 5 and that correct answers are at ranks 2 and 3. Then the reciprocal rank is 1/2 because the first correct answer was at rank 2. Now, assume that the first correct answer is at rank 7. In this case, the reciprocal rank is 0 because the first correct answer was at a rank that is greater than 5.
According to Lin et al. (2008), two commonly used measures of a QA system’s perfor-mance are “the top-1 accuracy and the top-5 mean reciprocal rank.” The top-1 accuracy for a question set Q is the proportion of correct answers that are at rank 1 for the questions in Q. It is defined as
whereVq is a rank-ordered vector of answers for questionq. The mean reciprocal rank at
document cut-off k for a vector V of answers is defined as
MRR(Q)@k(V) =
q∈Q
RR@k(Vq)
|Q| , (2.1.3)
where Q is a set of questions, q ∈ Q, and Vq is the rank-ordered vector of answers for
question q. Expressed another way, the MRR is the mean of the reciprocals of the ranks of the first correct answer that occurs among the top k (in TREC, k = 5) answers in a ranking for each question. Note that the sets of answers represented by V and Vq are
identical.
2.1.3
MZ-Based E Measure
This measure is based on measurement theory (Bollmann and Cherniavsky, 1981) (as contrasted to Swets’ E measure which is based on the Receiver Operating Characteristics (ROC) model (Swets, 1969; Pepe, 2003)).
This measurement theory version of the E measure (MZE) (van Rijsbergen, 1979; Baeza-Yates and Ribeiro-Neto, 1999; Manning et al., 2008) is defined as
MZE = 1− 2
P−1+R−1, (2.1.4)
where P represents precision and R represents recall.
2.2
Mathematical Presentation and Techniques
and limitations.
2.2.1
Notation
This dissertation used mathematical notation, some of which may be unfamiliar to its readers. The List of Symbols that starts on page xxxiii contains the symbols and con-structs that are widely used in this dissertation. The logarithm is the natural logarithm (i.e., log(x) ≡loge(x), where e = 2.71828...). In practice, the logarithm base could just as easily have been 2, 10, 16, or some other positive number greater than 1, because a logarithm in one base can always be transformed to one in another base by multiplying it by a constant that is specific to the two bases.
2.2.2
Proofs
“[P]roofs play a central role in mathematics [and in mathematics-related portions of many of the sciences], and deductive reasoning is the foundation on which proofs are based” (Velleman, 1994). The proofs that appeared in this dissertation came almost exclusively from Chapter 5 (calculating Q for the coordination level matching (CLM) ranking method), Chapter 6 (calculating Q for the inverse document frequency (IDF) and decision-theoretic (DT) ranking methods), Chapter 7 (calculating A and the ASL), and Chapter 8 (formula validation). Many of the concepts that were introduced in these 3 chapters needed to be rigorously established. Lemmas (i.e., conjectures) were associated with these concepts and the validity of each lemma was established by a proof.
deduces the desired conclusion” (Bloch, 2000). Two strengths of a proof are that (1) unlike a theory or hypothesis, it is not falsifiable and that (2) the derivation of a proof can provide additional insight into a problem. One of the limitations of a proof is that it is only available within the realm of precisely defined mathematical constructs. Its power beyond those strictures depends upon the closeness with which the mathematics models the entity being analyzed.
2.2.3
Probability Theory and Models
Probability theory is the branch of mathematics that deals with the analysis of random events. One of its main uses, in the research contained in this document, was to con-struct probability models. A probability model is a scientific model that incorporates uncertainty. These types of models are also known as stochastic models.
A scientific model is an abstract and simplified description of a given phenomenon. Certain basic aspects of this phenomenon are isolated as being of primary interest, and an analogy is drawn between these aspects and some logical structure concern-ing which we already have detailed information. Scientific models are most often based on mathematical structures ...
When an investigator builds a mathematical model for a particular natural phe-nomenon (say, the motion of an asteroid), important elements of this phephe-nomenon (the position, mass, shape, and speed of the asteroid) are identified with the ba-sic elements of some mathematical structure (numbers). Certain fundamental facts connecting the important elements of the phenomenon are restated as axioms relat-ing the analogous mathematical entities. Finally, the more complex relationships between the basic elements of the natural phenomenon are made to correspond to laws or theorems in the mathematical structure. If this correspondence is rea-sonably valid, the investigator does not have to experiment haphazardly with the phenomenon to find new facts; instead, logical arguments based on the mathemat-ical axioms can lead to a theorem that presumably has an analogy to a law of nature. Experimentation can now be directed toward verifying this law.
The above quote describes the concepts of scientific and mathematical models. Basically, a model is an abstraction of some real world phenomena where the relationships between the various parts can be modeled mathematically. Often, mathematical rules, or axioms, can be developed to manipulate and study parts of the model. Many characteristics of probabilistic models can be determined analytically. However, when these models are too complex or intractable for analytical treatment, simulation methods are often used to help answer questions about the phenomena being studied.
2.2.4
Simulation
Simulation is used in Chapter 8 to help estimate the quality of ranking value for large document collections in situations where it is infeasible to use brute force techniques to determine these values.
The Latin verbsimulare means to imitate or mimic. The purpose of a simulation model is to mimic the real system so that its behavior can be studied. The model is a laboratory replica of the real system, a microworld (Morecroft, 1988). By creating a representation of the system in the laboratory, a modeler can perform experiments that are impossible, unethical, or prohibitively expensive in the real world. (Sterman, 1991)
According to Law (2006), the main advantages of simulation are that it allows ar-bitrary model complexity; it circumvents analytically intractable models; it facilitates what-if and sensitivity analyses; the process of building a model can lead to system im-provements and greater understanding; and it can be used to verify analytic solutions. The main disadvantages of simulation are the following: it provides only solution esti-mates; it only solves one set of parameters at a time; and it can take a large amount of development and computer time.
2.2.5
The Query-Document Model
In the query-document model that was used in this dissertation, a query consisted of a single term and each document contained at least one term. The query term may, or may not, be contained in a document. Multiple occurrences of a term in a document have no more significance than a single occurrence of the term. A document is either relevant or non-relevant to a query; that is, the model uses binary relevance.
A particular query and an associated document collection of cardinality N was mod-eled in this research by a set of ordered arrangements of nonnegative integers. Each ordered arrangement was a sequence of k > 0 natural numbers that summed to N. These were known as weak compositions of sizek (i.e.,weak k-compositions). In this dis-sertation, the value ofk was almost always 4. However, there were a few instances where
2.2.6
The Relationship Between the Query-Document Model
and Weak
4
-Compositions
We start this section by providing detailed information about weak and strong com-positions. After that, we discuss how weak and strong 4-compositions can be used to represent the query-document model that was used in this dissertation.
If each of the k numbers in an ordered arrangement (such as the type of arrange-ment that is introduced in Section 2.2.5) must be positive, then the arrangearrange-ment is not only a weak k-composition, but is also a (strong) k-composition. The set of (strong)
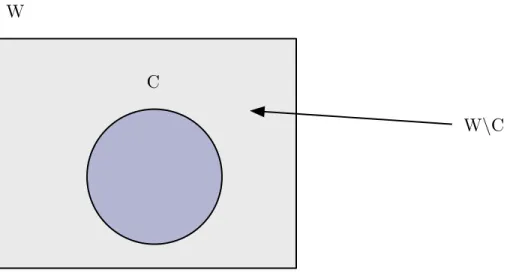
k-compositions is a proper subset of the set of weak k-compositions. Figure 2.1 on the following page depicts the relationship between sets of weak compositions and sets of compositions. From this point on, (strong) compositions are generally referred to as simply compositions unless the author wants to contrast a (strong) composition with a weak one. The notation [k], used in the quote below from B´ona (2006), denotes the set of the firstk positive integers, that is, [5] represents the set {1,2,3,4,5}.
More formally, here are definitions for weak compositions and compositions: A sequence (a1,a2, ...,ak) of integers fulfilling ai ≥0 for all i, and (a1 + a2 + ... +ak) = nis called aweak composition ofn. If, in addition, the ai arepositive for all i∈[k], then the sequence (a1,a2, ... , ak) is called a composition of n. (B´ona,
2006)
For example, the compositions of size 4 of the number 5 are (1, 1, 1, 2), (1, 1, 2, 1), (1, 2, 1, 1), and (2, 1, 1, 1). An alternative way of viewing them is as ordered sums:
5 = 1 + 1 + 1 + 2 = 1 + 1 + 2 + 1 = 1 + 2 + 1 + 1 = 2 + 1 + 1 + 1.
C W
W\C
Figure 2.1: The relationships between the sets of compositions (C) and weak compositions (W) for a positive integernintok parts. The circle represents the set of compositions and the backslash (\) symbol denotes set complementation. The set W\C denotes the weak compositions that are not simultaneously compositions. That is, the set W\C denotes the weak compositions that are not members of set C. The gray region represents the members of W\C.
An alternative viewing is:
3 = 0 + 3 = 1 + 2 = 2 + 1 = 3 + 0.
that are relevant but do not contain the query term (r0 denotes the cardinality of this category), the documents that are non-relevant and contain the query term (s1 denotes the cardinality of this category), and the documents that are non-relevant and do not contain the query term (s0 denotes the cardinality of this category).
Each of these categories contains anywhere from none to all of the documents in the collection. No matter how many documents each category contains, though,
r0+r1+s0+s1
must always equal N because each document must be a member of exactly one of these 4 categories. Notationally, let
N =R+S =n0+n1
represent the total number of documents in a collection with
R =r0+r1
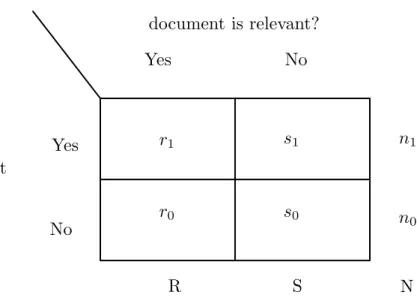
representing the number ofrelevant documents andS =s0+s1 representing the number of non-relevant documents. Figure 2.2 on the next page uses a contingency table to depict the relationships between these variables.
The above requirements are very naturally modeled by a set of weak compositions of size 4 ofN. Each weak composition is represented by the following ordered arrangement: (r1,s0,r0, s1). There is nothing special about this particular arrangement, the sequence above is just one of 4! = 24 different ways that we could have arranged those 4 distinct symbols. Two of the remaining 23 possibilities are (r0, r1, s0, s1) and (r0, s0, r1, s1).
n0 n1
N R S
r0 r1
s0 s1
query term is present in the document?
document is relevant? Yes No
No Yes
Figure 2.2: The relationships discussed earlier between N, R, S, r0, r1, s0, s1, n0, and
n1 can be succinctly expressed by this 2x2 contingency table.
documents can be divided into 4 non-overlapping (i.e., mutually exclusive) categories. The set of weak compositions for a particular query and an associated document collection of cardinality N represents all of the unique ways that N documents could be assigned to the 4 categories just mentioned above. How to calculate the cardinality of this set is discussed below.
A primary item of interest in some of the modeling scenarios that this research ex-plored was the sample space of weak compositions for an N-document collection. More specifically, the interest was in the generation of the sample space and the number of weak compositions in this space whose elements satisfied particular mathematical constraints. This research mainly used weak compositions of size 4 to help determine probabilities or proportions in various modeling scenarios.