Sources of Variation in Sweat Chloride Measurements in
Cystic Fibrosis
Joseph M. Collaco1, Scott M. Blackman1, Karen S. Raraigh1, Harriet Corvol2,3, Johanna M. Rommens4,
Rhonda G. Pace5, Pierre-Yves Boelle3,6,7, John McGready8, Patrick R. Sosnay1, Lisa J. Strug4, Michael R. Knowles5, and Garry R. Cutting1
1
School of Medicine and8Bloomberg School of Public Health, Johns Hopkins University, Baltimore, Maryland;2Assistance Publique-H ˆopitaux de Paris, Trousseau Publique-Hospital, Paris, France;3Institut National de la Sant ´e et la Recherche M ´edicale, Paris, France;4The Hospital for Sick Children and the University of Toronto, Toronto, Canada;5Marsico Lung Institute/Cystic Fibrosis and Pulmonary Diseases Research and Treatment Center, School of Medicine, University of North Carolina at Chapel Hill, Chapel Hill, North Carolina;6Sorbonne Universit ´es, Universit ´e Pierre et Marie Curie, Paris, France; and7Assistance Publique-H ˆopitaux de Paris, Saint-Antoine Hospital, Paris, France
ORCID ID: 0000-0002-2581-4372 (J.M.C.).
Abstract
Rationale:Expanding the use of cysticfibrosis transmembrane conductance regulator (CFTR) potentiators and correctors for the treatment of cysticfibrosis (CF) requires precise and accurate biomarkers. Sweat chloride concentration provides anin vivo assessment of CFTR function, but it is unknown the degree to which CFTRmutations account for sweat chloride variation.
Objectives:To estimate potential sources of variation for sweat chloride measurements, including demographic factors, testing variability, recording biases, andCFTRgenotype itself.
Methods:A total of 2,639 sweat chloride measurements were obtained in 1,761 twins/siblings from the CF Twin-Sibling Study, French CF Modifier Gene Study, and Canadian Consortium for Genetic Studies. Variance component estimation was performed by nested mixed modeling.
Measurements and Main Results:Across the tested CF population as a whole,CFTRgene mutations were found to be the primary determinant of sweat chloride variability (56.1% of
variation) with contributions from variation over time (e.g., factors related to testing on different days; 13.8%), environmental factors (e.g., climate, family diet; 13.5%), other residual factors (e.g., test variability; 9.9%), and unique individual factors (e.g., modifier genes, unique exposures; 6.8%) (likelihood ratio test,P,0.001). Twin analysis suggested that modifier genes did not play a significant role because the heritability estimate was negligible (H2= 0; 95% confidence interval, 0.0–0.35). For an individual with CF, variation in sweat chloride was primarily caused by variation over time (58.1%) with the remainder attributable to residual/ random factors (41.9%).
Conclusions:Variation in theCFTRgene is the predominant cause of sweat chloride variation; most of the non-CFTRvariation is caused by testing variability and unique environmental factors. If test precision and accuracy can be improved, sweat chloride
measurement could be a valuable biomarker for assessing response to therapies directed at mutant CFTR.
Keywords:biomarker; ivacaftor; lumacaftor; heritability; pilocarpine iontophoresis
( Received in original form March 2, 2016; accepted in final form June 3, 2016 )
Supported by grants from the Cystic Fibrosis Foundation (CUTTIN00A0, KNOWLE00A0), Cystic Fibrosis Canada (2626), the National Institutes of Health (R01HL068927, R01DK44003, R01HL068890), and the Canadian Institutes of Health Research (MOP-258915).
Author Contributions: Conception and design, J.M.C. and G.R.C. Acquisition of data, J.M.C., K.S.R., H.C., J.M.R., R.G.P., P.-Y.B., L.J.S., M.R.K., and G.R.C. Analysis, J.M.C., S.M.B., K.S.R., R.G.P., and J.M. Interpretation, J.M.C., S.M.B., H.C., L.J.S., J.M., P.R.S., M.R.K., and G.R.C. First draft, J.M.C. and G.R.C. All authors revised the manuscript critically, gave approval for publication, and agreed to be accountable for all aspects of this work.
Correspondence and requests for reprints should be addressed to Joseph M. Collaco, M.D., Ph.D., Johns Hopkins University School of Medicine, 200 North Wolfe Street, Baltimore, MD 21287. E-mail: [email protected]
This article has an online supplement, which is accessible from this issue’s table of contents at www.atsjournals.org
Am J Respir Crit Care Med Vol 194, Iss 11, pp 1375–1382, Dec 1, 2016 Copyright©2016 by the American Thoracic Society
Cysticfibrosis (CF) is a monogenic autosomal-recessive life-shortening disorder affecting about 70,000 individuals worldwide. The disorder is caused by dysfunction of the CF transmembrane conductance regulator (CFTR), which is a cAMP-regulated chloride and bicarbonate channel (1, 2). Loss of CFTR function in the sweat gland leads to an elevation in chloride concentration. In the epithelia of the lungs and pancreas, CFTR dysfunction causes aberrant ion and water movement leading to obstruction and eventual destruction of both organ systems (3). Recent success in augmenting the function of CFTR bearing some of the most common mutations has energized efforts to develop molecular therapies for all disease-causing variants (4, 5).
The U.S. Food and Drug
Administration–approved indications for use of the CFTR potentiator ivacaftor (Kalydeco) and the combination of ivacaftor and a CFTR corrector lumacaftor (Orkambi) (6) includes 11CFTRmutations (7) that encompass approximately 60% of all individuals with CF. Expanding the use of CFTR-targeted drugs to all patients with CF is challenging for several reasons. First, the remaining 40% of affected individuals carry at least 1,700 differentCFTR
mutations (8). Many of these mutations occur in one or only a few individuals with CF. Thus, traditional clinical trials that enroll sufficient numbers of subjects to reveal statistically significant differences among treatment groups will be difficult to conduct. Second, accurate biomarkers are needed for measuring CFTR function, because small molecule therapies may not provide an equivalent clinical improvement for allCFTRmutations. Lung function is an important endpoint measure because it is the primary cause of morbidity and is correlated with survival in CF (9). However, considerable variability in lung function measures occurs among patients of the same age and bearing the sameCFTR mutations (10–12). The substantial variation is caused by contributions both from modifier genes and environmental factors (13, 14), thus making lung function an imprecise measure of CFTR function. This may be reflected in studies of CFTR-targeted drugs where lung function (FEV1) is not tightly correlated with other measures of CFTR function, specifically sweat chloride measurements (4, 15–17).
The chloride concentration in sweat could serve as a useful biomarker of CFTR function in vivoin assessing the response to molecular treatments (18). Indeed, prior research studies have shown correlation between functional classes of CFTR variants and sweat chloride concentration (19, 20). In clinical use, patients suspected to have CF typically receive the test for diagnostic purposes at the time of initial presentation. Serial sweat chloride measurements can be used to follow the effects of therapies directly affecting CFTR function (4, 16, 17, 21); however, there is an incomplete understanding of the causes of variation in this measure (15, 22). We sought to estimate potential sources of variation for sweat chloride measurements, including demographic factors, testing variability, recording biases, andCFTRgenotype itself. The twins and siblings affected with CF also allowed estimating the contribution of genetic modifiers to sweat chloride measurement variability. Some of these results have been previously reported in the form of an abstract (23).
Methods
Study Sample
The primary population for this study (Table 1) included 1,761 subjects with CF,
including 1,697 twins and siblings from the CF Twin-Sibling Study, 40 twins from the French CF Modifier Gene Study, and 24 twins from the Canadian Consortium for Genetic Studies. Written consent was obtained from all subjects and this study was approved by the Johns Hopkins University Institutional Review Board (Protocol NA–00035659). In addition, sex and age effects were assessed in an independent population of unrelated individuals with CF and homozygous for the most commonCFTRmutation, Phe508del(n = 1,191), recruited for the Genetic Modifier Study at the University of North Carolina and Case Western Reserve University (24).
Demographics
Race/ethnicity was self-reported in the CF Twin-Sibling Study only with subjects with any nonwhite ancestry defined as nonwhite. Exocrine pancreatic
sufficiency, a common manifestation of CFTRdysfunction, was defined by genotype for 1,592 subjects (90.4% of subjects) as being sufficient with one or more“pancreatic sufficient”mutations or being insufficient with two“insufficient” mutations, and by clinical data for 149 subjects (8.5%) where genotype data was indeterminate or not available. The
“sufficiency”of mutations was based on CFTR2 population level data for mutations (www.cftr2.org) (25, 26). For 20 subjects (1.1%) pancreatic status was unable to be determined.
Sweat Chloride Measurements A total of 2,678 sweat chloride measurements (mmol/L) obtained by pilocarpine iontophoresis were extracted from clinical records. Data for subjects in the CF Twin-Sibling Study were supplemented with data obtained from the U.S. CF Foundation Patient Registry. Published guidelines state that sweat chloride measurements greater than 150–160 mmol/L are not physiologically compatible (27–29); 39 measurements greater than 145 mmol/L were dropped. Minimum, mean, and maximum values were based on all available measurements from an individual.
Statistical Analysis
The contribution ofCFTRgenotype to sweat chloride variation was estimated using a nested-factor mixed model for
At a Glance Commentary
Scientific Knowledge on the Subject: Expanding the use of cystic fibrosis transmembrane conductance regulator (CFTR) potentiators and correctors for the treatment of cystic fibrosis requires precise and accurate biomarkers. Sweat chloride concentration provides anin vivoassessment of CFTR function, but the degree to which CFTRmutations account for sweat chloride variation is unknown.
What This Study Adds to the Field: We found that variation in the CFTRgene is the predominant cause of sweat chloride variation; most of the non-CFTRvariation is caused by testing variability and unique
variance component estimation with all available measurements (STATA command xtmixed with REML option; StataCorp LP, College Station, TX) (30). In our model, measurements by testing date were nested inside individuals, who in turn were nested inside families, which in turn were nested insideCFTRgenotypes. The mixed model was limited to subjects with at least onePhe508delmutation;CFTR genotype groups for this model were assigned by the non-Phe508delmutation for Phe508delheterozygotes and into a single group forPhe508delhomozygotes. For heritability calculations, the maximum sweat chloride measurement for an individual was used for subjects who had more than one measurement recorded. Heritability was estimated by calculating the Pearson correlation coefficients for sweat chloride measurements for monozygous (MZ) twins, dizygous (DZ) twins, and siblings, then subtracting the coefficient for DZ twins (or siblings) from the coefficient for MZ twins, and multiplying the difference by 2 (31). Heritability estimates less than 0 and greater than 1.0 were reported as 0 and 1, respectively. Heritability confidence intervals were estimated by bootstrapping (32). The effects of age on sweat chloride were also assessed using linear regression clustered by family; subjects without a documented age at the time of testing (n = 14) were excluded from age-adjusted analyses. Families with discordantCFTR genotypes were not used for heritability or mixed model analyses. Linearity assumptions were assessed as part of the modeling process. Analyses were performed using Stata IC 11.0 (StataCorp LP, College Station, TX).
Results
Demographics
A total of 2,639 measurements were available for analysis for 1,761 subjects in the primary population, including one measurement only for 1,073 subjects, two measurements for 552 subjects, three for 91 subjects, four for 38 subjects,five forfive subjects, and six for two subjects. The average maximum sweat chloride values for subjects who had more than one test recorded (98.6620.0 mmol/L; n = 688) were not different than the sweat chloride measurement for those subjects who only had a single test recorded (97.4619.7 mmol/L; n = 1073;P= 0.18) (Figure 1).
However, for those who had more than one test recorded, the averages of their mean values (93.0619.7;P,0.001) and minimum values (87.4621.7;P,0.001) were different than the single value for those who had only one test recorded. The differences indicated a bias toward the maximum value being recorded, likely caused by healthcare providers preferentially entering the highest sweat chloride value when multiple tests had been performed. To address this bias, only the maximum sweat chloride value for each subject was used for the analyses that follow, except the mixed model where all values were used to estimate the contribution of testing variability. The average of the maximum sweat chloride values for all 1,761 subjects was 97.9619.8 mmol/L (range, 11.0–145.0). The mean age of testing was 3.266.2 years (range, 0–52.9; n = 1,747) for subjects with data available.
Age Influences Sweat Chloride Measurements
Wefirst wished to ascertain if age, sex, or race/ethnicity played a role in sweat chloride variation, so as to adjust for these factors if appropriate. To exclude variation caused byCFTR, we restricted these analyses to the largest group of subjects with an identicalCFTRgenotype (822 individuals homozygous for the most commonCFTR mutation [Phe508del]). Maximum sweat chloride values per individual were Table 1. Demographics
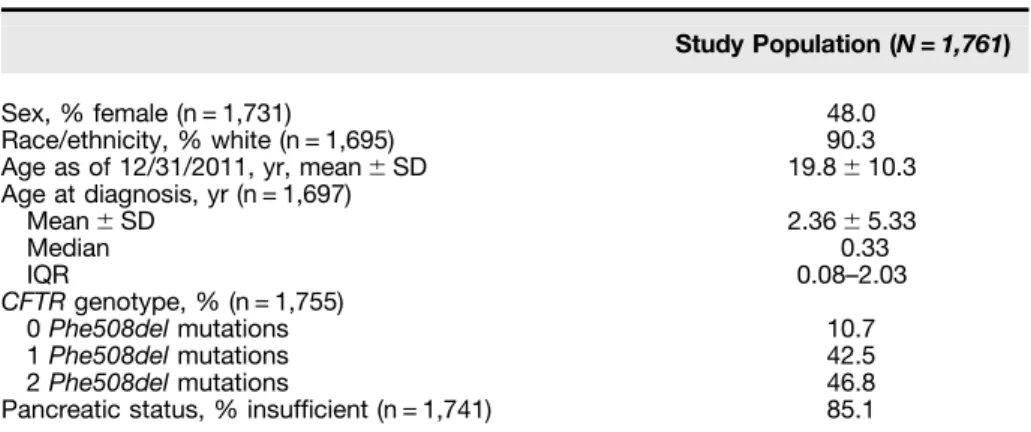
Study Population (N=1,761)
Sex, % female (n = 1,731) 48.0
Race/ethnicity, % white (n = 1,695) 90.3 Age as of 12/31/2011, yr, mean6SD 19.8610.3 Age at diagnosis, yr (n = 1,697)
Mean6SD 2.3665.33
Median 0.33
IQR 0.08–2.03
CFTRgenotype, % (n = 1,755)
0Phe508delmutations 10.7
1Phe508delmutations 42.5
2Phe508delmutations 46.8
Pancreatic status, % insufficient (n = 1,741) 85.1
Definition of abbreviations: CFTR = cystic fibrosis transmembrane conductance regulator; IQR = interquartile range.
120
100
80
60 40
20
0 1
(n=1,073) (n=552)2 (n=91)3 (n=38)4 Number of Sweat Chloride Tests
Sweat Chloride (mmol/L)
5 (n=5)
Maximum Mean Minimum
6 (n=2)
normally distributed around a mean of 101.3614.9 mmol/L, illustrating the variability of measurements, even among individuals with identicalCFTRgenotypes (Figure 2).
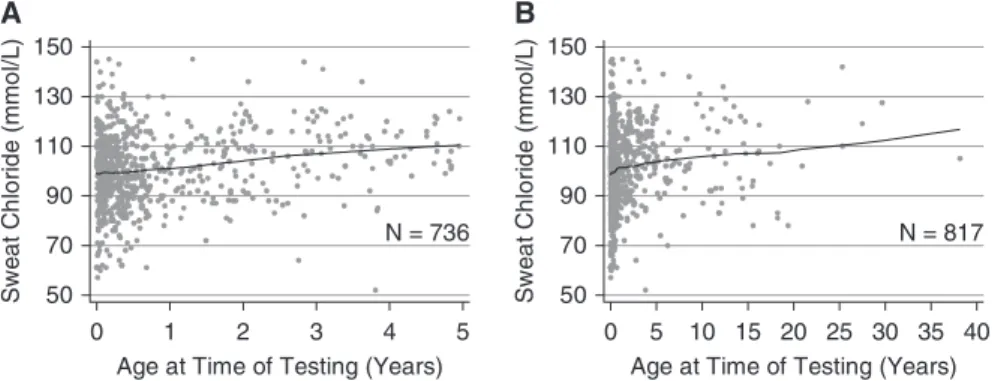
Using regression, increasing sweat chloride values were associated with increasing age (n = 817Phe508del homozygotes;P= 0.001). The average maximum sweat chloride value was 99.26 14.8 mmol/L for subjects between 0 and 1 year of age at the time of testing (n = 549), 102.5612.6 mmol/L between 1 and 2 years of age (n = 76), 105.7615.4 mmol/L between 2 and 3 years of age (n = 49), and 106.9614.9 mmol/L for subjects 3 or more years of age (n = 143) (Figure 3;seeFigure E1 in the online supplement). However, because 90% of these subjects are less than 5 years of age, the relationship between sweat chloride values and age may not be linear at older ages. We also evaluated effects of age on sweat chloride on an independent population of subjects from the Gene Modifier Study who were Phe508delhomozygotes. The mean sweat chloride value was 102.1615.0 mmol/L for subjects between 0 and 1 year of age at the time of testing (n = 392), 100.7614.6 mmol/L between 1 and 2 years of age (n = 275), 105.3615.5 mmol/L between 2 and 3 years of age (n = 107), and 106.4614.8 mmol/L for subjects 3 or more
years of age (n = 417), which were comparable with data from the primary population. To address age-related changes for heritability estimates in comparing twins or siblings who may have been different ages at the time of testing, all sweat chloride results obtained between 0 and 1 years of age were adjusted upward by 7.7 mmol/L, those between 1 and 2 years of age were adjusted by 4.4 mmol/L, and those obtained between 2 and 3 years of age were adjusted by 1.2 mmol/L (33).
There were no differences in maximum sweat chloride values by sex (n = 785; P= 0.72) or by race/ethnicity (n = 783; P= 0.97). However, some evidence of differences between males and females in older children and adults homozygous for thePhe508delmutation was noted. In a subpopulation ofPhe508delhomozygotes over 2 years of age, males tended to have a higher sweat chloride measurement (108.4616.2 mmol/L; n = 113) than females (105.1612.8 mmol/L; n = 83; P= 0.12). We saw a similar trend in the Gene Modifier Study (Phe508del homozygotes aged 2 yr or older at the time of testing) toward higher sweat chlorides in males (107.1615.0 mmol/L; n = 277) compared with females (105.2614.8 mmol/L; n = 247) (Student’sttest,P= 0.15). Although a meta-analysis incorporating both datasets indicates that males older than 2 years of
age have a higher mean sweat chloride than females (P= 0.042), we did not adjust our data for sex because there was no significant difference in the primary population.
CFTRGenotype Is the Predominant Determinant of Sweat Chloride Concentration in the CF Population To quantify the relative contribution of CFTRmutations, and other genetic and environmental factors to sweat chloride variation, we performed variance components estimation using a nested mixed model. A total of 2,160 age-adjusted sweat chloride measurements from 1,489 subjects were nested into 832 families, which were nested into 111 CFTRgenotype groups. Based on the variance of sweat chloride at each nested level, we estimated that over half of the variation (56.1%) in sweat chloride measurements was attributable to variation inCFTR genotype (likelihood ratio test,P,0.001) (Table 2). A further 13.5% and 6.8% were attributable to common or shared genetic/ environmental factors within a family (e.g., climate, familial diet, intragenicCFTR modifiers) and factors unique to an individual (e.g., modifier genes, unique exposures), respectively. The remaining contributions to sweat chloride variation were accounted for by variability within an individual over time because of testing on different days (but not age, which was adjusted for; 13.8%) and mixed model residual variation caused by differences in testing performed on the same day (9.9%). Finally, repeating the model with only a single sweat chloride measurement per subject (maximum) yielded a similar estimate of the variation caused byCFTR (59.0%).
Biologic Variability, Testing Variability, and Other Residual/Random Factors in Individuals with CF
The use of sweat chloride as a biomarker for response to pharmaceutical agents is enhanced with the knowledge of the factors that influence measurements in an individual between time intervals. From our mixed model, we estimated that 58.1% of variance in sweat chloride measurements in an individual (proportion of variance from Table 2 = 80.5/[80.5158.1]) would be secondary to variation over time (e.g., dietary changes or testing variability over time), and 41.9% of variance (proportion of variance from Table 2 = 58.1/[80.5158.1])
N = 822; Mean = 101.3; S.D.= 14.9
0 50 100 150
N
u
m
b
er
of
S
u
bj
ec
ts
50 75 100 125 150 Sweat Chloride Concentration (mmol/L)
would be secondary to testing variability and/or other residual/random factors.
To confirm our estimates of testing variability obtained from the mixed model, we examined variability in subjects who had two or more sweat chloride measurements recorded on the same calendar day. Presumably these measurements were obtained at the same CF center by the same tester, thereby controlling for differences in operator and equipment. In our population, 393 subjects had more than one value recorded on the same day on a total of 405 separate days. The mean difference between the maximum and minimum recorded values for a subject for testing performed on the same day was 7.169.6 mmol/L, which is similar to the SD estimate obtained from the mixed model (7.6 mmol/L). Interestingly, we found testing variability to have decreased with time, which may be caused by guidelines promoting uniform procedures and interpretation (27, 34, 35), but it is less clear whether changes in testing techniques have contributed to this (36, 37). The mean difference was
11.5 mmol/L in the period 1968–1979 (n = 28), 7.6 between 1980 and 1989 (n = 81), 7.2 between 1990 and 1999 (n = 184), and 5.7 between 2000 and 2009 (n = 112). Also, we found no difference in sweat chloride measurements by season when comparing those obtained in winter months with those obtained during summer months (P= 0.48; n = 1,284 measurements).
Non-CFTRModifier Genes Contribute Minimally to Variation in Sweat Chloride Concentration
To estimate the contribution of modifier genes versus unique environmental factors to variation in sweat chloride values, we performed heritability analyses. Within the 1,761 individuals with sweat chloride measurements, there were 730 family-based pairs after exclusions (Figure 4). In families with more than two members with sweat chloride tests, we only included one pair of subjects for each family to avoid overrepresentation of these families; the chosen pairs were the two siblings closest in age to minimize cohort effects. MZ twins
who share 100% of their DNA variants demonstrated a high degree of correlation (r= 0.83; n = 96 pairs). Sweat chloride correlation was also very similar in DZ twins who share only 50% of their genetic variation on average (r= 0.87; n = 30 pairs). The similar degree of correlation in MZ and DZ twin pairs indicated that modifier genes did not contribute substantially to variation in sweat chloride concentration (estimated heritability or H2= 0; 95% confidence interval, 0.0–0.35) (Table 3).
Because the degree of correlation among DZ twins exceeded that which could be attributed to sharing of genetic factors (e.g.,r.0.50 [50%]), we predicted that environmental factors common to twin pairs (e.g., testing center, diet) play an important role. To test this possibility, intrapair correlations of siblings and DZ twins were used to estimate effect of environment because both classes share 50% of their genetic variation, but siblings born at different times have greater differences in environmental exposures. Indeed, correlation among 604 sibling pairs (r= 0.52) was lower than observed in 30 DZ pairs (r= 0.87;P, 0.001) reflecting greater differences in environment between siblings than between DZ siblings. One key difference is that siblings are more likely to be tested under different circumstances (i.e., test facility, date) than DZ twins. In support of this supposition, when analysis was restricted to eight sibling pairs whose tests were conducted on the same day (which eliminates testing variability over different dates), the intrapair correlation increased (r= 0.79) and was not different than 16 pairs of DZ twins with tests conducted on the same day (r= 0.90; P= 0.67). Finally, to assess whether heritability estimation was confounded by
N = 736 50
70 90 110 130 150
A
Sw
e
a
t C
h
lo
ri
d
e
(mmo
l/
L
)
0 1 2 3 4 5 Age at Time of Testing (Years)
B
N = 817 50
70 90 110 130 150
Sw
e
a
t C
h
lo
ri
d
e
(mmo
l/
L
)
0 5 10 15 20 25 30 35 40 Age at Time of Testing (Years)
Figure 3.Maximum sweat chloride values by age with Lowess-smoothed line illustrating an increase in sweat chloride measurements with age. (A) Data forPhe508delhomozygotes only who were ,5 years old at the testing. (B) Data forPhe508delhomozygotes only regardless of age.
Table 2. Sources of Variance in Sweat Chloride Measurements in a Mixed Model*
Nested Level Potential Sources of Variation
Sweat Chloride SD Estimate (95% CI)†
Sweat Chloride Variance Estimate
(95% CI)
Percentage of Variance
CFTRgenotype CFTRgenotype 18.1 (15.1–21.7) 328.2 (229.1–470.3) 56.1 Family Common environment and intragenic
CFTRmodifiers
8.9 (7.8–10.0) 78.7 (61.3–101.0) 13.5
Individual Genetic modifiers and unique environment 6.3 (4.7–8.3) 39.5 (22.5–69.3) 6.8 Date of testing Biological variability over time 9.0 (7.9–10.2) 80.5 (62.5–103.6) 13.8 Mixed model residual Testing variability and residual/random factors 7.6 (7.1–8.2) 58.0 (50.6–66.6) 9.9
Definition of abbreviations: CFTR = cystic fibrosis transmembrane conductance regulator; CI = confidence interval.
*For this mixed model a total of 2,160 age-adjusted sweat chloride measurements obtained from 1,489 subjects were nested into 832 families, which were nested into 111CFTRgenotype groups.
interaction withCFTR, we conducted a subanalysis on subjects with the sameCFTR genotype (Phe508delhomozygotes). In this subpopulation the correlation was almost identical between MZ (r= 0.65; n = 58 pairs) and DZ twins (r= 0.64; n = 16 pairs), also yielding a low estimate of heritability.
Discussion
The Role of CFTR
Identifying sources of variation in traits, such as sweat chloride, which may be used to
determine the efficacy of CFTR-targeted therapies, is critically important to deliver the right care to the right patient and to assess its effects accurately. Our study results indicate that most variation in sweat chloride measurements relates toCFTR genotype (56.1%). This confirms previous work demonstrating significant variation in sweat chloride measurements between different classes ofCFTRmutations (19, 20). However, subjects with the same CFTRgenotype (Phe508delhomozygotes) still exhibit considerable variation in sweat chloride measurements. We did notfind evidence of substantial contribution of non-CFTRmodifier genes. The remaining variability in sweat chloride is attributed to environmental and residual/random factors, including testing variability. Identifying and controlling any contributory environmental factors could improve the precision and accuracy of the sweat chloride test, thus improving the utility of this measure as an assessment of the efficacy of CFTR-targeted molecular therapies. However, even if this is done, the correlation between changes in sweat chloride and lung function in individuals with CF still may not be apparent because of other variable factors that affect lung function.
The Role of Testing Variability Our results implicate the sweat test procedure as an important source of variability within a single clinical site. We found that sweat chloride measurements taken the same day on the same individual varied by an average of 7.1 mmol/L. This figure is similar to other reported estimates (8.5 mmol/L in subjects with CF who had at least oneG551Dmutation inCFTR) (38). This variation is likely not unique to individuals with CF, because studies of all patients presenting for sweat chloride
testing found within-subject variability ranging between 8.3 and 20.2% (median coefficient of variation) (22, 39). Site-to-site differences in measurement cause further variation among individuals with identical CFTRgenotypes, particularly if different techniques are used for measurement (40, 41). Although testing variability seems to be decreasing with time, revisiting methods to standardize sweat testing among centers could address this tractable source of variation. Clinical studies may need to consider adjusting for test center in analyses to minimize this source of variation.
Other Environmental Factors Biologic factors that differ among individuals, such as age or environmental exposures, also contribute to variation. In this study, age was associated with lower sweat chloride values at younger ages, suggesting that studies of molecular therapies in young children could underestimate treatment effect if sweat chloride naturally increases with age (42). Biologic variation in sweat chloride over time has been observed in healthy volunteers (n = 4), ranging from 14.2 to 32.8% over a 2-year period (43). Precision and accuracy may be improved by tackling these sources of variation by reducing within-test-center variability (as seems to be occurring over time) and adjusting for biologic factors affecting sweat chloride concentration, such as age, and possibly, sex. Additionally, future studies of potential sources of variation, such as temperature and humidity, may be helpful.
Study Population Influences
Although the patients enrolled in this study are representative of the spectrum of CFTR
CF Twin-Sibling Study (n=1697) Canadian Consortium (n=26)
French CF Study (n=44)
Dropped for: Age at Sweat Unknown (n=14) Discordant CFTR Genotypes (n=17)
Singletons (n=226)
Siblings dropped to yield "2 person families" (n=44)
Population for Heritability Analyses 604 families with 2 siblings (n=1208)
96 families with MZ twins (n=192) 30 families with DZ twins (n=60) 573 families with 2 siblings (n=1146)
90 families with MZ twins (n=180) 28 families with DZ twins (n=56) 29 families with 3 siblings (n=87) 6 families with MZ twins + Sib (n=18)
2 families with DZ twins + Sib (n=6) 1 family with 4 siblings (n=4) 1 family with 7 siblings (n=7)
Figure 4.Flow diagram for heritability analysis. CF = cystic fibrosis; CFTR = cystic fibrosis transmembrane conductance regulator; DZ = dizygous; MZ = monozygous; Sib = sibling.
Table 3. Heritability Estimates Using Age-adjusted Sweat Chloride Measurements
Group n (Pairs)
Mean6SD Sweat Chloride
Difference between Family Members Correlation (r)
Mean Heritability Estimate (95% CI)*
All tests MZ twins 96 8.668.0 0.83 —
DZ twins 30 8.166.4 0.87 0 (0–0.35)
Siblings 604 13.9612.2 0.52 0.60 (0.32–0.85) Tests done on
the same day
MZ twins 56 8.468.3 0.86 —
DZ twins 16 7.165.5 0.90 0 (0–0.37)
Siblings 8 11.168.1 0.79 0.16 (0–0.91)
Definition of abbreviations: CI = confidence interval; DZ = dizygous; MZ = monozygous.
dysfunction observed in CF, it should be acknowledged that the subjects within the CF Twin-Sibling Study, who comprised most patients within this study, have better lung function than individuals with CF in the United States as reported to the CF Foundation Patient Registry (13). Underrepresentation of more severe disease may underestimate the contribution of CFTRif more severe disease is secondary to underrepresented mutations within the study population or overestimate the contribution ofCFTRif more severe disease is a function of specific environmental factors. It is also possible that common environmental effects may mask modest effects of modifier genes (44). Furthermore, the current methods do not allow us to detect potential effects of modifier gene– CFTRinteractions, gene–environment interactions, or intragenicCFTRmodifiers. We were unable to fully assess the contribution of the shared (common) environment because most subjects (95.9%) were less than 18 years of age when tested and thus presumably living in a shared family environment. Given that our sweat chloride data were measured in more than 100 CF centers in several countries over several decades, it is not possible to correct for testing variability by location or time. Use of these clinically obtained sweat test results to identify a correlation with age could be biased if patients being tested at older ages have different disease
characteristics than those being tested as infants. Additionally, our adjustment for sweat chloride measurements using the age at the time of testing in aPhe508del homozygous population may not be appropriate for allCFTR genotypes; previous work by Kirk and coworkers (45) demonstrated no change in sweat chloride values at different ages in children less than 12 years old with CF and a linear decline in children greater than or equal to 12 years of age and adults.
Consequences for Sweat Chloride as Biomarker
Our study suggests that most variation (56.1%) in sweat chloride measurements within the population of patients with CF is a function ofCFTRgenotype. Thus, sweat chloride may be better in terms of following an individual subject’s response to CFTR correctors and potentiators than lung function or nutritional outcomes because sweat chloride is not subject to progressive decline and perhaps less subject to other external factors (13–15, 46, 47). Individual variation seems to be caused by
residual/random factors (41.9%), of which we would speculate is largely caused by testing variability on the same day, and variability over time (58.1%), such as different methods of measurement or testing operators. To maximize the use of sweat chloride as an outcome
measurement, testing variability should be minimized with close attention to standardization, and averaging multiple independent sweat chloride measurements preintervention and postintervention could be considered. Studies should be appropriately powered with the knowledge that sweat chloride measurements vary on average 7.6 mmol/L for measurements obtained in the same person on the same day and an additional 9.0 mmol/L in a given individual over time based on our mixed model. Alternatively, newer methods of sweat testing could be considered (40). Ultimately, if testing precision and accuracy can be improved, perhapsfirst in a research setting, sweat chloride could be a key biomarker for individualized CF medicine, where large randomized controlled trials may not be possible to assess the effect of therapies for less common CFTR mutations. n
Author disclosuresare available with the text of this article at www.atsjournals.org.
Acknowledgment:The authors thank the Cystic Fibrosis Foundation Patient Registry, especially Bruce Marshall and Emily Knapp, and most importantly the patients with cystic fibrosis and their families, research coordinators, nurses, and physicians who are participating in the U.S. Cystic Fibrosis Twin and Sibling Study, the French and Canadian Gene Modifiers studies, and the Genetic Modifier Study at University of North Carolina/Case Western Reserve University.
References
1. Quinton PM. Cysticfibrosis: impaired bicarbonate secretion and mucoviscidosis.Lancet2008;372:415–417.
2. Anderson MP, Gregory RJ, Thompson S, Souza DW, Paul S, Mulligan RC, Smith AE, Welsh MJ. Demonstration that CFTR is a chloride channel by alteration of its anion selectivity.Science1991;253: 202–205.
3. Rowe SM, Miller S, Sorscher EJ. Cysticfibrosis.N Engl J Med2005;352: 1992–2001.
4. Accurso FJ, Rowe SM, Clancy JP, Boyle MP, Dunitz JM, Durie PR, Sagel SD, Hornick DB, Konstan MW, Donaldson SH,et al. Effect of VX-770 in persons with cysticfibrosis and the G551D-CFTRmutation.N Engl J Med2010;363:1991–2003.
5. Davies JC, Wainwright CE, Canny GJ, Chilvers MA, Howenstine MS, Munck A, Mainz JG, Rodriguez S, Li H, Yen K,et al.; VX08-770-103 (ENVISION) Study Group. Efficacy and safety of ivacaftor in patients aged 6 to 11 years with cysticfibrosis with aG551Dmutation.Am J Respir Crit Care Med2013;187:1219–1225.
6. Wainwright CE, Elborn JS, Ramsey BW, Marigowda G, Huang X, Cipolli M, Colombo C, Davies JC, De Boeck K, Flume PA,et al. Lumacaftor-ivacaftor in patients with cysticfibrosis homozygous for phe508del CFTR.N Engl J Med2015;373:220–231.
7. De Boeck K, Munck A, Walker S, Faro A, Hiatt P, Gilmartin G, Higgins M. Efficacy and safety of ivacaftor in patients with cysticfibrosis and a non-G551Dgating mutation.J Cyst Fibros2014;13:674–680.
8. Flume PA, Liou TG, Borowitz DS, Li H, Yen K, Ordoñez CL, Geller DE; VX 08-770-104 Study Group. Ivacaftor in subjects with cysticfibrosis who are homozygous for theF508del-CFTRmutation.Chest2012;142:718–724. 9. Schluchter MD, Konstan MW, Davis PB. Jointly modelling the
relationship between survival and pulmonary function in cysticfibrosis patients.Stat Med2002;21:1271–1287.
10. Kerem E, Corey M, Kerem B-S, Rommens J, Markiewicz D, Levison H, Tsui LC, Durie P. The relation between genotype and phenotype in cysticfibrosis: analysis of the most common mutation (DF508).N Engl J Med1990;323:1517–1522.
11. The Cystic Fibrosis Genotype-Phenotype Consortium. Correlation between genotype and phenotype in patients with cysticfibrosis.N Engl J Med1993;329:1308–1313.
12. Koch C, Cuppens H, Rainisio M, Madessani U, Harms H, Hodson M, Mastella G, Navarro J, Strandvik B, McKenzie S; Investigators of the ERCF. European Epidemiologic Registry of Cystic Fibrosis (ERCF): comparison of major disease manifestations between patients with different classes of mutations.Pediatr Pulmonol2001;31:1–12. 13. Vanscoy LL, Blackman SM, Collaco JM, Bowers A, Lai T, Naughton K,
Algire M, McWilliams R, Beck S, Hoover-Fong J,et al. Heritability of lung disease severity in cysticfibrosis.Am J Respir Crit Care Med 2007;175:1036–1043.
15. Durmowicz AG, Witzmann KA, Rosebraugh CJ, Chowdhury BA. Change in sweat chloride as a clinical end point in cysticfibrosis clinical trials: the ivacaftor experience.Chest2013;143:14–18. 16. Clancy JP, Rowe SM, Accurso FJ, Aitken ML, Amin RS, Ashlock MA,
Ballmann M, Boyle MP, Bronsveld I, Campbell PW,et al. Results of a phase IIa study of VX-809, an investigational CFTR corrector compound, in subjects with cysticfibrosis homozygous for the F508del-CFTRmutation.Thorax2012;67:12–18.
17. Boyle MP, Bell SC, Konstan MW, McColley SA, Rowe SM, Rietschel E, Huang X, Waltz D, Patel NR, Rodman D; VX09-809-102 study group. A CFTR corrector (lumacaftor) and a CFTR potentiator (ivacaftor) for treatment of patients with cysticfibrosis who have a phe508del CFTRmutation: a phase 2 randomised controlled trial.Lancet Respir Med2014;2:527–538.
18. Gibson LE, Cooke RE. A test for concentration of electrolytes in sweat in cysticfibrosis of the pancreas utilizing pilocarpine by iontophoresis.Pediatrics1959;23:545–549.
19. McKone EF, Emerson SS, Edwards KL, Aitken ML. Effect of genotype on phenotype and mortality in cysticfibrosis: a retrospective cohort study.Lancet2003;361:1671–1676.
20. Wilschanski M, Zielenski J, Markiewicz D, Tsui LC, Corey M, Levison H, Durie PR. Correlation of sweat chloride concentration with classes of the cysticfibrosis transmembrane conductance regulator gene mutations.J Pediatr1995;127:705–710.
21. Accurso FJ, Van Goor F, Zha J, Stone AJ, Dong Q, Ordonez CL, Rowe SM, Clancy JP, Konstan MW, Hoch HE,et al. Sweat chloride as a biomarker of CFTR activity: proof of concept and ivacaftor clinical trial data.J Cyst Fibros2014;13:139–147.
22. DeMarco ML, Dietzen DJ, Brown SM. Sweating the small stuff: adequacy and accuracy in sweat chloride determination.Clin Biochem2015;48:443–447.
23. Collaco JM, Blackman SM, Raraigh K, Corvol H, Rommens JM, Sosnay P, Cutting GR. Sources of sweat chloride variation in CF.Pediatr Pulmonol2015;50:253–254.
24. Wright FA, Strug LJ, Doshi VK, Commander CW, Blackman SM, Sun L, Berthiaume Y, Cutler D, Cojocaru A, Collaco JM,et al. Genome-wide association and linkage identify modifier loci of lung disease severity in cysticfibrosis at 11p13 and 20q13.2.Nat Genet2011;43:539–546. 25. Castellani C; CFTR2 team. CFTR2: how will it help care?Paediatr
Respir Rev2013;14:2–5.
26. Lewis C, Blackman SM, Nelson A, Oberdorfer E, Wells D, Dunitz J, Thomas W, Moran A. Diabetes-related mortality in adults with cystic
fibrosis. Role of genotype and sex.Am J Respir Crit Care Med2015; 191:194–200.
27. LeGrys VA, Yankaskas JR, Quittell LM, Marshall BC, Mogayzel PJ Jr; Cystic Fibrosis Foundation. Diagnostic sweat testing: the Cystic Fibrosis Foundation guidelines.J Pediatr2007;151:85–89. 28. Castellani C, Southern KW, Brownlee K, Dankert Roelse J, Duff A,
Farrell M, Mehta A, Munck A, Pollitt R, Sermet-Gaudelus I,et al. European best practice guidelines for cysticfibrosis neonatal screening.J Cyst Fibros2009;8:153–173.
29. Green A, Kirk J; Guidelines Development Group. Guidelines for the performance of the sweat test for the diagnosis of cysticfibrosis. Ann Clin Biochem2007;44:25–34.
30. Marchenko Y. Estimating variance components in Stata.Stata J2006; 6:1–21.
31. Introduction to quantitative genetics. Essex, UK: Longman; 1996. 32. Efron B. Better bootstrap confidence-intervals.J Am Stat Assoc1987;
82:171–185.
33. Tobin MD, Sheehan NA, Scurrah KJ, Burton PR. Adjusting for treatment effects in studies of quantitative traits: antihypertensive therapy and systolic blood pressure.Stat Med2005;24:2911–2935.
34. Report of the committee for a study for evaluation of testing for cystic
fibrosis.J Pediatr1976;88:711–750.
35. Farrell PM, Rosenstein BJ, White TB, Accurso FJ, Castellani C, Cutting GR, Durie PR, Legrys VA, Massie J, Parad RB,et al.; Cystic Fibrosis Foundation. Guidelines for diagnosis of cysticfibrosis in newborns through older adults: Cystic Fibrosis Foundation consensus report. J Pediatr2008;153:S4–S14.
36. Mastella G, Di Cesare G, Borruso A, Menin L, Zanolla L. Reliability of sweat-testing by the Macroduct collection method combined with conductivity analysis in comparison with the classic Gibson and Cooke technique.Acta Paediatr2000;89:933–937.
37. Rose JB, Ellis L, John B, Martin S, Gonska T, Solomon M, Tullis E, Corey M, Adeli K, Durie PR. Does the Macroduct collection system reliably define sweat chloride concentration in subjects with intermediate results?Clin Biochem2009;42:1260–1264. 38. Vermeulen F, Milenkovic D, Davies J, Bilton D, Le Camus C.
Intra-patient variability of sweat chloride concentrations in patients with cysticfibrosis.J Cyst Fibros2015;14:S37.
39. Mackay RJ, Florkowski CM, George PM, Sies CW, Woods S. Uncertainty of sweat chloride testing: does the right hand know what the left hand is doing?Ann Clin Biochem2008; 45:535–538.
40. Rock MJ, Makholm L, Eickhoff J. A new method of sweat testing: the CF Quantum sweat test.J Cyst Fibros2014;13:520–527.
41. Collie JT, Massie RJ, Jones OA, LeGrys VA, Greaves RF. Sixty-five years since the New York heat wave: advances in sweat testing for cysticfibrosis.Pediatr Pulmonol2014;49:106–117.
42. Traeger N, Shi Q, Dozor AJ. Relationship between sweat chloride, sodium, and age in clinically obtained samples.J Cyst Fibros2014; 13:10–14.
43. Koerbin G, Greaves RF, Robins H, Farquhar J, Hickman PE. Total intra-individual variation in sweat sodium and chloride
concentrations for the diagnosis of cysticfibrosis.Clin Chim Acta 2008;393:128–129.
44. Chen X, Kuja-Halkola R, Rahman I, Arpegard J, Viktorin A, Karlsson R,˚ H ¨agg S, Svensson P, Pedersen NL, Magnusson PK. Dominant genetic variation and missing heritability for human complex traits: insights from twin versus genome-wide common snp models.Am J Hum Genet2015;97:708–714.
45. Kirk JM, Keston M, McIntosh I, al Essa S. Variation of sweat sodium and chloride with age in cysticfibrosis and normal populations: further investigations in equivocal cases.Ann Clin Biochem1992; 29:145–152.
46. Bradley GM, Blackman SM, Watson CP, Doshi VK, Cutting GR. Genetic modifiers of nutritional status in cysticfibrosis.Am J Clin Nutr2012; 96:1299–1308.