Utilizing Ultrafast Spectroscopy to Characterize Energy and Electron Transfer in RuII Based Molecular Assemblies Designed for Solar Fuel Devices
Stephanie Elaine Bettis
A dissertation submitted to the faculty of the University of North Carolina at Chapel Hill in partial fulfillment of the requirements for the degree of Doctor of Philosophy in the
Department of Chemistry
Chapel Hill 2013
©2013
ABSTRACT
Stephanie Elaine Bettis: Utilizing Ultrafast Spectroscopy to Characterize Energy and Electron Transfer in RuII Based Molecular Assemblies Designed for Solar Fuel Devices
(Under the direction of John M. Papanikolas)
This dissertation investigates the ultrafast dynamics in molecular assemblies for use in both dye-sensitized solar cells (DSSCs) and dye-sensitized photo electrosynthesis cells (DSPECs). A detailed kinetic analysis of the dynamics for the peptide and layered molecular assemblies provide insight into the orientation of the chromophores and catalysts substituents. The work was made possible from collaborations with both Dr. Marcey Waters’ and Dr. Thomas Meyer’s research groups, who provided the molecular assemblies for this study. Ultrafast spectroscopy techniques, such as transient absorption and time-resolved emission, were utilized for the kinetic study.
water oxidation catalyst on a nanocrystalline TiO2 film is investigated in Chapter 5. Overall
ACKNOWLEDGEMENTS
First, I wish to express my appreciation and gratitude to Dr. John Papanikolas for his infinite patience, advice, and wisdom. I cannot express how fortunate it has been to have an advisor who you respect not only as a scientist, but also as a person. Additional recognition and thanks is due to Dr. Kyle Brennaman for always having an open door and the willingness to discuss Ru(II) chemistry.
I’d also like to thank Papanikolas group members both past and present. In our group team work is critical and it has been great to work with all of you. Specifically I’d like to thank Dr. Brittany Westlake for teaching me the ropes of the laser and reminding me that most days it’s not out get me. Dr. Ralph House also deserves many thanks for his positive outlook even on the gloomiest of days. I want to thank Dr. Brian Mehl who took the time to teach me not only how to code in MATLAB, but also to love and appreciate all it can do. I also appreciate Dr. Li Wang who shared in many conversations about chemistry from a synthetic perspective and life in general. I am also grateful for Dr. Erik Grumstrup who has been a huge resource for any optical problem that arises, especially when it means cracking open the laser. I’d also like to thank Melissa Gish who has fearlessly jumped in to continue the peptide projects and lead the “north” laser table.
their insight into peptide kinetic dynamics. I also would like to thank Dr. Kenneth Hanson and Dr. Thomas Meyer who provided the layered samples along with many conversations about Ru(II) chemistry.
Finally, I’d like to thank my family and friends. I really appreciate the love and support they have all given me over the years. I am thankful for my parents, MaryJane and Sonny, and my siblings Emily, Kristina, Christopher, and Jonathan for their constant love and support all the way from Georgia. And last but not least I would like to thank my wonderful husband Philip Homan who has never stopped supporting me both as a scientist and a friend.
TABLE OF CONTENTS
LIST OF TABLES ... xii
LIST OF SCHEMES... xiv
LIST OF FIGURES ... xv
LIST OF ABBREVIATIONS ... xxiii
LIST OF SYMBOLS ... xxvi
CHAPTER 1. Introduction... 1
1.1. OVERVIEW ... 2
1.2. REFERENCES ... 6
CHAPTER 2. Tunable Energy Transfer Rates via Control of Primary, Secondary, and Tertiary Structure of a Coiled Coil Peptide Scaffold1 ... 9
2.1. INTRODUCTION ... 10
2.2. EXPERIMENTAL ... 13
2.2.1. Steady-state Techniques ... 13
2.2.2. Time-Correlated Single Photon Counting ... 13
2.3. RESULTS AND DISCUSSION ... 14
2.3.1. Peptide Design and Structural Characterization ... 14
2.3.2. Stead-state Spectroscopy... 16
2.3.3. Time-resolved Spectroscopy ... 18
2.3.4. Influence of Folding on Energy Transfer ... 21
2.3.6. Data Analysis ... 24
2.3.7. Molecular Modeling ... 30
2.4. CONCLUSIONS ... 32
2.5. REFERENCES ... 34
CHAPTER 3. Interfacial Energy Conversion in Ru(II) Polypyridyl-Derivatized Oligoproline Assemblies on TiO22 ... 39
3.1. INTRODUCTION ... 40
3.2. EXPERIMENTAL METHODS ... 46
3.2.1. Sample Preparation ... 46
3.2.2. Steady-state Techniques ... 46
3.2.3. Time-Correlated Single Photon Counting ... 48
3.2.4. Ultrafast Transient Absorption ... 48
3.2.5. Picosecond Transient Absorption ... 49
3.3. RESULTS AND DISCUSSION ... 49
3.3.1. Steady-state Spectroscopy... 49
3.3.2. Energy Transfer Characterized by Time-resolved Emission Mapping ... 52
3.3.3. Ultrafast Electron Injection into TiO2 ... 55
3.3.4. Back Electron Transfer ... 60
3.4. CONCLUSIONS ... 62
3.5. REFERENCES ... 64
CHAPTER 4. Photophysical characterization of a helical peptide chromophore-water oxidation catalyst assembly on a semiconductor surface using ultrafast spectroscopy3 ... 68
4.1. INTRODUCTION ... 69
4.2. EXPERIMENTAL SECTION ... 74
4.2.1. Sample Preparation ... 74
4.2.3. Time-resolved Emission ... 75
4.2.4. Ultrafast Transient Absorption ... 75
4.2.5. Picosecond Transient Absorption ... 76
4.3. RESULTS AND DISCUSSION ... 76
4.3.1. Photoexcitation ... 76
4.3.2. Electron Injection ... 79
4.3.3. Energy Transfer ... 84
4.3.4. Transfer of the Oxidative Equivalent to the Catalyst ... 86
4.3.5. Charge Recombination ... 96
4.4. CONCLUSIONS ... 98
4.5. REFERENCES ... 100
CHAPTER 5. Photophysical characterization of chromophore-water oxidationcatalyst containing layer-by-layer assembly on nanocrystalline TiO2 using ultrafast spectroscopy4 103 5.1. INTRODUCTION ... 104
5.2. EXPERIMENTAL ... 108
5.2.1. Sample Preparation ... 108
5.2.2. Steady-state Techniques ... 109
5.2.3. Time-resolved Emission ... 109
5.2.4. Ultrafast Transient Absorption ... 110
5.2.5. Picosecond Transient Absorption ... 110
5.3. RESULTS AND DISCUSSION ... 110
5.3.1. Photoexcitation ... 111
5.3.2. Electron Injection ... 113
5.3.2.1. Chromophore Excited-State Injection, TiO2-[RuaII-Zr]2+ ... 113
5.3.3. Catalyst Excited-State Decay ... 121
5.3.4. Energy Transfer ... 123
5.3.5. Transfer of the Oxidative Equivalent to the Catalyst ... 125
5.4. CONCLUSIONS ... 133
LIST OF TABLES
Table 2.1. Results of the global analysis showing the dependence of the
energy transfer rate on the position.a ... 29 Table 3.1. Fit results for the global analysis of [RuaII-RubII]4+ in aqueous
0.1 M HClO4. ... 54
Table 3.2. Fit results for the global analysis of ZrO2-[RuaII-RubII]4+ . ... 54
Table 3.3. Fit results for TiO2-[RuaII]2+ and TiO2-[RuaII-RubII]4+ for the
electron injection (375 nm) for the first 1 ns. ... 59 Table 3.4. Fit results for TiO2-[RuaII]2+ and TiO2-[RuaII-RubII]4+ for the
electron injection (375 nm) for 1 ns to 10 μs. ... 59 Table 3.5. Fit results TiO2-[RuaII]2+ and TiO2-[RuaII-RubII]4+ for back electron
transfer (450 nm) from 1 ns to 10 μs. ... 62 Table 4.1. Summary of fit for electron injection kinetics at 380 nm of
[RuaII]2+, [RuaII-RubII-OH2]4+, and [RuII(pbpy)2(bpy)]2+ on TiO2 and ZrO2. ... 82
Table 4.2. Summary of the fits of time-resolved emission for ZrO2-[RuaII]2+
and ZrO2-[RuaII-RubII-OH2]4+. ... 85
Table 4.3. Summary of the multiexponential fit to the transient absorption
signal for ZrO2-[RubII-OH2]4+. ... 87
Table 4.4. Summary of the fit to the change in wavelength of the bleach (at
50% point) for TiO2-[RuaII]2+ and TiO2-[RuaII-RubII-OH2]4+. ... 89
Table 4.5. Summary of global analysis constraint and initial/final
concentrations. ... 94 Table 5.1. Summary of the multiexponential fits of TiO2-[RuaII]2+ and
TiO2-[RuaII-Zr]2+. ... 115
Table 5.2. Summary of the multiexponential fits of
TiO2-[RuaII-Zr-RubII-OH2]4+. ... 119
Table 5.3. Summary of the multiexponential fit to the transient absorption
signal for ZrO2-[RubII-OH2]4+. ... 122
Table 5.4. Summary of the multiexponential fits of time-resolved emission for
Table 5.5. Summary of the fit for the change in red wavelength of the ground-state bleach (at the 50% point) verses time to the function
( ) ( ). ... 127 Table 5.6. Summary of global analysis constraint and initial/final
LIST OF SCHEMES
Scheme 3.1. Schematic representation of photophysical events of
[RuaII-RubII]4+ on nanocrystalline TiO2. ... 44
Scheme 4.1. Illustration of the water oxidation catalytic cycle for single-site
RuII catalysts. ... 70 Scheme 4.2. Schematic representation of the events in
TiO2-[RuaII-RubII-OH2]4+ upon photoexcitation. ... 74
Scheme 5.1. Schematic diagram illustrating the kinetic processes for
LIST OF FIGURES
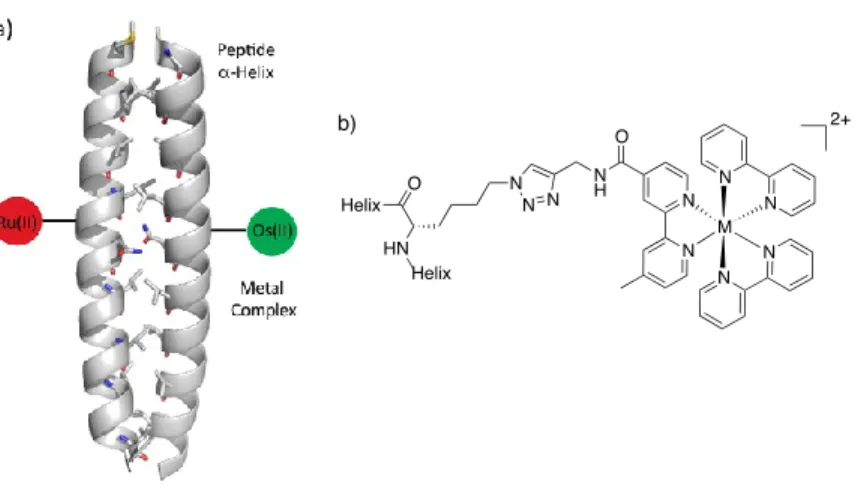
Figure 2.1. (A) Illustration of metallopeptide system containing the α-helical coiled-coil scaffold and metal complexes (coiled coil: pdb 2AHP). (B)
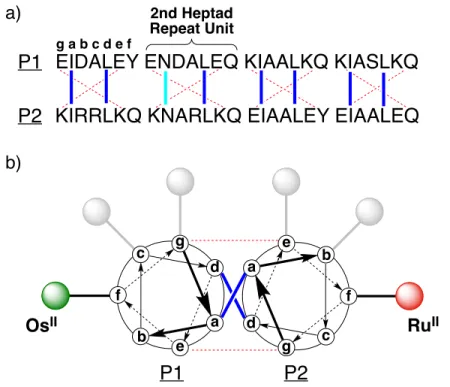
Structure of the metal complex and its attachment to the α-helix. ... 12 Figure 2.2. (A) Primary sequences of the P1 and P2 peptides using the single
letter amino acid code (in capitals). Each 28-residue peptide has four heptad repeat units. The common letter designations for the heptad positions (abcdefg) are shown above the first heptad repeat unit for P1. The hydrophobic interactions are shown as blue lines, the hydrogen bonding interaction between Asn sidechains is shown as a cyan line, and the complementary ionic interactions between the two peptides are shown as red dashed lines. (B) A helical-wheel diagram displaying the potential points for attachment when viewed down helix axis from the N-terminus. The P1 peptide is modified with Os(II) at the f, c, or g position within the second heptad. The P2 peptide is modified with Ru(II) at the f,
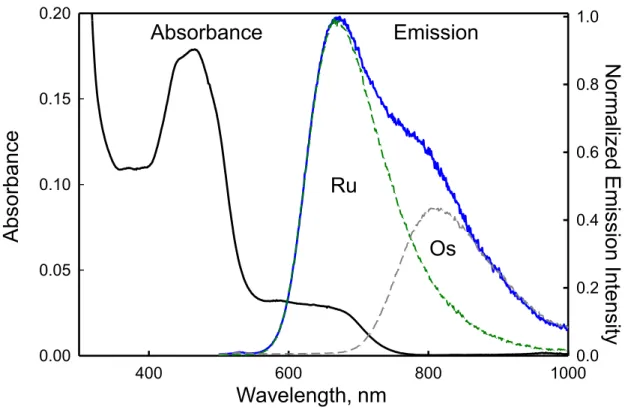
b, or c position within the second heptad. ... 15 Figure 2.3. The ground-state absorption (black:25 µM 2e-Ru and 50 µM
2g-Os) and steady state emission (blue: 25 µM 2e-Ru and 50 µM 2g-Os) spectra of the 2g-Os/2e-Ru peptide coiled-coil in a 10 mM sodium phosphate buffer solution, pH 7, 25°C. Also shown are the 2e-Ru(II) peptide (green dashed: 25 µM 2e-Ru) and 2g-Os(II) peptide emission spectra (grey dashed: 100 µM 2g-Os). The excitation wavelength was
450 nm. ... 17 Figure 2.4. Steady-state spectra of the three peptide coiled-coil systems (blue:
25 mM 2f-Ru and 50 mM 2f-Os, red: 25 mM 2b-Ru and 50 mM 2c-Os, and green: 25 mM 2e-Ru and 50 mM 2e-Os) in a 10 mM sodium phosphate buffer solution, pH 7, 25°C. The excitation wavelength was
450 nm. ... 18 Figure 2.5. (A) Time-resolved emission of 2e-Ru peptide in the presence of
time-resolved emission data were collected at 660 nm with an excitation
of 444 nm. ... 20 Figure 2.6. The Os(II) complex (1) was used as a diagnostic for
intermolecular energy transfer not mediated by the peptide scaffold. ... 22 Figure 2.7. Time-resolved emission transients showing the distance
dependence of the energy transfer rate for the 2f-Os/2f-Ru (blue: 25 µM 2f-Ru and 50 µM 2f-Os), 2c-Os/2b-Ru (red: 25 µM 2b-Ru and 50 µM 2c-Os), and 2g-Os/2e-Ru (green: 25 µM 2e-Ru and 50 µM 2g-Os) peptide pairs in 10 mM phosphate buffer solution at pH 7 and 25°C. The P1/2e-Ru peptide (grey: 25 µM 2e-Ru and 50 µM P1) is shown for comparison. From the transients it is clear that the energy transfer rate is faster the closer the metal complexes are placed to one another. The time-resolved emission data were collected at 660 nm with an excitation
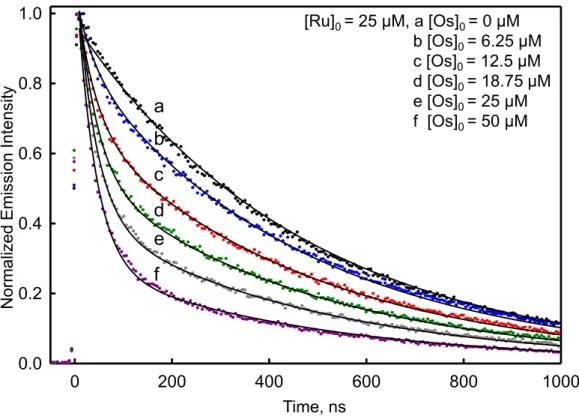
wavelength of 444 nm. ... 24 Figure 2.8. Time-resolved emission for P1/Ru peptide (black: 25 µM
2e-Ru and 50 µM P1) and 2g-Os/2e-2e-Ru peptide pair containing various amounts of the 2g-Os peptide (blue: 6.25 µM, red: 12.5 µM, green: 18.75 µM, grey: 25 µM, and purple: 50 µM with all containing 25 µM 2e-Ru) in a 10 mM phosphate buffer solution at pH 7 and 25°C. The increase in 2g-Os peptide concentration drives the equilibrium to heterodimer formation and thus greater Ru(II) emission quenching by energy transfer. The time-resolved emission data were collected at 660
nm with an excitation wavelength of 444 nm. ... 26 Figure 2.9. Time-resolved emission for P1/Ru peptide (black: 25 µM
2b-Ru and 50 µM P1) and 2c-Os/2b-2b-Ru peptide pair containing various amounts of the 2c-Os peptide (blue: 6.25 µM, red: 12.5 µM, green: 18.75 µM, grey: 25 µM, and purple: 50 µM with all containing 25 µM 2b-Ru) in a 10 mM phosphate buffer solution at pH 7 and collected at 25°C. From the data is you can see that the increase in 2c-Os peptide concentration drives the equilibrium to heterodimer formation and thus greater Ru(II) emission quenching by energy transfer. The time-resolved
emission data were collected at 660 nm with an excitation of 444 nm. ... 27 Figure 2.10. Time-resolved emission for P1/Ru peptide (black: 25 µM
2f-Ru and 50 µM P1) and 2f-Os/2f-2f-Ru peptide pair containing various amounts of the 2f-Os peptide (blue: 6.25 µM, red: 12.5 µM, green: 18.75 µM, grey: 25 µM, and purple: 50 µM with all containing 25 µM 2f-Ru) in a 10 mM phosphate buffer solution at pH 7 and collected at 25°C. From the data is you can see that the increase in 2f-Os peptide concentration drives the equilibrium to heterodimer formation and thus greater Ru(II) emission quenching by energy transfer. The time-resolved
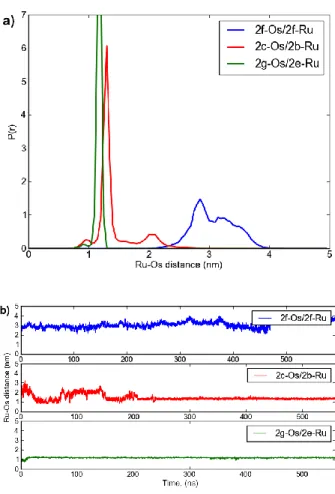
Figure 2.11. (A) Comparative plot of Ru-Os distance histograms (normalized) for different chromophore placements, including 2f-Os/2f-Ru, 2c-Os/2b-Ru, and 2g-Os/2e-Ru. (B) Ru-Os distance evolution in time for
the 2f-Os/2f-Ru, 2c-Os/2b-Ru, and 2g-Os/2e-Ru metallopeptide pairs. ... 31 Figure 2.12. (A) Bipyridyl ligands arranged in a “neck” conformation, facing
away from each other (1.2 nm feature). This conformation was only observed in the 2g-Os/2e-Ru system. (B) π-π stacking arrangement where bipyridyl rings of two complexes are in Van der Waals contact and parallel to each other (~1 nm feature). This tightly stacked conformation is observed consistently in 2c-Os/2b-Ru system and briefly in 2g-Os/2e-Ru system. (C) “Loose” packing arrangement of the bipyridyl complexes (~2 nm feature) is a stable basin of conformations with characteristic π-π stacking of one of bipyridine rings of one chromophore and the triazole ring on the linker of the other. This stacking is stable in 2c-Os/2b-Ru system and transitory to closer intercomplex packing conformations in
2g-Os/2e-Ru system. ... 32 Figure 3.1. Structure of [RuaII]2+ and [RuaII-RubII]4+ on nanocrystalline TiO2
films. ... 42 Figure 3.2. All atom molecular dynamics simulation of [RuaII-RubII]4+ in
solution showing the RuII chromophores in close contact. Green indicates oligoproline backbone, yellow indicates linkers, red indicated
chromophore [RuaII]2+, and blue indicates chromophore [RubII]2+. ... 43
Figure 3.3. (A) Normalized ground state ultraviolet-visible spectra of the inner chromophore [RuaII]2+ (green) and outer chromophore [RubII]2+
(blue) in 0.1 M HClO4 pH 1 solution, 25 °C. (B) Ground state absorption
spectra of TiO2-[RuaII]2+ (green), TiO2-[RuaII-RubII]4+ (black),
TiO2-[RuII(bpy)2(pbpy)]2+ (blue), and 3 μm thick TiO2 (red). (C)
Ground-state absorption of ZrO2-[RuaII]2+ (green), ZrO2-[RuaII-RubII]4+ (black),
and 3 μm thick ZrO2 (grey). Film samples were in quartz cuvette
containing aqueous 0.1 M HClO4 at 25 °C. ... 50
Figure 3.4. Steady-state emission spectra of the energy transfer donor or outer chromophore [RubII]2+ (blue: 25 M) and energy transfer acceptor or
inner chromophore [RuaII]2+ (green: 25 M) in 0.1 M HClO4, pH 1
solution, 25°C. The excitation wavelength was 450 nm. Emission
spectral fitting are shown black lines. ... 51 Figure 3.5. Time-resolved emission map of (A) [RuaII-RubII]4+ in aqueous
0.1 M HClO4 and (B) ZrO2-[RuaII-RubII]4+ on 3 μm thick ZrO2 in
aqueous 0.1 M HClO4. The insets are spectra taken at early (blue: 5 ns)
and late times (red: 1.7 μs). The red shift in the emission is evidence for
Figure 3.6. Global analysis results of [RuaII-RubII]4+ in aqueous 0.1 M HClO4.
(A) Plot of the evolution of the concentration of [RubII]2+ (blue) and
[RuaII]2+ (green). The biexponential fit to the curves is shown with black
line and is summarized in Table 3.1. (B) The spectra of the concentration
of the [RuaII-RubII]4+ (black), [RubII]2+ (blue), and [RuaII]2+ (green)... 53
Figure 3.7. Global analysis results of ZrO2-[RuaII-RubII]4+ in aqueous 0.1 M
HClO4. (A) Plot of the evolution of the concentration of [RubII]2+ (blue)
and [RuaII]2+ (green). The biexponential fit to the curves is shown with
black line and is summarized in Table 3.2. (B) The spectra of the concentration of [RuaII-RubII]4+ (black), [RubII]2+ (blue) and [RuaII]2+
(green). ... 54 Figure 3.8. Transient absorption spectra of (A) TiO2-[RuaII]2+ and (B)
TiO2-[RuaII-RubII]4+ at 0.6 ps (dark line), 900 ps (medium line), and
100 ns (light line) after laser excitation. Both samples were on 3 μm thick nanocrystalline TiO2 film in aqueous 0.1 M HClO4 at 25 °C. The
excitation wavelength was 475 nm. ... 56 Figure 3.9. Transient absorption kinetics and fits of the ππ* absorption
(375 nm ± 3 nm) for TiO2-[RuaII]2+ (green) and TiO2-[RuaII-RubII]4+
(blue) in (A) the first 1000 ps and (B) 1 to 10,000 ns after excitation at 475 nm. The fits are shown in black lines and summarized in Tables 3.3 and 3.4. All samples were on 3 μm thick nanocrystalline TiO2 film in
aqueous 0.1 M HClO4 solution at 25 °C. ... 58
Figure 3.10. Transient absorption kinetics and fits for the ground state bleach (collected at 450 nm ± 3 nm) of TiO2-[RuaII]2+ (green),
TiO2-[RuaII-RubII]4+ (blue), and TiO2-[RuII(bpy)2(pbpy)]2+ (orange) in
aqueous 0.1 M HClO4 at 25 °C. The fits are shown with solid black line
and summarized in Table 3.5. The excitation wavelength was 475 nm. ... 61 Figure 4.1. Illustration of the molecular structures of the assembly
[RuaII-RubII-OH2]4+, chromophore [RuaII]2+, catalyst [RubII-OH2]2+ and
control chromophore [RuII(pbpy)2(bpy)]2+on nanocrystalline TiO2. ... 72
Figure 4.2. (A) Ground-state absorption of 3 µm ZrO2 (grey), ZrO2-[RuaII]2+
(green), ZrO2-[RubII-OH2]2+ (red), ZrO2-[RuaII-RubII-OH2]4+ (blue), and
sum of ZrO2-[RuaII]2+ and ZrO2-[RubII-OH2]2+ (dashed). (B) Ground-state
absorption for1 µm TiO2 film (black), TiO2-[RuaII]2+ (green),
TiO2-[RubII-OH2]2+ (red), TiO2-[RuaII-RubII-OH2]4+ (blue), and the sum of
TiO2-[RuaII]2+ and TiO2-[RubII-OH2]2+ (dashed). All film samples were in
quartz cuvette containing aqueous 0.1 M HClO4, 25 °C. ... 77
Figure 4.3. Transient absorption spectra of (A) TiO2-[RuaII]2+ and (B)
TiO2-[RuaII-RubII-OH2]4+, and normalized (C) TiO2-[RuaII]2+ and (D)
50 ps, 100 ps, 500 ps, and 1 ns (light line) after laser excitation. Both samples were on 1 µm thick nanocrystalline TiO2 films in aqueous 0.1 M
HClO4 at 25 °C. The excitation wavelength was 420 nm. ... 80
Figure 4.4. Electron injection kinetics monitored at 380 nm for (A) TiO2-[RuaII]2+ (light green), ZrO2-[RuaII]2+ (dark green),
TiO2-[RuII(pbpy)2(bpy)]2+ (orange) (B) TiO2-[RuaII-RubII-OH2]4+ (light
blue) and ZrO2-[RuaII-RubII-OH2]4+ (dark blue). The fits are shown in
black and parameters are summarized in Table 4.1. The films were immersed in aqueous 0.1 M HClO4 at 25 °C. The excitation wavelength
was 420 nm. ... 81 Figure 4.5. The electron injection efficiency for TiO2-[RuaII]2+ is calculated
from the ratio of the difference between the transient absorption intensity at 380 nm of [RuaII]2+ on TiO2 (blue) and ZrO2 (black) at 1 ns and the
difference between intensity of ZrO2 at 1 ns (black) and the inverse of the
ground state absorption on ZrO2 (red) at 380 nm. The electron injection
efficiency for TiO2-RuaII is 72%. The 9% ultrafast injection is seen in the
ratio between ZrO2-[RuaII]2+ (black) and TiO2-[RuaII]2+ at 500 fs (green). ... 83
Figure 4.6. (A) Normalized steady-state emission spectra of ZrO2-[RuaII]2+
(green), ZrO2-[RuaII-RubII-OH2]4+ (blue) and ZrO2-[RubII-OH2]2+ (red).
(B) Time-resolved emission collected at 640 nm of ZrO2-[RuaII]2+ (green)
and ZrO2-[RuaII-RubII-OH2]4+ (blue). The fits (black lines) are
summarized in Table 4.2. All film samples were in quartz cuvette containing aqueous 0.1 M HClO4, 25 °C. The excitation for emission was
450 nm. ... 85 Figure 4.7. (A) Transient absorption spectra of ZrO2-[RubII-OH2]2+ at 1 ps
(dark line), 5 ps, 10 ps, 20 ps, 50 ps, 100 ps, 500 ps, and 1 ns (light line) after laser excitation. (B) Transient absorption kinetics of ZrO2-[RubII-OH2]2+ at 380 nm (dark) and 490 nm (light). The fit is shown
with black line and summarized in Table 4.3. The sample was on 3 μm thick nanocrystalline ZrO2 in aqueous 0.1 M HClO4 at 25 °C. The
excitation wavelength was 420 nm. ... 87 Figure 4.8. The change in red wavelength shift in ground-state bleach (at the
50% point) verses time for TiO2-[RuaII]2+ (green) and
TiO2-[RuaII-RubII-OH2]4+ (blue). The error bars from the linear fit are
included. The fits to the curves are shown in black with parameters
summarized in Table 4.4. ... 88 Figure 4.9. Global Analysis of TiO2-[RuaII]2+ transient spectra in the 0.5 ps to
1 ns time window. (A) Transient absorption difference spectra for [RuaII*]2+ (blue) and [RuaIII]3+ (green). (B) Relative concentration of
[RuaII*]2+ (blue) and [RuaIII]3+ (green). The residuals for the fit are shown
Figure 4.10. Residuals from the global analysis of TiO2-[RuaII]2+... 92
Figure 4.11. Global analysis of TiO2-[RuaII-RubII-OH2]4+. (A) The spectra of
[RuaII]2+ (blue), [RuaIII]3+ (green), [RubIII-OH2]3+ (orange), and
[RubII*-OH2]2+ (purple). Also shown is the calculated ΔA spectrum for
[RubII-OH2]2+/[RubIII-OH2]3+ (dashed orange) (B) Relative concentrations
of [RuaII*]2+ (blue), [RuaIII]3+ (green), [RubIII-OH2]3+ (orange), and
[RubII*-OH2]2+ (purple). The residuals for the global fit are shown in
Figure 4.12. The concentrations shown at 10 ps are different from the initial concentrations for the fit due to electron injection of the
chromophore that occurs between 500 fs and 10 ps. ... 95 Figure 4.12. Residuals from the global analysis of TiO2-[RuaII-RubII-OH2]4+. ... 96
Figure 4.13. Transient absorption spectra of (A) TiO2-[RuaII]2+ and (B)
TiO2-[RuaII-RubII-OH2]4+ from 1 ns to 1 µs after laser excitation. Both
samples were on 1 µm thick nanocrystalline TiO2 in aqueous 0.1 M
HClO4 at 25 °C. The excitation wavelength was 420 nm. ... 97
Figure 4.14. Transient absorption kinetics for back electron transfer monitored at 490 nm for TiO2-[RuaII]2+ (green) and
TiO2-[RuaII-RubII-OH2]4+ (blue). The signal was inverted and normalized.
The excitation wavelength was 420 nm. All samples were on 1 µm thick
TiO2 films in aqueous 0.1 M HClO4 solution at 25°C. ... 98
Figure 5.1. Schematic design of the bilayer molecular assembly [RuaII-Zr-RubII-OH2]4+, the chromophore [RuaII-Zr]2+, and catalyst
[RubII-OH2]2+on nanocrystalline TiO2 films. The bonding motif of TiO2
-[RuaII-Zr-RubII-OH2]4+ is possible but does not exclude other bonding
modes. ... 106 Figure 5.2. (A) Ground state absorption spectra of 3 μm ZrO2 (grey),
ZrO2-[RuaII-Zr]2+ (green), ZrO2-[RubII-OH2]4+ (red),
ZrO2-[RuaII-Zr-RubII-OH2]4+ (blue), and the sum of ZrO2-[RuaII-Zr]2+ and
ZrO2-[RubII-OH2]2+ (dashed orange). (B) Ground-state absorption spectra
for 3 μm TiO2 film (grey), TiO2-[RuaII-Zr]2+ (green), TiO2-[RubII-OH2]2+
(red), TiO2-[RuaII-Zr-RubII-OH2]4+ (blue), and the sum of
TiO2-[RuaII-Zr]2+ and TiO2-[RubII-OH2]2+ (dashed orange). All samples
are in aqueous 0.1 M HClO4, 25 °C. ... 112
Figure 5.3. Transient absorption spectra of (A) TiO2-[RuaII]2+ at 500 fs (dark
line), 1 ps, 5 ps, 10 ps, 20 ps, 50 ps, 100 ps, 500 ps, and 1 ns (light line) after laser excitation. (B) Transient absorption kinetics for TiO2-[RuaII]2+
at 380 nm (dark) and 450 nm (light). (C) Transient absorption spectra of TiO2-[RuaII-Zr]2+ at 500 fs (dark line) 1 ps, 5 ps, 10 ps, 20 ps, 50 ps,
(light). The fits are shown in black and are summarized in Table 5.1. All samples were in aqueous 0.1 M HClO4 at 25 °C. The excitation
wavelength was 420 nm. ... 114 Figure 5.4. Electron injection efficiency for TiO2-[RuaII-Zr]2+ is calculated
from the ratio of the difference between the transient absorption amplitudes at 380 nm of [RuaII-Zr]2+ on TiO2 (blue) and ZrO2 (black) at
1 ns and the difference between amplitudes of ZrO2 at 1 ns (black) and
the inverse of the ground state absorption on ZrO2 (red) at 380 nm. The
electron injection efficiency for TiO2-[RuaII-Zr]2+ is 81%. The amount of
ultrafast injection is 17% from the ratio of ZrO2-[RuaII-Zr]2+ (black) and
TiO2-[RuaII-Zr]2+ at 500 fs (green). ... 117
Figure 5.5. Transient absorption spectra of (A) TiO2-[RuaII-Zr-RubII-OH2]4+ at
500 fs (dark line), 1 ps, 5 ps, 10 ps, 20 ps, 50 ps, 100 ps, 500 ps, and 1 ns (light line) after laser excitation. (B) Transient absorption kinetics for [RuaII-Zr-RubII-OH2]4+ on TiO2 at 380 nm (dark) and 450 nm (light). The
fits are shown in black and are summarized in Table 5.2. All samples were in aqueous 0.1 M HClO4 at 25 °C. The excitation wavelength was
420 nm. ... 119 Figure 5.6. Transient absorption spectra 1 ps after photoexcitation of
TiO2-[RuaII-Zr]2+ (green), TiO2-[RuaII-Zr-RubII-OH2]4+ (blue),
TiO2-[RubII-OH2]2+ (red) and the sum of TiO2-[RuaII-Zr]2+ and
TiO2-[RubII-OH2]2+ (dashed orange). All samples were on 3 µm thick
nanocrystalline TiO2 films in aqueous 0.1 M HClO4 at 25 °C. The
excitation wavelength was 420 nm. ... 120 Figure 5.7. Transient absorption spectra of ZrO2-[RubII-OH2]2+ at 1 ps (dark
line), 5 ps, 10 ps, 20 ps, 50 ps, 100 ps, 500 ps, and 1 ns (light line) after laser excitation. (B) Transient absorption kinetics of ZrO2-[RubII-OH2]2+
at 380 nm (dark) and 490 nm (light). The fit is shown with black line and summarized in Table 5.3. The sample was on 3 μm thick nanocrystalline ZrO2 film in aqueous 0.1 M HClO4 at 25 °C. The excitation wavelength
was 420 nm. ... 122 Figure 5.8. (A) Normalized steady-state emission spectra of ZrO2-[RuaII-Zr]2+
(green), ZrO2-[RuaII-Zr-RubII-OH2]4+ (blue), and ZrO2-[RubII-OH2]4+
(red). (B) Time-resolved emission of ZrO2-[RuaII-Zr]2+ (green) and
ZrO2-[RuaII-Zr-RubII-OH2]4+ (blue) collected at 640 nm. The fits (black
lines) are summarized in Table 5.4. The samples were in quartz cuvettes containing aqueous 0.1 M HClO4, 25 °C. The excitation wavelength was
450 nm. ... 124 Figure 5.9. Normalized transient absorption spectra of (A) TiO2-[RuaII
-Zr-RubII-OH2]4+ and (B) TiO2-[RuaII-Zr]2+ at 500 fs (dark line), 1 ps, 5 ps,
excitation. (C) Change in red wavelength of the ground-state bleach (at the 50% point) verses time for TiO2-[RuaII-Zr]2+ (green) and
TiO2-[RuaII-Zr-RubII-OH2]4+ (blue). The fits are shown with black line
and summarized in Table 5.5. All samples were in aqueous 0.1 M HClO4
at 25 °C. The excitation wavelength was 420 nm. ... 126 Figure 5.10. Global Analysis following excitation of TiO2-[RuaII-Zr]2+. (A)
The spectra of [-RuaII*-]2+ (blue), [-RuaIII-]3+ (green), and measured ΔA
([RuII]2+/[RuIII]3+) (green dashed). (B) Relative concentration of [-RuaII*-]2+ (blue) and [-RuaIII-]3+ (green) verse time. The residuals are
shown in Figure 5.11. ... 129 Figure 5.11. Residuals from the global analysis of TiO2-[RuaII-Zr]2+. ... 130
Figure 5.12. Global analysis following excitation of TiO2-[RuaII
-Zr-RubII-OH2]4+. (A) The spectra of [-RuaII*-]2+ (blue), [-RuaIII-]3+
(green), [-RubII*-OH2]2+ (purple), [-RubIII-OH2]3+ (orange) and measured
ΔA for [RuaII]2+/[RuaIII]3+ (dashed green) and
[RubII-OH2]2+/[RubIII-OH2]3+ (dashed orange). (B) Relative concentration
of [-RuaII*-]2+ (blue), [-RuaIII-]3+ (green), [-RubII*-OH2]2+ (purple) and
[-RubIII-OH2]3+ (orange) verses time. The residuals are shown in Figure
5.13. ... 132 Figure 5.13. Residuals from the global analysis of
LIST OF ABBREVIATIONS
bpy 2,2’-bipyridine
CaF2 calcium fluoride
CMOS complementary metal oxide semiconductor
CO2 carbon dioxide
CPA chirped pulse amplification
CuAAC copper(I)-catalyzed azide-alkyne cycloaddition
DNA deoxyribonucleic acid
DSPEC dye-sensitized photo electrosynthesis cell DSSC dye-sensitized solar cell
e- electron
FWHM full width half maximum
Gnd HCl guanidinium chloride
H+ proton
H2O water
HClO4 perchloric acid
IR infrared
L 4´-methyl-(2,2´-bipyridine)-4-propargyl amide L1 4´-methyl-(2,2´-bipyridine)-4-propargyl amide L2 4´-methyl-(2,2´-bipyridine)-4-dimethyl-ether
ln natural logarithm
Mebimpy 2,6-bis(1-methylbenzimidazol-2-yl)pyridine
MeOH methanol
1MLCT singlet metal to ligand charge transfer 3MLCT triplet metal to ligand charge transfer
MOF metal organic framework
O2 oxygen gas
OD optical density
OEC oxygen evolving complex
OPA optical parametric amplifier
Os(II) osmium (II)
[Os0] initial Os concentration
pbpy 4,4´-(PO3H2)2-2,2´-bipyridine
pdb protein data base
pH logarithm of the reciprocal of hydrogen ion concentration
phen phenanthroline
pKA logarithmic acid dissociation constant
PP II polyproline II
PS II photosystem II
Ru(II) ruthenium (II)
[Ru0] initial Ru concentration
[RuOs] initial Ru/Os peptide concentration SPPS solid-phase peptide synthesis
SVD singular value decomposition
TCSPC time-correlated single photon counting TiO2 titanium dioxide
UV-Vis-NIR ultraviolet-visible-near infrared
Zr4+ zirconium ions
LIST OF SYMBOLS
≈ approximately
A absorbance
ΔA change in absorbance <τ> average lifetime
°C degrees Celsius
3dd triplet d-d excited state
E0 energy gap
ε molar absorptivity
ν frequency
ΔG Gibb’s free energy
quantum spacing frequency mode I(t) initial concentration at time t Φinj injection efficiency
k rate constant
Ka association equilibrium constant
kb Boltzman’s constant
kRu Ru excited-state rate constant
π-π pi to pi ligand stacking ππ* pi to pi* electronic transition
S electron-vibrational coupling constant
Γ surface loading
t time
T temperature
τ lifetime
τEnT energy transfer lifetime
the full width half-maximum of the 0-0 vibronic component
λ wavelength
λmax maximum wavelength
0,1/2
1.1.OVERVIEW
The harvesting of energy from the sun offers a promising strategy as an alternative energy resource.1-2 The dye-sensitized solar cell (DSSC), or Grätzel cell, is part of the first generation of solar cell devices that utilize light-harvesting chromophores on nanocrystalline semiconductors to generate a charge separation and thus electricity upon photoactivation.3 DSSCs, however, do not provide a solution to energy storage during times of low solar flux. As a result, recent efforts have been made to design an artificial photosynthetic device that will store the energy in the form of solar fuels such as methane or ethanol. The DSPEC, or dye-sensitized photoelectrosynthesis cell, uses sunlight to drive the oxidation of water and the reduction of protons or carbon dioxide to chemical fuels. 4 Overall, DSPEC devices integrate molecular components that can harvest light, separate the redox equivalents, and drive catalytic water oxidation.
Water oxidation requires the sequential transfer of four electrons and four protons in the net reaction 2H2O → O2 + 4H+.1 A general strategy to achieve the multi-functional
system couples molecular catalysts with the charge separation capability of surface-bound dyes, such as those found in DSSCs, which provide the oxidative equivalents needed to drive the water oxidation cycle. Essential to the efficiency of the DSPEC is the placement of the light-absorbing chromophore and catalyst in close proximity to facilitate charge separation and activation of the catalyst. Thus, a molecular architecture arranging the light-harvesting chromophore and water oxidation catalyst effectively is central to the function of the DSPEC.
polymers, dendrimers and MOFs are easily made, but due to the nature of their syntheses, are not monodisperse in structure. Direct synthetic strategies, such as porphyrins and molecular assemblies, offer control over chromophore and catalyst placement, but are difficult to synthesize and not modular in design. Therefore, a scaffold architecture that is both easily synthesized and controls the placement of the molecular substituents is needed.
The two strategies explored within this dissertation are peptide and layered scaffolds. These approaches offer a solution for scaffolds that are both easily synthesized and provide the ability to control chromophore-catalyst placement. The first scaffolds studied are peptides. The studies included here specifically focus on coiled-coils and oligoprolines. Peptide scaffolds are advantageous because they offer control over the placement of the chromophores and catalysts. For example, chromophore placement can be controlled on two levels by both its primary sequence and resulting higher order structure. The primary sequence of a peptide uses weak forces, such as hydrogen bonding and ionic interactions, to dictate the secondary and tertiary structures arranging the chromophores and catalysts. Both peptide systems discussed in this dissertation fold in to a helical structure based on the primary sequence and solvent. The second scaffold architecture discussed is the layered or “layer-by-layer” approach. This strategy simplifies molecular placement by eliminating the need to synthesize a base scaffold. Instead, the “layer-by-layer” approach utilizes coordination chemistry to arrange the chromophores and catalysts on a nanocrystalline film. However, due to the random nature of the “layer-by-layer” structure the exact orientation of the chromophores cannot be controlled.
DSSCs and DSPECs. There are a variety of kinetic processes that occur in both the chromophore-chromophore systems and chromophore-catalyst systems. Specifically, upon photoexcitation surface bound chromophores inject electrons into the conduction band of the nanocrystalline TiO2 film, which is often followed by electron transfer. Once photoexcited,
energy transfer between the chromophores and catalysts species is also possible. Lastly charge recombination or back electron transfer from the TiO2 to the oxidized chromophore or
catalyst can occur. These kinetic processes occur with time constants spanning several orders of magnitude ranging from femtoseconds to milliseconds. As a result a variety of photophysical techniques are needed to investigate these processes. Specifically, in this dissertation ultrafast transient absorption, picosecond transient absorption, and time-correlated single photon counting (TCSPC) are used to investigate the scaffolds.
The remainder of this dissertation is divided into four chapters. Chapter 2 discusses the use of time-resolved emission spectroscopy to measure position-dependent energy transfer that occurs through changes in the sequence of the coiled-coil peptide scaffold. Through the tertiary structure, the coiled-coil supramolecular peptide scaffold controls the functional properties of the Ru(II) and Os(II) assembly.
Chapter 3 discusses the photophysical analysis of oligoproline peptide scaffold containing two Ru(II) complexes, where one Ru(II) complex is bound to nanocrystalline TiO2. Ultrafast transient absorption and time-resolved emission techniques were used to
observe remote injection into TiO2 due to energy transfer from the outer chromophore to the
inner bound chromophore, followed by electron injection into TiO2.
A global kinetic analysis of the transient absorption spectra reveal photoinduced electron injection on the timescale of 18 ps, with subsequent transfer of the oxidative equivalent to the water oxidation catalyst on the hundred of picoseconds timescale.
Chapter 5 discusses the photophysical analysis of a “layer-by-layer” chromophore-catalyst assembly. Again ultrafast transient absorption spectroscopy is used to determine the kinetics of the first photoactivation step for water oxidation. The global analysis results in photoinduced picosecond electron transfer followed by transfer of the oxidative equivalent to the catalyst on the hundreds of picosecond timescale.
REFERENCES
(1) Alstrum-Acevedo, J. H.; Brennaman, M. K.; Meyer, T. J. Inorg. Chem. 2005, 44, 6802-6827.
(2) Lewis, N. S.; Nocera, D. G. Proceedings of the National Academy of Sciences 2006, 103, 15729-15735.
(3) O’Regan, B.; Grätzel, M. Nature 1991, 353, 737-740.
(4) Song, W.; Chen, Z.; Brennaman, M. K.; Concepcion, J. J.; Patrocinio, A. O. T.; Murakami Iha, N. Y.; Meyer, T. J. Pure Appl. Chem. 2011, 83, 749-768.
(5) Fang, Z.; Eshbaugh, A. A.; Schanze, K. S. J. Am. Chem. Soc. 2011, 133, 3063-3069. (6) Liu, Y.; Summers, M. A.; Edder, C.; Fréchet, J. M. J.; McGehee, M. D. Adv. Mater. 2005, 17, 2960-2964.
(7) Kim, Y.-G.; Walker, J.; Samuelson, L. A.; Kumar, J. Nano Lett. 2003, 3, 523-525. (8) Wang, L.; Puodziukynaite, E.; Vary, R. P.; Grumstrup, E. M.; Walczak, R. M.; Zolotarskaya, O. Y.; Schanze, K. S.; Reynolds, J. R.; Papanikolas, J. M. J. Phys. Chem. Lett. 2012, 3, 2453-2457.
(9) Gilat, S. L.; Adronov, A.; Fréchet, J. M. J. Angew. Chem. Int. Ed. 1999, 38, 1422-1427.
(10) Hasobe, T.; Kashiwagi, Y.; Absalom, M. A.; Sly, J.; Hosomizu, K.; Crossley, M. J.; Imahori, H.; Kamat, P. V.; Fukuzumi, S. Adv. Mater. 2004, 16, 975-979.
(11) Lee, C. Y.; Farha, O. K.; Hong, B. J.; Sarjeant, A. A.; Nguyen, S. T.; Hupp, J. T. J. Am. Chem. Soc. 2011, 133, 15858-15861.
(13) Hu, K.; Robson, K. C. D.; Johansson, P. G.; Berlinguette, C. P.; Meyer, G. J. J Am. Chem. Soc. 2012, 134, 8352-8355.
(14) Huang, Z.; Geletii, Y. V.; Musaev, D. G.; Hill, C. L.; Lian, T. Ind. Eng. Chem. Res. 2012, 51, 11850-11859.
(15) Norris, M. R.; Concepcion, J. J.; Harrison, D. P.; Binstead, R. A.; Ashford, D. L.; Fang, Z.; Templeton, J. L.; Meyer, T. J. J. Am. Chem. Soc. 2013, 135, 2080-2083.
(16) Ashford, D. L.; Song, W.; Concepcion, J. J.; Glasson, C. R. K.; Brennaman, M. K.; Norris, M. R.; Fang, Z.; Templeton, J. L.; Meyer, T. J. J. Am. Chem. Soc. 2012, 134, 19189-19198.
(17) Mozer, A. J.; Griffith, M. J.; Tsekouras, G.; Wagner, P.; Wallace, G. G.; Mori, S.; Sunahara, K.; Miyashita, M.; Earles, J. C.; Gordon, K. C.; Du, L.; Katoh, R.; Furube, A.; Officer, D. L. J. Am. Chem. Soc. 2009, 131, 15621-15623.
(18) Uetomo, A.; Kozaki, M.; Suzuki, S.; Yamanaka, K.; Ito, O.; Okada, K. J. Am. Chem. Soc. 2011, 133, 13276-13279.
(19) Wilger, D. J.; Bettis, S. E.; Materese, C. K.; Minakova, M.; Papoian, G. A.; Papanikolas, J. M.; Waters, M. L. Inorganic Chemistry. 2012, 51, 11324-11338.
(20) Ma, D.; Bettis, S. E.; Hanson, K.; Minakova, M.; Alibabaei, L.; Fondrie, W.; Ryan, D. M.; Papoian, G. A.; Meyer, T. J.; Waters, M. L.; Papanikolas, J. M. J. Am. Chem. Soc. 2013, 135, 5250-5253.
(21) Hong, J.; Kharenko, O. A.; Ogawa, M. Y. Inorg. Chem. 2006, 45, 9974-9984.
CHAPTER 2.TUNABLE ENERGY TRANSFER RATES VIA CONTROL OF PRIMARY, SECONDARY, AND TERTIARY STRUCTURE OF A COILED COIL
PEPTIDE SCAFFOLD1
1This chapter previously appeared as an article in the Inorganic Chemistry. The original
2.1.INTRODUCTION
The design of molecular materials capable of performing complex functions is pivotal to “bottom-up” approaches in molecular electronics,1 sensing1a,2 and solar energy conversion.3,4 The most common strategy for building artificial assemblies uses covalent bond formation to connect molecular components with rigid linkers that dictate both distance and orientation. While this approach provides exquisite control over spatial parameters,5 the optimization of functional performance often requires the development of new synthetic routes making the implementation very difficult, especially as the number of molecular components increases. Alternatively, chromophores have been placed on easily synthesized scaffolds such as polymers,6 dendrimers,1a,3c,7 and organogels8. However this approach can yield assemblies that are not monodisperse in molecular weight or chemical composition and incorporate many different morphological constituents. While large systems are readily made and some control over the primary structure is possible, the flexible scaffolds result in solution structures that vary from one assembly to the next.
organizational strategies of biomolecules provide a number of advantages, including design flexibility, ease of synthesis, and spatial control of functionality through supramolecular architectures that allow for fine-tuning of materials properties.
The design of an artificial polypeptide system based on a heterodimeric coiled-coil architecture includes a primary sequence that defines both the secondary and tertiary structure, resulting in self-assembly. This provides fine control of the positioning of octahedral tris(bipyridyl) transition metal complexes [MII(bpy)3]2+ (M = Ru or Os, bpy =
Figure 2.1. (A) Illustration of metallopeptide system containing the α-helical coiled-coil scaffold and metal complexes (coiled coil: pdb 2AHP). (B) Structure of the metal complex and its attachment to the α-helix.
The peptide structures studied here take advantage of two flexible synthetic methodologies: solid-phase peptide synthesis (SPPS) and the copper(I)-catalyzed azide-alkyne cycloaddition (CuAAC or “click reaction”). SPPS is advantageous as it allows for exact positioning of the chromophores in the primary sequence. The use of click chemistry as an orthogonal linkage strategy between the chromophores and peptides has several advantages. First, it avoids issues with formation of statistical mixtures of species, as was obtained in the electron transfer coiled-coil systems developed by Ogawa, in which the chromophore linkage was accomplished via non-specific coordination chemistry.15 Secondly, click chemistry provides advantages over the direct amide linkage used in the electron-transfer oligoproline systems reported by Meyer, in which orthogonal protecting group strategies had to be employed.14
almost an order of magnitude across the series, as well as denaturation studies, confirm that energy transfer is the direct result of folding into a well-defined tertiary structure. All-atom molecular dynamics simulations provide insight into the microscopic environment, revealing an assembly with a dynamic, yet robust, tertiary structure that effectively controls the relative positioning of the two complexes.
The work described in this chapter was published in Inorganic Chemistry (Wilger, D.; Bettis, S.E., et al. Inorg. Chem. 2012, 51 (21), 11324-11338). The paper was a result of close collaboration between three research groups lead by Dr. Marcey Waters, Dr. John Papanikolas and Dr. Garegin A. Papoian. The contribution I made included the photophysical analysis of the peptides and is described in detail in this chapter. The work of my collaborators is summarized in this chapter, and described in detail in our published paper.
2.2.EXPERIMENTAL
2.2.1.Steady-state Techniques
Ground state absorbance measurements were conducted with a Hewlett Packard 8453 UV-VIS-NIR absorption spectrophotometer. Steady state emission (SSE) data were collected using an Edinburgh Instruments FLS920 equipped with a 450 W Xenon lamp and photomultiplier tube (Hamamatsu 2658P). SSE data were collected using a bandwidth no larger than 4.0 nm and, once collected, were corrected for the emission spectrophotometer’s spectral response.
2.2.2.Time-Correlated Single Photon Counting
444.2 nm diode laser (Edinburgh Instruments EPL- 445, 73 ps FWHM pulse width) operated at 200 kHz. A 495 nm long pass color filter was used for emission experiments. The samples were placed in a 2.0 mm cuvette and placed at 45 degree angle from the incident laser beam. Samples were purged in Argon for >25 minutes just prior to emission experiments. All experiments were performed with Abs444 nm< 0.2 OD. The solvent for each sample was 10
mM phosphate buffer at pH 7.
2.3.RESULTS AND DISCUSSION
2.3.1.Peptide Design and Structural Characterization
Figure 2.2. (A) Primary sequences of the P1 and P2 peptides using the single letter amino acid code (in capitals). Each 28-residue peptide has four heptad repeat units. The common letter designations for the heptad positions (abcdefg) are shown above the first heptad repeat unit for P1. The hydrophobic interactions are shown as blue lines, the hydrogen bonding interaction between Asn sidechains is shown as a cyan line, and the complementary ionic interactions between the two peptides are shown as red dashed lines. (B) A helical-wheel diagram displaying the potential points for attachment when viewed down helix axis from the N-terminus. The P1 peptide is modified with Os(II) at the f, c, or g position within the
second heptad. The P2 peptide is modified with Ru(II) at the f, b, or c position within the second heptad.
protein data base (PDB code: 3NM6, 1UIX, and 3M9B). Based on measurement from the α-carbons, the distance between aligned f positions typically ranged from 14.0-14.9 Å. Similar analysis indicated that b-c separations were 12.7-13.5 Å, and e-g separations were 9.6-10.3 Å. Although these measurements do not account for the length or flexibility of the azidolysine linker, they qualitatively represent the general trends that may be expected for the rates of energy transfer in the 2f-Os/2f-Ru, 2c-Os/2b-Ru, and 2g-Os/2e-Ru metallopeptide pairs.
The structure of the three peptide systems was characterized with the use of circular dichroism and thermodynamic stability. These studies indicate that all three heterodimeric metallopeptide pairs form coiled-coil structures when mixed in a 1:1 ratio in aqueous buffer at µM concentrations.22
2.3.2.Stead-state Spectroscopy
The ground state absorption spectrum for the 2g-Os/2e-Ru metallopeptide pair exhibits a peak at 450 nm and a lower energy band that is centered at 650 nm (Figure 3). The peak centered at 450 nm is the singlet metal-to-ligand charge transfer (1MLCT) for both the Ru(II) and Os(II) bipyridyl complexes, while the lower energy band corresponds to direct excitation of the 3MLCT in the Os(II) complex which is optically accessible because of large spin-orbit coupling. When excited at 450 nm, the steady-state emission spectrum for the 2g-Os/2e-Ru peptide exhibits a higher energy band (λmax at 660 nm) that corresponds to Ru(II) 3MLCT emission after fast intersystem crossing from the 1MLCT, while the peak centered at
Figure 2.3. The ground-state absorption (black:25 µM 2e-Ru and 50 µM 2g-Os) and steady state emission (blue: 25 µM 2e-Ru and 50 µM 2g-Os) spectra of the 2g-Os/2e-Ru peptide coiled-coil in a 10 mM sodium phosphate buffer solution, pH 7, 25°C. Also shown are the 2e-Ru(II) peptide (green dashed: 25 µM 2e-Ru) and 2g-Os(II) peptide emission spectra (grey dashed: 100 µM 2g-Os). The excitation wavelength was 450 nm.
400 600 800 1000
0.00 0.05 0.10 0.15 0.20
0.0 0.2 0.4 0.6 0.8 1.0
N
orm
alized
Em
is
sion
Intensity
Abs
orbanc
e
Wavelength, nm
Emission
Absorbance
Ru
Figure 2.4. Steady-state spectra of the three peptide coiled-coil systems (blue: 25 mM 2f-Ru and 50 mM 2f-Os, red: 25 mM 2b-Ru and 50 mM 2c-Os, and green: 25 mM 2e-Ru and 50 mM 2e-Os) in a 10 mM sodium phosphate buffer solution, pH 7, 25°C. The excitation wavelength was 450 nm.
2.3.3.Time-resolved Spectroscopy
Photoexcitation of the Ru(II) center at 450 nm is followed by rapid relaxation into the
3MLCT band, and potentially triplet-triplet energy transfer to the lower energy Os(II) site. In
emission contaminates the emission of Os(II) at 800 nm, the converse is not true, and both the time-resolved and steady-state emission measurements show no detectable Os(II) emission at 660 nm. Thus, Ru(II) emission provides the cleanest window through which to view Ru-to-Os energy transfer.
The 2e-Ru/P1 coiled-coil was used as a control to measure the Ru lifetime in the absence of energy transfer (Figure 2.5A). The decay is single exponential with a lifetime around 450 ns (2.2 x 10⁶ s-1), comparable to the lifetime of Ru(bpy)32+ in water.23 Pairing of
Figure 2.5. (A) Time-resolved emission of 2e-Ru peptide in the presence of the P1 peptide (black: 25 µM 2e-Ru and 50 µM P1) and the 2g-Os peptide (green: 25 µM 2e-Ru and 50 µM 2g-Os) in a 10 mM sodium phosphate buffer solution at pH 7 and 25°C. (B) P1/2e-Ru
peptide with chemical denaturant (black: 25 µM 2e-Ru, 50 µM P1 and 5 M guanidinium chloride, 20 mM sodium phosphate, and 100 mM sodium chloride buffer at pH 7 and 25°C) and 2g-Os/2e-Ru peptide pair with chemical denaturant (green: 25 µM 2e-Ru, 50 µM 2g-Os, and 5 M guanidinium chloride 20 mM sodium phosphate and 100 mM sodium chloride buffer at pH 7 and 25°C). Ru(II) emission quenching by energy transfer is turned off in the presence of the chemical denaturant. The time-resolved emission data were collected at 660 nm with an excitation of 444 nm.
0.0 0.2 0.4 0.6 0.8 1.0
0 200 400 600 800 1000
0.0 0.2 0.4 0.6 0.8 1.0 N orm aliz ed Em is sion Int ens ity Time, ns
A
Folded
Unfolded
P1/2e-Ru
2g-Os/2e-Ru
P1/2e-Ru
2g-Os/2e-Ru
2.3.4.Influence of Folding on Energy Transfer
A comparison of the energy transfer dynamics in the folded and unfolded state can be achieved through denaturation of the peptide scaffold, which, in principle, can be accomplished by either heating or incorporating chemical additives. Temperature induced denaturation is more problematic because of the high thermal stability of the coiled-coil peptides. The analysis would be further complicated by the fact that the Ru(II) 3MLCT excited state lifetime is diminished with increasing temperature due to the thermally accessible metal-centered (3dd) excited states that undergo rapid nonradiative decay. Chemical denaturation with GndHCl provides a viable alternative method for studying the denatured state at the same concentration used for time-resolved experiments.
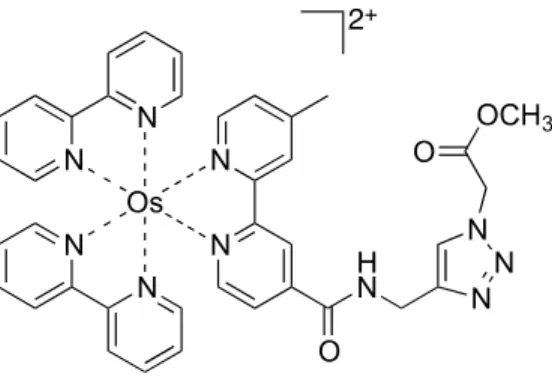
Figure 2.6. The Os(II) complex (1) was used as a diagnostic for intermolecular energy transfer not mediated by the peptide scaffold.
In addition, an Os(II) “control complex” (1, Figure 2.6) was designed to mimic the acceptor module, while lacking any molecular recognition elements that would allow for association with the partner peptide. When the control complex (1) was mixed with the 2b-Ru peptide, no change in the excited-state lifetime was observed with up to 2 equivalents present. This differs from similar studies of Ru(II) and Os(II) modified oligonucleotides, which show that the addition of a noncovalently attached Os(II) complex ([Os(bpy)2(phen)]2+) to a Ru(II)-containing oligonucleotide solution results in some
The results of the two control experiments clearly demonstrate that energy transfer within the peptide system occurs between coiled-coil dimer partners, and requires the folded self-assembled peptide scaffold for structural organization.
2.3.5.Positional Variation and Energy Transfer
The Ru(II) emission quenching for the three coiled-coil metallopeptide pairs: 2f-Os/2f-Ru, 2c-Os/2b-Ru, and 2g-Os/2e-Ru (Figure 2.7) was compared along with the transients from three coiled-coils containing the Ru(II) metallopeptides paired to the P1 peptide. All three of the P1/Ru(II) systems exhibit qualitatively similar monoexponential decay kinetics (Table 2.1). Each transient in the mixed Ru(II)/Os(II) systems is biexponential, where the slow component arises from the free Ru chains in solution and the fast component reflects Ru quenching due to energy transfer. The peptide pair that places the complexes the farthest apart, 2f-Os/2f-Ru (Figure 2.7 blue line), has the largest distance between alpha carbons (14.0-14.9 Å), and results in the slowest energy transfer, kEnT = 816
ns. The 2g-Os/2e-Ru peptide pair (Figure 2.7, green line) places the complexes the closest to each other with an α-carbon distance of 9.6-10.3 Å, and has the fastest energy transfer, kEnT =
42 ns. Lastly, the 2c-Os/2b-Ru peptide pair has an intermediate spacing (12.7-13.5 Å) and its energy transfer rate falls in the middle, kEnT = 304 ns (Figure 2.7, red line). The trend of the
Figure 2.7. Time-resolved emission transients showing the distance dependence of the energy transfer rate for the 2f-Os/2f-Ru (blue: 25 µM 2f-Ru and 50 µM 2f-Os), 2c-Os/2b-Ru (red: 25 µM 2b-Ru and 50 µM 2c-Os), and 2g-Os/2e-Ru (green: 25 µM 2e-Ru and 50 µM 2g-Os) peptide pairs in 10 mM phosphate buffer solution at pH 7 and 25°C. The P1/2e-Ru peptide (grey: 25 µM 2e-Ru and 50 µM P1) is shown for comparison. From the transients it is clear that the energy transfer rate is faster the closer the metal complexes are placed to one another. The time-resolved emission data were collected at 660 nm with an excitation
wavelength of 444 nm.
2.3.6.Data Analysis
The emission decay was measured in a series of 2g-Os/2e-Ru samples in which the 2e-Ru peptide concentration is kept constant at 25 µM and the 2g-Os peptide concentration is incrementally increased from 0 µM to 50 µM (Figures 2.8-2.10). As the 2g-Os peptide concentration is increased the slow component decreases in amplitude, consistent with a
0 100 200 300 400 500
0.0 0.2 0.4 0.6 0.8 1.0 N o rm a liz e d E m is si o n In te n si ty Time, ns P1/2b-Ru
2c-Os/2b-Ru 2f-Os/2f-Ru
diminishing amount of free Ru(II). The relative amplitudes of the two kinetic components reflect the fractions of Ru(II)/Os(II) dimer (fast) and free Ru(II) peptide (slow), resulting in an intensity decay that can be expressed as:
( ) ([ ][ ] ) ( ) ([ ] [ ]
[ ] ) (2.1) where kEnT is the energy transfer rate and kRu is the rate of Ru(II) excited state decay. The
relative amplitudes of the two components are dependent on the concentration of associated heterodimers, [RuOs], which is determined by the ground state equilibrium:
(2.2)
[ ][ ][ ] ([ ] [ ])([ ][ ] [ ]) (2.3)
where [Ru]0 and [Os]0 are the total concentrations of the two peptides and Ka is the
Figure 2.8. Time-resolved emission for P1/2e-Ru peptide (black: 25 µM 2e-Ru and 50 µM P1) and 2g-Os/2e-Ru peptide pair containing various amounts of the 2g-Os peptide (blue: 6.25 µM, red: 12.5 µM, green: 18.75 µM, grey: 25 µM, and purple: 50 µM with all containing 25 µM 2e-Ru) in a 10 mM phosphate buffer solution at pH 7 and 25°C. The increase in 2g-Os peptide concentration drives the equilibrium to heterodimer formation and thus greater Ru(II) emission quenching by energy transfer. The time-resolved emission data were collected at 660 nm with an excitation wavelength of 444 nm.
0 200 400 600 800 1000
0.0 0.2 0.4 0.6 0.8 1.0 N orm aliz ed Em is sion Int ens ity Time, ns a b c d e f
[Ru]0 = 25 µM, a [Os]0 = 0 µM
b [Os]0 = 6.25 µM
c [Os]0 = 12.5 µM
d [Os]0 = 18.75 µM
e [Os]0 = 25 µM
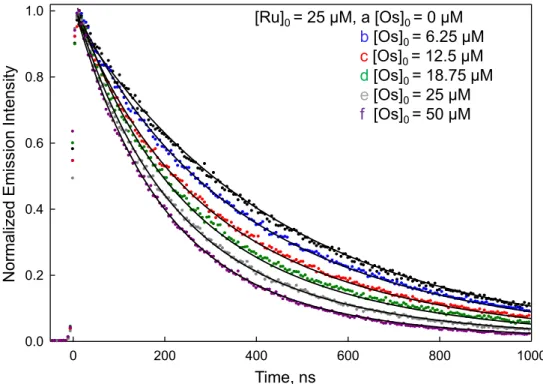
Figure 2.9. Time-resolved emission for P1/2b-Ru peptide (black: 25 µM 2b-Ru and 50 µM P1) and 2c-Os/2b-Ru peptide pair containing various amounts of the 2c-Os peptide (blue: 6.25 µM, red: 12.5 µM, green: 18.75 µM, grey: 25 µM, and purple: 50 µM with all containing 25 µM 2b-Ru) in a 10 mM phosphate buffer solution at pH 7 and collected at 25°C. From the data is you can see that the increase in 2c-Os peptide concentration drives the equilibrium to heterodimer formation and thus greater Ru(II) emission quenching by energy transfer. The time-resolved emission data were collected at 660 nm with an excitation of 444 nm.
0 200 400 600 800 1000
0.0 0.2 0.4 0.6 0.8 1.0
Normali
zed
Emis
sio
n
Int
ens
ity
Time, ns
[Ru]0 = 25 µM, a [Os]0 = 0 µM
b[Os]0 = 6.25 µM
c[Os]0 = 12.5 µM
d[Os]0 = 18.75 µM
e[Os]0 = 25 µM
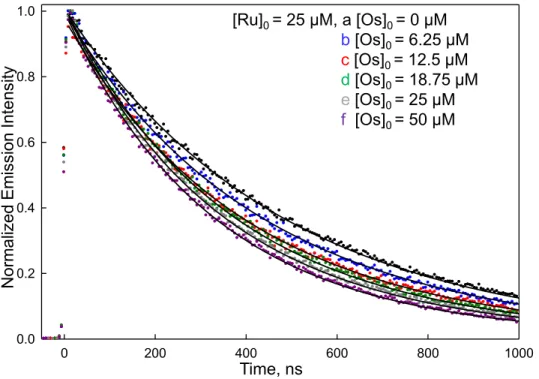
Figure 2.10. Time-resolved emission for P1/2f-Ru peptide (black: 25 µM 2f-Ru and 50 µM P1) and 2f-Os/2f-Ru peptide pair containing various amounts of the 2f-Os peptide (blue: 6.25 µM, red: 12.5 µM, green: 18.75 µM, grey: 25 µM, and purple: 50 µM with all containing 25 µM 2f-Ru) in a 10 mM phosphate buffer solution at pH 7 and collected at 25°C. From the data is you can see that the increase in 2f-Os peptide concentration drives the equilibrium to heterodimer formation and thus greater Ru(II) emission quenching by energy transfer. The time-resolved emission data were collected at 660 nm with an excitation of 444 nm.
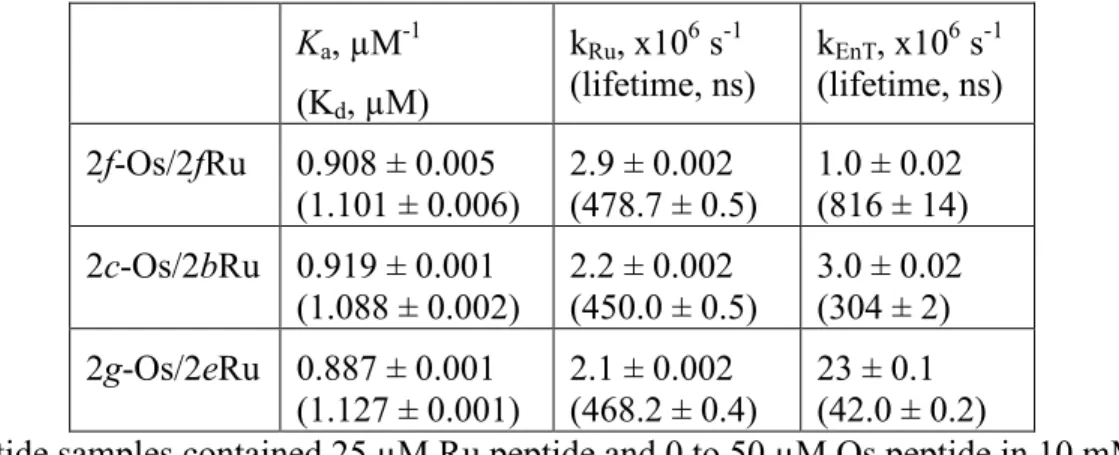
The solid lines in Figures 2.8-2.10 are the result of a global non-linear least squares fit of the series of decays obtained at different Os(II) concentrations to Equations (2.1-2.3) with kEnT, kRu and Ka being adjustable parameters. Table 2.1 summarizes the fitting results for
the three peptide pairs. The 2g-Os/2e-Ru peptide pair exhibits the fastest energy transfer with kEnT = 2.3 x 10⁷ s-1 (τ = 42 ns) and the 2f-Os/2f-Ru peptide pair has the slowest with kEnT =
1.0 x 10⁶ s-1 (τ = 816 ns), and the 2c-Os/2b-Ru pair fell in the middle at 3.0 x 10⁶ s-1 (τ = 304
0 200 400 600 800 1000
0.0 0.2 0.4 0.6 0.8 1.0 N orm aliz ed Em is sion Int ens ity Time, ns
[Ru]0 = 25 µM, a [Os]0 = 0 µM
b[Os]0 = 6.25 µM
c[Os]0 = 12.5 µM
d[Os]0 = 18.75 µM
e[Os]0 = 25 µM
ns). The relatively slow energy transfer times in comparison with the lifetime of the Os(II) excited state (τ = 16 ns, k = 6.21 x 10⁷ s-1) prevents a build-up of Os(II) excited state population. Hence a delayed rise in the Os emission, which has been observed in other systems,6e is not observed here. The long linker between the chromophore and the peptide scaffold will cause the attached chromophores to experience a variety of conformations that interconvert on the time scale of the excited state lifetime. Because energy transfer will be more favorable when the two chromophores are in close proximity, the observed rate will likely also reflect the time scale for structural fluctuations.
Table 2.1. Results of the global analysis showing the dependence of the energy transfer rate on the position.a
Ka, µM-1
(Kd, µM)
kRu, x106 s-1
(lifetime, ns) kEnT, x10
6 s-1
(lifetime, ns) 2f-Os/2fRu 0.908 ± 0.005
(1.101 ± 0.006)
2.9 ± 0.002 (478.7 ± 0.5)
1.0 ± 0.02 (816 ± 14) 2c-Os/2bRu 0.919 ± 0.001
(1.088 ± 0.002)
2.2 ± 0.002 (450.0 ± 0.5)
3.0 ± 0.02 (304 ± 2) 2g-Os/2eRu 0.887 ± 0.001
(1.127 ± 0.001)
2.1 ± 0.002 (468.2 ± 0.4)
23 ± 0.1 (42.0 ± 0.2)
aAll peptide samples contained 25 µM Ru peptide and 0 to 50 µM Os peptide in 10 mM
sodium phosphate buffer at pH 7 and 25°C. The error is from the global fitting analysis.
the 2f-Os/2f-Ru system is unlikely to be through space Dexter energy transfer. However, Förster energy transfer, which occurs through a dipole-dipole mechanism, can occur over larger donor-acceptor separations.24 Although Förster energy transfer is formally forbidden for triplet-triplet energy transfer, the large spin-orbit coupling in these late transition metal complexes, particularly the Os(II), may provide it with some allowed character.24 The presence of Förster energy transfer at longer separations is consistent with observations made in other Ru(II)/Os(II) energy transfer systems.6e,10a-c Regardless of the mechanism, the coiled-coil peptide system is an effective scaffold for controlling the donor/acceptor placement and hence energy transfer rate in molecular assemblies.
2.3.7.Molecular Modeling
The coiled-coils systems were modeled using all atom molecular dynamics simulations to gain insight into interactions at the molecular level. The simulations were performed by Dr. Christopher Matereseand Dr. Maria Minakovafrom Dr. Papoian’s research group. The metal-center distributions for all three coiled-coil peptide systems and the trajectories from which they were derived are shown in Figure 2.1l.
metal-centered distance of 12 Å for the 2g-Os/2e-Ru system, 14 Å for the 2c-Os/2b-Ru system and 31 Å for the 2f-Os/2f-Ru system.
Figure 2.12. (A) Bipyridyl ligands arranged in a “neck” conformation, facing away from each other (1.2 nm feature). This conformation was only observed in the 2g-Os/2e-Ru
system. (B) π-π stacking arrangement where bipyridyl rings of two complexes are in Van der Waals contact and parallel to each other (~1 nm feature). This tightly stacked conformation is observed consistently in 2c-Os/2b-Ru system and briefly in 2g-Os/2e-Ru system. (C)
“Loose” packing arrangement of the bipyridyl complexes (~2 nm feature) is a stable basin of conformations with characteristic π-π stacking of one of bipyridine rings of one chromophore and the triazole ring on the linker of the other. This stacking is stable in 2c-Os/2b-Ru system and transitory to closer intercomplex packing conformations in 2g-Os/2e-Ru system.
2.4.CONCLUSIONS
secondary and tertiary structures that control the placement of the energy transfer complexes. Moreover, the use of “click” chemistry allows for straight-forward and well defined control of the placement of the covalently linked chromophores.
REFERENCES
(1) (a) Astruc, D.; Boisselier, E.; Ornelas, C. Chem. Rev. 2010, 110, 1857-1959. (b) Drain, C. M.; Varotto, A.; Radivojevic, I. Chem. Rev. 2009, 109, 1630-1658. (c) Szacilowski, K. Chem. Rev. 2008, 108, 3481-3548. (d) Hoeben, F. J. M.; Jonkheijm, P.; Meijer, E. W.; Schenning, A. Chem. Rev. 2005, 105, 1491-1546.
(2) (a) Lakowicz, J. R. Priciples of Fluorescence Spectroscopy; 3rd ed.; Springer: New York, 2006. (b) McDonagh, C.; Burke, C. S.; MacCraith, B. D. Chem. Rev. 2008, 108, 400-422.
(3) (a) Meyer, T. J. Acc. Chem. Res. 1989, 22, 163-170. (b) Alstrum-Acevedo, J. H.; Brennaman, M. K.; Meyer, T. J. Inorg. Chem. 2005, 44, 6802-6827. (c) Gust, D.; Moore, T. A.; Moore, A. L. Acc. Chem. Res. 2009, 42, 1890-1898. (d) Gust, D.; Moore, T. A. Science 1989, 244, 35-41.
(4) (a) Du, P. W.; Schneider, J.; Luo, G. G.; Brennessel, W. W.; Eisenberg, R. Inorg. Chem. 2009, 48, 4952-4962. (b) Youngblood, W. J.; Lee, S. H. A.; Maeda, K.; Mallouk, T. E. Acc. Chem. Res. 2009, 42, 1966-1973. (c) Bonchio, M.; Carofiglio, T.; Carraro, M.; Fornasier, R.; Tonellato, U. Org. Lett. 2002, 4, 4635-4637.
(6) (a) Jones, W. E.; Baxter, S. M.; Strouse, G. F.; Meyer, T. J. J. Am. Chem. Soc. 1993, 115, 7363-7373. (b) Dupray, L. M.; Meyer, T. J. Inorg. Chem. 1996, 35, 6299-6307. (c) Dupray, L. M.; Devenney, M.; Striplin, D. R.; Meyer, T. J. J. Am. Chem. Soc. 1997, 119, 10243-10244. (d) Friesen, D. A.; Kajita, T.; Danielson, E.; Meyer, T. J. Inorg. Chem. 1998, 37, 2756-2762. (e) Fleming, C. N.; Maxwell, K. A.; DeSimone, J. M.; Meyer, T. J.; Papanikolas, J. M. J. Am. Chem. Soc. 2001, 123, 10336-10347. (f) Sowash, G. G.; Webber, S. E. Macromolecules 1988, 21, 1608-1611. (g) Webber, S. E. Chem. Rev. 1990, 90, 1469-1482.
V. Faraday Discuss. 2004, 127, 295-305. (l) Thomas, K. R. J.; Thompson, A. L.; Sivakumar, A. V.; Bardeen, C. J.; Thayumanavan, S. J. Am. Chem. Soc. 2005, 127, 373-383.
(8) (a) Giansante, C.; Raffy, G.; Schaefer, C.; Rahma, H.; Kao, M.-T.; Olive, A. G. L.; Del Guerzo, A. J. Am. Chem. Soc. 2011, 133, 316-325. (b) Babu, S. S.; Kartha, K. K.; Ajayaghosh, A. Journal of Physical Chemistry Letters 2010, 1, 3413-3424. (c) Ajayaghosh, A.; Praveen, V. K.; Vijayakumar, C. Chem. Soc. Rev. 2008, 37, 109-122. (d) Bhattacharya, S.; Samanta, S. K. Langmuir 2009, 25, 8378-8381.
(9) Ferreira, K. N.; Iverson, T. M.; Maghlaoui, K.; Barber, J.; Iwata, S. Science 2004, 303, 1831-1838.
(10) (a) Hurley, D. J.; Tor, Y. J. Am. Chem. Soc. 1998, 120, 2194-2195. (b) Hurley, D. J.; Tor, Y. J. Am. Chem. Soc. 2002, 124, 3749-3762. (c) Hurley, D. J.; Tor, Y. J. Am. Chem. Soc. 2002, 124, 13231-13241. (d) Lewis, F. D.; Zhang, L. G.; Zuo, X. B. J. Am. Chem. Soc. 2005, 127, 10002-10003. (e) Holmlin, R. E.; Tong, R. T.; Barton, J. K. J. Am. Chem. Soc. 1998, 120, 9724-9725.
(11) Channon, K. J.; Devlin, G. L.; MacPhee, C. E. J. Am. Chem. Soc. 2009, 131, 12520-12521.
(12) Nam, Y. S.; Shin, T.; Park, H.; Magyar, A. P.; Choi, K.; Fantner, G.; Nelson, K. A.; Belcher, A. M. J. Am. Chem. Soc. 2010, 132, 1462-1463.