The Atlantic Coast Conference: A Pre- and Post-Expansion Analysis
Amanda K. Cooley
A thesis submitted to the faculty of the University of North Carolina at Chapel Hill in partial fulfillment of the requirements for the degree of Master in Arts in the Department of Exercise
and Sport Science (Sport Administration).
Chapel Hill 2008
Approved by,
Barbara Osborne, Esq.
Edgar W. Shields, Jr., Ph.D.
Beth Miller, D.A.
iii ABSTRACT Amanda K. Cooley
The Atlantic Coast Conference: A Pre- and Post-Expansion Analysis (Under the direction of Barbara Osborne, J.D.)
Conference restructuring is a trend within Division I athletics and the effects of one conference restructuring extends across Division I athletics. Every Bowl Subdivision conference except for the Pacific-10 has restructured since 1990.
The Atlantic Coast Conference expanded its membership to 12 in 2004-05 adding Boston College, the University of Miami and Virginia Polytechnic Institute and State University. This study identified motives for the expansion and goals set by the ACC leadership. Financial and performance data was compared pre- and post-expansion to determine the effects of expansion on the conference. This data was utilized to determine whether the ACC has met any of the goals identified.
Four goals identified through this study were improving the ACC’s brand/identity, improving the conference’s value in the marketplace, increasing revenues, and maintaining conference culture. Statistical data supports that all goals are being met but did raise areas of concern in competitiveness and net profit.
ACKNOWLEDGEMENTS
I would like to take this opportunity to thank my advisor, Barbara Osborne, for her tireless efforts to push me along the path of writing this thesis. I would also like to extend gratitude
to John Swofford, Jeff Elliott, Davis Whitfield, Bernadette McGlade, and Amy Yakola for their willingness to participate, their time and valuable contributions. Without their contributions, I would not have been able to pursue studying the ACC expansion as I desired.
Personally, I would like to extend gratitude to my friend, Pam Creel, for her efforts in proofreading, which I know she thoroughly enjoyed. Judy Creel (Nanny) transcribed my interviews which was a daunting task for which I am forever grateful I did not have to do myself. I must also express my appreciation for my parents, Bobby and Phyllis Cooley, for their constant support throughout life and assistance with teaching me to write some 24 years
v
TABLE OF CONTENTS
LIST OFTABLES………. vii
LIST OF FIGURES……….. ix
Chapter I. INTRODUCTION………. 1
Statement of Purpose………. 2
Research Questions……… 3
Definition of Terms... 5
` Assumptions... 7
Delimitations... 7
Limitations... 8
Significance of the Study... 8
II. REVIEW OF LITERATURE... 9
Conference Expansions... 9
Motivation for Expansion... 11
Atlantic Coast Conference Expansion... 20
III. METHODOLOGY... 23
Data Collection... 23
Subjects... 23
Procedures... 26
IV. RESULTS... 27
Motives for Expansion... 27
Goals of Expansion... 30
Statistical Results... 33
Motives Realized... 55
V. DISCUSSION... 58
Statistical Measures... 59
Motives and Goals... 70
Recommendations for Further Study... 77
Conclusions... 78
APPENDICES A. FINANCIAL DATA... 80
B. PERFORMANCE DATA... 90
vii
LIST OF TABLES Table
1. Institutional Athletic Department Total Revenues... 80
2. Institutional Total Revenues... 81
3. Institutional Olympic Sport Revenues... 82
4. Institutional Non-Olympic Sport Revenues... 83
5. Institutional Total Athletic Department Expenses... 84
6. Institutional Total Expenses... 85
7. Institutional Olympic Sport Expenses... 86
8. Institutional Non-Olympic Sport Expenses... 87
9. Collective Institutional Total Revenues for the ACC... 88
10. Collective Institutional Total Expenses for the ACC... 88
11. Net Gain/Loss... 89
12. Football Yearly Winning Percentages Pre-Expansion... 90
13. Football Yearly Winning Percentages Post-Expansion... 91
14. Football Winning Percentages... 92
15. Football Non-Conference Winning Percentages... 93
16. Men’s Basketball Yearly Winning Percentages Pre-Expansion... 93
17. Men’s Basketball Yearly Winning Percentages Post-Expansion... 94
18. Men’s Basketball Winning Percentages... 95
19. Men’s Basketball Non-Conference Winning Percentages... 96
20. CBS Basketball Fund Yearly Units Earned... 96
ix
LIST OF FIGURES Figure
1. Olympic sport total revenues for the ACC pre- and post-expansion... 34
2. Non-Olympic sport total revenues for the ACC pre- and post-expansion... 35
3. Olympic sport total expenses for the ACC pre- and post-expansion... 36
4. Non-Olympic sport total expenses for the ACC pre- and post-expansion... 37
5. Total athletic department revenues for the ACC pre- and post-expansion... 38
6. Percent change from pre- to post-expansion in total revenues for athletic departments... 39 7. Percent change from pre- to post-expansion in total revenues for athletic departments at institutions joining the ACC during the expansion... 40 8. Total athletic department revenues for the ACC pre- and post-expansion... 41
9. Percent change from pre- to post-expansion in total expenses for athletic departments... 43 10. Percent change from pre- to post-expansion in total expenses for athletic departments joining the ACC during the expansion... 44 11. Percent change in football winning percentages pre- and post-expansion... 46
12. Percent change in football winning percentages pre- and post-expansion for institutions joining the ACC during the expansion... 46 13. ACC non-conference winning percentage pre- and post-expansion... 47 14. Percent change in men’s basketball winning percentages pre- and post-
expansion...
48 15. Percent change in men’s basketball winning percentages pre- and post-
expansion for institutions joining the ACC during the expansion...
49 16. ACC non-conference football winning percentages pre- and post-
expansion...
17. CBS Basketball Fund total units earned by the ACC pre- and post-
expansion...
50 18. CBS Basketball Fund units earned by the ACC per year... 51 19. Percent of ACC member institutions attending a football bowl game
per year...
52 20. Percent change in U.S. Sports Academy Directors’ Cup total points pre-
and post-expansion...
53 21. Percent change in U.S. Sports Academy Directors’ Cup total points pre-
and post-expansion for institutions joining the ACC during expansion...
CHAPTER I INTRODUCTION
Conference affiliations amongst National Collegiate Athletic Association (NCAA) institutions have been utilized as a means of competition, governance, and financial gains. The Atlantic Coast Conference (ACC) has earned a reputation as one of the most competitive and strongest intercollegiate athletic conference (ACC Football Media Guide, 2006).
The ACC was conceived in 1953 near Greensboro, North Carolina. At this time there were seven charter members – Clemson University, Duke University, the University of North Carolina at Chapel Hill (UNC), North Carolina State University (N.C. State), Wake Forest University, the University of Maryland, and the University of South Carolina. These seven charter members withdrew from the Southern Conference on May 8, 1953 and met on June 14, 1953 in Raleigh, North Carolina to create and adopt bylaws as well as to name the newly formed conference the Atlantic Coast Conference (ACC). At the conclusion of this meeting, each member institution was given $200 for conference expenses (ACC Football Media Guide, 2006).
members for the next 13 years, until Florida State University joined on July 1, 1991 and at nine members for another 13 years until the University of Miami and Virginia Polytechnic Institute and State University (Virginia Tech) joined on July 1, 2004. The following year, 2005, brought the most recent expansion of the ACC with the addition of Boston College on July 1 making the ACC membership an even dozen (ACC Football Media Guide, 2006).
The 2005-06 academic year was the first official year the ACC was a 12-member conference. Not only did expansion bring new schools but it also brought new opportunity to the ACC. Some of the most noticeable changes included subdividing for scheduling in selected sports and the first ACC Football Championship Game held in Jacksonville, Florida. Geographically, the ACC spanned almost the entire East Coast expanding the league’s
exposure. Television and radio contracts had to be expanded as well to meet the new markets (ACC 2005-06 Annual Report, 2005).
The ACC’s expansion to 12 members has indeed provided growth for the conference collectively. This study will seek to examine the specific goals and motivations for the expansion and analyze how the conference has been affected collectively by the expansion.
Statement of Purpose
The purpose of this study was to evaluate the performance and finances of the ACC membership before and after the expansion of 2004-05. Pre- and post-expansion
performance and finances were studied for the conference collectively but also each individual institution when appropriate.
3
comparison of the statistical parameters pre- and post-expansion. The ACC expanded during the 2004-05 school year, so the parameters will be analyzed for the three years prior and three years post-expansion. The parameters to be analyzed include revenues/expenses, winning percentage (football and basketball), conference championship earnings from the CBS Basketball Fund and Bowl Championship Series, U.S. Sports Academy Directors’ Cup rankings, and television appearances.
Research Questions
1 What were the motives/goals of the ACC leadership in expanding to 12 in 2004-05? 2 Are there differences between the pre-expansion ACC and the post-expansion ACC in the
following areas:
a) Percentage change in revenues of Olympic and Non-Olympic Sports for the conference pre- and post-expansion,
b) Percentage change in expenses of Olympic and Non-Olympic Sports for the conference pre- and post-expansion,
c) Percentage change in revenues for the conference pre- and post-expansion,
d) Percentage change in individual institutional athletic department revenues for the nine pre-expansion members of the ACC pre- and post-expansion,
e) Percentage change in individual institutional athletic department revenues for the three expansion teams (Virginia Tech, Boston College, Miami) pre- and post-expansion,
g) Percentage change in individual institutional athletic department expenses for the nine pre-expansion members of the ACC pre- and post-expansion,
h) Percentage change in individual institutional athletic department expenses for the three expansion teams (Virginia Tech, Boston College, Miami) pre- and post-expansion,
i) Winning percentages in football and basketball for each pre-expansion ACC member institution for each year analyzed,
j) Winning percentages in football and basketball for each of the three ACC expansion institution (Virginia Tech, Boston College, Miami) for each year analyzed,
k) NCAA CBS Basketball Fund units earned by the conference as a whole for each year analyzed,
l) Percentage of football bowl appearances by the ACC for each year analyzed, m) U.S. Sports Academy Directors’ Cup total points for each pre-expansion ACC
member institution for each year analyzed,
n) U.S. Sports Academy Directors’ Cup rankings for each ACC expansion institution (Virginia Tech, Boston College, Miami) for each year analyzed, and
o) Television contracts before and after the expansion.
5
Definition of Terms
ACC Expansion Institutions – The three institutions that joined the ACC during the
expansion (Boston College, the University of Miami, and Virginia Polytechnic Institute and State University).
ACC Leadership – The collective group consisting of John Swofford, Bernadette McGlade, Jeff Elliott, Davis Whitfield, and Amy Yakola.
Athletic Department Revenues and Expenses – Revenues and expenses were evaluated as total numbers for the institution’s athletic department as reported in the EADA report. Bowl Championship Series (BCS) – The BCS consists of a rating index for six football conferences (Pac-10, SEC, Big Ten, Big 12, Big East, and the ACC) that determines a
national champion. Each bowl game involves a payout that greatly benefits each conference. Brand – According to the Merriam Webster Dictionary (2007), brand refers to a class of goods identified by name as the product of a single firm or manufacturer. Brands enhance the marketability of a product and in the case of this study, brand will refer to the perception of the conference including each individual institution.
CBS Basketball Fund – Money distributed each year to teams participating in the NCAA Bowl Sub-Division men’s basketball tournament. Amounts are distributed over a six-year rolling period and are based upon wins in the tournament. Each institution is awarded a unit for each game in which they participate except for the championship game.
Goals and Motives – Goals for this study were defined as what the ACC leadership sought to accomplish by expanding to a 12 team conference and motives will be defined as anything ACC officials felt ignited this desire to expand.
Identity – The Merriam Webster Dictionary (2007) defines identity as the distinguishing character or personality of an individual. For the purpose of this study, identity will be defined as the character of the conference collectively, which is impacted by the identity of each individual institution.
National Collegiate Athletic Association (NCAA) – The NCAA is a voluntary membership organization that serves to govern intercollegiate athletics.
NCAA CBS Basketball Fund Unit – Every game won in the NCAA men’s basketball
tournament earns a team one unit which is worth a specified amount each year that is paid to the conference to which the institution belongs. Units are worth a specific amount each year (e.g., a unit awarded form the 2006-07 tournament was worth approximately $177,000) (2006-07 Revenue Distribution Plan, n.d.). Conferences are not required to divide the money equally amongst its institutions but this is a practice of the ACC.
Non-Olympic Sports – Revenue producing sports: Football and Men’s Basketball
Olympic Sports – Non-revenue producing sports including: Baseball, Women’s Basketball, Cross Country, Field Hockey, Golf, Lacrosse, Rowing, Soccer, Softball, Swimming/Diving, Tennis, Track and Field, Volleyball, and Wrestling.
7
U.S. Sports Academy Directors’ Cup Ranking – The final yearly ranking of Division I institution’s athletics program based on the performance of 10 men and 10 women’s sports. The Directors’ Cup began as a joint effort of USA Today and the National Association of College Directors of Athletics.
Assumptions
1. Interviews were conducted with the assumption of honesty in answers received. 2. Revenues and expenses were assumed to be determined by the same standard for each
institution.
3. The EADA report represents figures accurately reported by each institution.
Delimitations
1. This study is delimited to the institutions that comprise the Atlantic Coast Conference three years prior and three years post the 2004-05 expansion to 12 teams (North Carolina State University, the University of North Carolina at Chapel Hill, Duke University, Wake Forest University, the University of Maryland, Georgia Tech, Florida State University, Clemson University, the University of Virginia and the expansion teams of Boston College, the University of Miami, and Virginia Tech University).
2. Statistical data were gathered from institutional publications, conference publications, EADA reports, and personal interviews with ACC leadership.
Limitations
1. Revenues and expenses were gathered from the public EADA reports. The manner in which institutions report these figures varies depending on accounting style and the variance in what an institution includes in its budget. There is not a standard for reporting these figures and the composition of each institution’s budget can be drastically different.
2. Revenues, expenses, and winning percentage figures were analyzed assuming all other factors are equal. Changes in economy, coaches, players, facilities, and any other contributing factors were not taken into account.
3. Interviews were conducted with the trust that honest answers were received.
Significance of the Study
With each passing year of athletics it appears that a trend has emerged of conference restructuring. A conference reduces in size or expands depending on the climate of college athletics. When one conference shrinks or expands, it most likely will affect at least one other conference. The ACC’s expansion was not sparked by a loss of members, but instead, was a simple expansion from 9 to 12. Conference restructuring is inevitable and the
reputation of the ACC creates an ideal situation to study the motives, goals, and results of conference expansion. These findings may help other institutions and conference
CHAPTER II
REVIEW OF LITERATURE
Conference Expansions
Expansion was not a new idea created by the ACC in 2003. NCAA conferences have changed, expanded, and reconfigured since the very first Bowl Subdivision (formerly
Division I-A) conference was formed in 1895 (Volume high, 2003). From the span of 1990 to 2003, every Bowl Subdivision conference has changed membership except for the Pacific 10 Conference (Pac-10) (Rosenburg, 2003). In May of 1990 the Southeastern Conference (SEC) voted to begin expansion discussions and later that year both the University of South Carolina and Arkansas University accepted invitations to make the SEC a 12-member league. Amidst the expansion of the SEC, the Big Ten Conference (Big Ten) expanded to make Pennsylvania State University (Penn State) its 11th member. This was just the beginning of a decade-long series of movements amongst conferences (I-A, 2003).
membership invitation to the University of Akron, and the ACC invited Florida State University to become its ninth member (I-A, 2003).
Expansion continued in 1994 with the Big 8 Conference and four Southwest
Conference schools combining to form the Big 12 Conference. The WAC followed in 1994 with the addition of Rice University, Southern Methodist University, and Texas Christian University from the Southwest Conference; San Jose State and University of Nevada Las Vegas (UNLV) from the Big West Conference; and the University of Tulsa who was formerly independent. Conference USA was formed in 1995 with the University of Cincinnati, the University of Louisville, the University of Memphis, the University of
Southern Mississippi, Tulane University, and the University of Houston. One year later East Carolina University joined Conference USA followed by the United States Military
Academy (Army) in 1998 (I-A, 2003).
With the rapid conference expansions taking place in college athletics, the SEC became the first conference to sponsor a football championship between divisions. After becoming a 12-member league, the SEC decided in November of 1990 to divide the league into two six-team divisions for football beginning in the 1992 season. The Big 12 and the WAC followed suit in 1996 with inaugural championship football games, and the MAC conducted a championship game in 1997 (I-A, 2003).
The Mountain West Conference (MWC) was formed in 1999 when eight schools (the U.S. Air Force Academy, Brigham Young University, Colorado State University, the
11
of Nevada and Boise State University from the Big West Conference and Louisiana Tech University who at the time was independent (I-A, 2003).
Conference USA invited Texas Christian University (previous WAC member) to join in 2001 and the University of South Florida, who was a member in other sports, to become a full member, including football, in 2003. The Metro-Atlantic Athletic Conference (MEAC) added football independent University of Central Florida in 2001 to bring its membership to 14. The Sun Belt Conference then invited several football independents (University of Louisiana-Lafayette, University of Louisiana-Monroe, and Middle Tennessee State University) as well as Big West Conference football members Arkansas State University, University of Idaho, New Mexico State University, and University of North Texas to combine to form a new league beginning in 2001. Later, in 2002, the Sun Belt Conference invited Utah State University to join for football, which would bring their membership to eight (I-A, 2003).
The most recent domino effect of conference shifting began in 1990 with the SEC and continues even today. Conference change has been present since the conception of collegiate conferences. Conferences continually adjust and shift in order to sustain themselves in the changing world of athletics. If a conference sits idle and does not make adjustments, then it is bound to dissolve.
Motivation for Expansion
conference to closely examine which institutions will constitute its membership but also vital that each institution examine in which conference it will benefit the most.
Trail (2000) and Chelladurai (2000) identified 10 different goals of intercollegiate athletics. Four of those goals (University visibility and prestige, financial security, winning, and entertainment) will be analyzed in this study as components of expansion effects. University visibility/prestige will be translated in this study to the brand and identity of conferences. Financial security will be analyzed through revenues and expenses, winning will be evaluated through winning percentages, and entertainment will translate to the value of the ACC in the marketplace, competitiveness as well as television contracts. Since conference membership is designed to enhance athletics, then the goals of intercollegiate athletics may also be the goals of conference affiliation.
A study by John Erck (2004) examined measurable parameters of institutions that had gone through a change in conference affiliation since 1990. The parameters Erck examined were ones he considered to reflect athletic, economic, and academic success. Overall, Erck found that the eight schools that had an affiliation change won fewer games in football and men’s basketball after the affiliation change. This decrease in athletic success is contributed to the goals of the institutions in changing conferences. Instead of switching conference affiliation solely for athletic success, the institutions Erck studied switched to increase their visibility.
13
best opponents” (Erck, 2004, 45). Changing conference affiliation for the institutions studied appears to be an overall success. Even if it was a success for the institutions, it will be vital to examine if it was a success for the conference collectively.
Competitive Balance
It has been suggested that conference design and affiliation is truly a business structure. The design of sports leagues and conferences is reexamined by Kahn (2003). Kahn suggests that leagues/conferences are an interesting industry because the competition amongst businesses/teams in the industry/league is the product sold. The organization and design of such industries/leagues can enhance the quality of entertainment which can
enhance consumer welfare. A well-balanced league may be more beneficial than one that is imbalanced because in this case the industry’s product declines. The division of the NCAA into I-A, I-AA, and I-AAA (now Bowl Subdivision, Championship Subdivision and Division I Non-Football respectively) may possibly have increased quality in the top I-A division. Kahn suggests that even though schools were eliminated when the NCAA was divided, the gains by fans in I-A outweigh the losses to fans of teams not allowed into the I-A division. The division of teams amongst I-A, I-AA, and I-AAA is similar to the various conference realignments that occur (Kahn, 2003).
realignment of a conference will affect the competitive balance of several other conferences in the NCAA. The effects can be felt across the NCAA in that particular division.
The Western Athletic Conference (WAC) and Mountain West Conference (MWC) were studied by Rhoads (2004) because since the WAC’s inception in 1962, it has undergone six realignments with one resulting in a new conference – the MWC. Rhoads studied
football and basketball regular season conference standings for each year of the conference in order to derive competitive balance data. After statistically analyzing the data, Rhodes suggests that when only considering football and basketball, the conference alignments in the history of the WAC/MWC have a significant effect on the competitive balance for these two sports. The study goes on to note that there is no significant relationship between the
drawing potential of basketball and the competitive balance in football. There is a one-way relationship from football to basketball. Rhoads states that “a marginal improvement in competitive balance in football has about half the impact of a marginal improvement in basketball due to the one-way impact across sports” (Rhoads, 2004, 16). The statistical analysis also suggests that conference realignments do not affect the competitive balance of football and that the realignments that have occurred in the WAC/MWC since its creation have been promoted by football. The study of the WAC/MWC gives great reasoning behind realignments in conferences and demonstrates possible impacts of such realignments
(Rhoads, 2004).
The uncertainty of outcome hypothesis (UOH) states that monopolized on-field success can negatively affect the well being of a league as well as the institution
15
conference due to the inability to benefit the conference or they may leave on their on will to join a conference with schools of similar strength. To support the UOH, it is highlighted that there is a positive relationship between competitive balance and aggregate attendance
(Depken, 2005).
Depken (2005) tested the UOH in Division I-A college football by analyzing 19 football conference season attendance totals for the years 1978 through 2004. After statistical analysis one conclusion made was that those in the Big Six conferences usually have half a million more in attendance than do the smaller conferences which supports the fact that the teams with the largest stadiums and the greatest popularity are amongst the Big Six. The study suggests that conference realignment can be beneficial to both a conference that expands and a conference that contracts due to the effect of competitive balance on attendance. When aligning a conference it has been shown that competitive balance can impact attendance in either a positive or negative manner. Finding that competitive balance is a major key to possibly increasing game attendance, which is a major factor for both a conference and an institution to take into account when considering realignment (Depken, 2005).
Revenues
The desire to increase revenue is often linked to other motivators for many
basketball with very few close games, the University of Arkansas hoped to increase ticket revenue. During the SWC tournament, the University of Arkansas’ ticket allotment was 11,000 but demand was not great. For the first SEC tournament in which they participated, the University of Arkansas was allotted 2,100 tickets but the fan demand was so great that fans managed to obtain 6,000 additional tickets for the tournament. Waddell (1992) also reported that road attendance for the University of Arkansas increased from 8,827 in 1991 to 12,881 in the SEC in 1992. The University of South Carolina sought to add prestige by joining the SEC and the hope of improving financial contributions due to the new affiliation (Waddell, 1992).
Television and ticket revenue are only two components of revenues that are increased by the ability to conduct championships and tournaments. Conference expansion to 12 members is significant because NCAA rules [Bylaw 17.11.5.2-(c)] allow a Division I
football conference with 12 or more members to split into divisions and hold a championship game that does not count towards the regular-season limit (Brown, 2003). The SEC’s
decision to expand to 12 was significant in that no other conference existed (Expansion, 1990). In 2004, the SEC’s football title game generated $12.5 million dollars in revenue after expenses, which was divided amongst its members (Wolverton, 2005).
17
Adding a football championship game as well as three new television markets could prove very profitable for the ACC and was a major influence in their decision to expand. Before expanding, the ACC predicted a championship football game would contribute $7 million dollars to the conference as well as an increased television contract for football. In 2003, the ACC’s deals with ABC and ESPN were worth $25 million per year and were due to expire in 2005, which was also the year for the first expansion was to occur (the addition of the University of Miami and Virginia Tech came a year before Boston College joined the ACC). Prior to expansion, it was hoped that the ABC/ESPN contract could be doubled (Starkey, 2003).
Not only is a conference championship a money-maker but by expanding, if a conference can gain even one more appearance in the Bowl Championship Series (BCS), then as of 2003, a conference could gain an additional $5 million dollars. BCS revenue possibility was a motivation for the ACC to expand in 2003 as was the renewal of the BCS television contracts in 2006. By gaining more BCS games, the ACC’s share of the TV contract was thought to rise by several million (Hyman, 2003).
Identity
Identity and reputation also influences conference membership and expansion. The University of Texas at Austin left the Southwest Conference and joined the Big 12
Isomorphism is a theory that involves segments of a population to liken each other due to similar environmental circumstances (Ashley & Cunningham, 2001). The study conducted by Ashley and Cunningham sought to examine this theory in athletic departments. The results from this analysis can also be applied to conferences due to similar situations. One key finding is that the items that traditionally influenced the structure and process of an athletic department such as alumni/NCAA pressure, professionalism among key managers, and competition for available resources are no longer key factors; instead, the choices that prominent figures in the athletic department make now play a bigger role. The results of the study also suggest that athletic directors make choices that guide their athletic department in a similar way as other athletic departments which will lead to what Cunningham (2001) and Ashley (2001) term “organizational inertia.”
The effects of isomorphism amongst athletic departments can be said to be an influencing factor in conference decisions. As Covell (2002) demonstrated, schools in the New England Small College Athletic Conference (NESCAC) were very similar in terms of how their athletic department operated and what each institution believed was the purpose of the conference. For this reason a conference may tend to promote isomorphism in order to create a group of institutions with similar goals which will allow the conference to reach its goals and mission. Isomorphism will be an important theory to take into account when analyzing conference choices and realignment (Ashley & Cunningham, 2001).
19
management, marketing and promotion, corporate sponsorships, and a myriad of other areas that are so essential to the lifeblood of the university (Suggs, 2003, ¶ 9).” This evidence of visibility attracting money through championships and television contracts has enhanced the desire for affiliation with a strong conference. The more visible an institution is in the media, the more they believe they will benefit from increasing television contracts, championship payouts, and donor support.
The Connection
It is suggested by Won (2004) that the results of conference expansion are intertwined for each institution. His study determined that intangible resources (athletic reputation) heightened the production of tangible resources (human resource, financial resources), which increased the likelihood of reaching athletic performance goals (Directors’ Cup scores) and athletic development goals (graduation rates and gender equity) (Won, 2004).
Smart (2004) and Wolfe (2004) also highlight the connection between intangible and tangible resources, which when increased can improve competitive advantage. Not only do intangible and tangible resources improve competitive advantage, but Karlgaard (2005) also demonstrated that quality institutions (determined from institutional national ranking and percentage of freshmen admits in the top 10% of their high school graduating class) created improved competitive success (Directors’ Cup Rankings).
Atlantic Coast Conference Expansion
Conference expansion for the Atlantic Coast Conference (ACC) was neither a smooth process nor a quick decision. ACC presidents considered expansion due to the changing conference memberships that occurred in the 1990s (“Office”, 2003). According to Wake Forest University President Thomas K. Hearn, Jr. the ACC developed a Committee on Strategic Planning with representation from all ACC member institutions which studied expansion for two years. Expansion as well as not changing the ACC membership was both options the committee explored. Possible members were studied and a profile of their academic data, athletic compliance records, graduation rates, Title IX issues, and athletic competitiveness was compiled. Each profile was studied and compared to the requirements of the ACC as well as the present culture of the conference. The committee eventually recommended the conference expand and identified three possible candidates: Boston College, the University of Miami, and Syracuse University. In June of 2003 the plan for expansion was to begin formal discussions with the University of Miami, Boston College, and Syracuse University. These institutions would join in 2005 and allow the ACC to create divisions. The conference voted to expand one month earlier on May 13 and on May 17 the conference institutions voted to begin formal discussions with these schools (Evans Moyer, 2003). Site visits and presidential conferrals were then conducted (“Office”, 2003).
Member institutions of the ACC did not automatically support the expansion and the University of Virginia felt pressure from its state legislature and Governor Mark Warner to push for Virginia Tech to be included in the expansion. According to the ACC Constitution and Bylaws, the conference needed seven current member institutions to vote for the
21
expansion according to Hayes. If Virginia Tech was not invited and the University of Virginia did not support the expansion, then the ACC would not have enough votes for expansion. The ACC had little choice because according to Hayes (2003), if the ACC had not expanded, then Florida State University would have begun considering other conference affiliations (Hayes, 2003). CEO Dean Bonham of The Bonham Group, a Denver-based consulting company that assisted the ACC in the expansion decision process said, “The ACC had an opportunity to do one of two things – take a step forward or take a step backwards. It could have lost revenue, fans, and sponsors (Roush, 2004, ¶ 12).
According to various media sources, revenues and identity are two major results of the ACC’s expansion to 12 members. The mark or footprint of the ACC now stretches from Boston to Miami which widens the media markets of the conference. By widening the market, the exposure of the ACC stretches further. The increased exposure of the ACC leads to more markets as well as more alumni and fans who can contribute money to ACC
institutions.
CHAPTER III METHODOLOGY
Data Collection
Quantitative data for revenues, expenses, winning percentages, NCAA Basketball Fund units, bowl appearance, U.S. Sports Academy Directors’ Cup Rankings, and television contracts were collected through EADA reports, media guides, institutional internet sites, and personal interviews. Current EADA reports were retrieved from The Office of
Postsecondary Education’s (OPE) website while past reports were collected from the archives located on the OPE’s website. Data concerning the ACC leadership’s motive and goals was retrieved through personal interviews.
Subjects
The ACC expansion was evaluated in this study. Greensboro, North Carolina is the home of the conference office and an on-site visit was conducted in December 2007,
of the conference prior to expansion, the decision to expand, and condition of the conference since expansion.
Quantitative measures will examine data from each of the member institutions of the ACC including those added during the expansion. UNC, Duke, N.C. State, Wake Forest, Clemson, Georgia Tech, Florida State, University of Virginia, and University of Maryland comprise the member institutions of the ACC prior to the expansion, and Boston College, University of Miami, and Virginia Tech comprise the institutions added during the expansion.
Instrumentation
The EADA report was utilized for 2006-07 financial information while past information were gathered from EADA reports archived onThe Office for Postsecondary Education’s website for the following criteria:
• Percentage change in revenues of Olympic and Non-Olympic sports for the
conference pre- and post-expansion,
• Percentage change in expenses of Olympic and Non-Olympic sports for the
conference pre- and post-expansion,
• Percentage change in revenues for the conference pre- and post-expansion,
• Percentage change in individual institutional athletic department revenues for the nine
pre-expansion members of the ACC pre- and post-expansion,
• Percentage change in individual institutional athletic department revenues for the
25
• Percentage change in expenses for the conference pre- and post-expansion,
• Percentage change in individual institutional athletic department expenses for the nine
pre-expansion members of the ACC pre- and post-expansion,
• Percentage change in individual institutional athletic department expenses for the
three expansion teams (Virginia Tech, Boston College, Miami) pre- and post-expansion,
Institutional data was retrieved from media guides as well as institutional athletic department, conference and NCAA internet sites for these criteria:
• Winning percentages in football and men’s basketball for each pre-expansion ACC
member institution for each year analyzed,
• Winning percentages in football and men’s basketball for each of the three ACC
expansion institutions (Virginia Tech, Boston College, Miami) for each year analyzed,
• NCAA Men’s CBS Basketball Fund units earned by the conference collectively for
each year analyzed,
• Percentage of football bowl appearances by the ACC conference as a whole for each
year analyzed,
• U.S. Sports Academy Directors’ Cup rankings for each pre-expansion ACC member
institution for each year analyzed, and
• U.S. Sports Academy Directors’ Cup rankings for each ACC expansion member
To determine motives and goals for expansion, this study completed two on-site visits to the ACC office in Greensboro, North Carolina. Personal interviews with John Swofford (Commissioner), Bernadette McGlade (Associate Commissioner-Women’s Basketball), Davis Whitfield (Assistant Commissioner-Championships), Jeff Elliott (Associate Finance and Administration), and Amy Yakola (Assistant Commissioner-Public Relations and Marketing) took place in December 2007 to delve further into the expansion process. Questions for the interviews were derived prior to the interview and all five interviews were conducted in-person. A set of questions were uniform for all five subjects as well as specific questions associated with each person’s role in the expansion. The Institutional Review Board of the University of North Carolina at Chapel Hill approved the interviews and questions prior to the interviews.
Procedures
After financial data was gathered, descriptive statistics were used to compare the difference between the pre-expansion and post-expansion ACC. With the data collected from the population of the ACC, percent changes were calculated to determine differences in pre-and post-expansion values. The results of the comparisons were then used to determine results of the expansion and whether these results or effects met any of the expansion goals of the ACC leadership as identified in the interviews.
CHAPTER IV RESULTS
The two major areas of study were the motives and goals of the ACC as well as statistical data pre- and post-expansion. Results will be articulated beginning with what motivated the ACC membership to expand as well as the goals they formulated for the expansion. Statistical data will then be reported and full data sets are located in the
Appendices. After reporting statistical data, the opinion of the ACC’s leadership on whether or not they have met any of these goals will be presented with statistical support when possible.
Motives for Expansion
During interviews with the ACC leadership, each administrator was asked to identify motives for the expansion as well as any goals they could articulate that were set by the conference. Three major motives were identified: 1) the desire to maintain position in the changing environment of athletics while at the same time being proactive, 2) the influence of the ACC in the realm of collegiate athletics, and 3) competitive advantage.
I very much encouraged our schools that that determination needed to be a proactive one. And the other factor that was involved, quite frankly, there was a lot of
conversations about expansion at other places at that point in time and of the concerns that we had if we didn’t take this proactive analysis was that we may not have opportunities to bring in schools we would want when we did want to expand if we did not go ahead and move with some time sensitivity. (John Swofford, personal communication, December 10, 2007)
McGlade, Swofford, Elliott, Whitfield, and Yakola all enforced the point that the ACC membership did not want to be caught in a situation where they were forced to make changes (personal communication, December 10 and 11, 2007). Swofford indicated that the process began as an evaluation to determine if expansion was even necessary and that “we [the ACC membership] needed to be proactive in our determination as to whether we would or we wouldn’t [expand]” (personal communication, December 10, 2007).
Collegiate athletics is an ever-changing landscape and Swofford emphasized the point that “the important thing was that we [the ACC membership] be proactive in making that determination and evaluating where we were and what we thought that would mean in the future landscape of major college athletics.” Change is not always easy but as Amy Yakola stated “...change is inevitable. The question is, ‘Are you going to be proactive in your change or are you going to be reactive?’” (personal communication, December 10, 2007).
Influence of the ACC was important not only in the realm of athletic competition but also within NCAA governance. Bernadette McGlade emphasized the geography of the conference:
29
Swofford emphasized the presence of the ACC within the NCAA and its influence in the decision to expand:
In the area of influence from the NCAA it became more and more obvious to us that some of the larger conferences, the ones in the Big 12 that had 12 schools, that their influence within the NCAA structure was a little bit more significant than ours was and as time passed, there was a possibility. I’m not going to say a probability but a possibility that our influence would continue to dwindle in comparison to those in the NCAA as far as legislative impact is concerned in Division I athletics. (personal communication, December 10, 2007)
The influence of the ACC overall would contribute to the financial well-being of the conference as well. Jeff Elliott articulated this connection: “We felt like in our strategic planning that this was something that we really needed to do in order to stay at the highest level of both influence and financial matters...” The financial influence of the ACC would be enhanced by the possibility of an ACC championship football game. Obtaining 12 members to establish a football championship was not the sole reason of the expansion but an added bonus. Bernadette McGlade stated its importance well:
I don’t believe the leadership [ACC membership] in this conference would have done it at any cost… just to get the football championship. But, understanding that it made good sense and it’s a wonderful opportunity to be able to host a football
championship and have that be a part of the conference makeup… certainly was very much a positive on the plus side of the ledger. (personal communication, December 10, 2007)
McGlade, Swofford, Elliott, Davis, and Yakola all agreed and expressed that the expansion of the league in membership as well as exposure would create several new avenues to bring in revenue to the conference (personal communication, December 10 and 11, 2007).
“To me, it was two-fold. It was football, raising it to the level of our basketball, and it was television from the standpoint of obtaining access to the northeast market” (personal
communication, December 10, 2007). Increasing the level of football which would increase the marketability of the football championship would “raise the perceived level of football in the conference over time,” according to John Swofford (personal communication, December 10, 2007).
The ACC has always been known as a “basketball conference” but one hope with the expansion was to bring football to that level. According to Whitfield, one goal of the
expansion was to bring parity to football and bring it to “the level of basketball.” Swofford also agreed with the idea of enhancing football in the ACC. This was one reason the football championship game was created in hopes that an intangible result would be to raise the perception of football in the conference (personal communication, December 10, 2007).
Goals for Expansion
The overall goal of the Atlantic Coast Conference expansion according to John Swofford was:
To maintain our place as was one of the strongest major conferences in the country....That means leadership at the NCAA level, influence on legislation and other matters that have significance in intercollegiate levels nationally...means maintaining our place as a strong balance of academics and athletics which is what the league has really stood for more than anything else over the years...along with the general integrity of how the programs are operated within the league. (personal communication, December 10, 2007)
31
marketplace, 3) at least maintaining with the desire to increase revenues, 4) and maintaining the culture amongst the member institutions.
The branding of the conference was evident from Amy Yakola who commented, “I think branding...I mean the Atlantic Coast is...it’s our name and it’s been our name since 1953 so certainly the Atlantic coast just doesn’t go up to Maryland and down to Tallahassee” (personal communication, December 10, 2007). Swofford, Yakola, Whitfield, Davis and Elliott (personal communication, December 10 and 11, 2007) also agreed that one area in which the league was not suffering was academics but with the expansion they did not want academics to falter in any manner. When evaluating prospective expansion members, the ACC membership evaluated areas such as academic accreditation, commitment to a broad-based sports program, commitment to non-discriminatory policies, commitment to Title IX, history of NCAA infractions, the philosophical educational mission, and institution
leadership.
While improving the branding of the conference, the value of the conference in the marketplace would also hopefully increase. Value in the marketplace in this study is
Financially, the ACC membership’s desire for the expansion was to at least maintain revenue pay-outs per institution but hopefully increase them as well. By increasing
individual pay-outs, each individual institution would hope to increase athletic department revenues. Financial components definitely came into consideration when the ACC
membership made the decisions regarding how many and which institutions to add to the conference. Jeff Elliott reinforced this point when asked if it was important to bring the membership to 12:
Only because one of the key criteria in maintaining and exceeding our financial projection would be that the NCAA requires that you have 12 teams in order to be able to subdivide and have a football championship and that is a very sizable amount of increase for us that made a lot of stuff work. So we did some projections at 10 and we did projections at 11 but 12 was the only thing that really made sense for us financially. (personal communication, December 11, 2007)
Elliott as well as McGlade, Swofford, Yakola and Whitfield (personal communication, December 10 and 11, 2007) articulated that in the area of finances the league wanted to move forward and not regress. Financial studies and financial projections were conducted but as Elliott states: “We felt like in our strategic planning that this was something that we really needed to do in order to stay at the highest level of both influence and financial matters” (personal communication, December 11, 2007). In order for expansion to be successful the ACC membership took careful consideration into financial matters. Yakola (personal communication, December 10, 2007) stated it well: “We all know in the world we live in, you’ve got to be able to support however many sports you are going to sponsor and all those student-athletes, coaches, administrators, etc.”
33
We wanted to make certain that we maintained the culture of the league and by that I mean the relationships. One of the things that I think has differentiated the ACC from the other conferences over the years is a very strong sense of cooperation within the league and the ability to compete at the highest level athletically but to have the kind of trust and cooperation administratively within the conference with the AD’s, the presidents, the faculty representatives, to some degree the coaches...that that group of people could sit in a conference room and make decisions that are best for the
league...and one of the things we wanted to make certain that we didn’t lose with expansion was that kind of culture and that type of operating capability. (personal communication, December 10, 2007)
Yakola emphasized that culture in the sense of the way institutions do things within their organization was a criteria in selecting expansion members. Culture and the way the conference worked together was a key goal that McGlade, Elliott and Whitfield also mentioned (personal communication, December 10 and 11, 2007).
Statistical Results
After interviews were conducted, statistical data was gathered from EADA reports as well as institutional and NCAA internet sites. The data was gathered in order to determine if there are significant differences between the pre-expansion ACC (2001-2004) and the post-expansion ACC (2004-2007) in the following areas: Olympic sport revenues, Non-Olympic sport revenues, Olympic sport expenses, Non-Olympic sport expenses, revenues, expenses, football winning percentages, men’s basketball winning percentages, NCAA Men’s
Revenues of Olympic and Non-Olympic Sports for the ACC
Olympic sport revenues for the entire Atlantic Coast Conference increased 178.8 % from the three years prior to the expansion of 2004 to the three years post-expansion. Figure 1 represents this increase graphically. The total conference Olympic sport revenues prior to expansion were $40,178,724 and post expansion the total Olympic sport revenues for the conference were $112,027,702.
Non-Olympic sport revenues for the ACC jumped from a pre-expansion total of $563,794,983 to a post-expansion total of $911,523,125 (see Figure 2) for a percent change of 61.7%. Both Olympic and Non-Olympic sport revenues increased after the ACC
expansion but the Olympic sport revenues almost tripled, a notable increase in a relatively short period of time.
$0.00 $20,000,000.00 $40,000,000.00 $60,000,000.00 $80,000,000.00 $100,000,000.00 $120,000,000.00
Pre Post
U.S. Dollars
Conference Total
35
Figure 2. Non‐Olympic sport total revenues for the ACC pre‐ and post‐expansion.
$0.00 $100,000,000.00 $200,000,000.00 $300,000,000.00 $400,000,000.00 $500,000,000.00 $600,000,000.00 $700,000,000.00 $800,000,000.00 $900,000,000.00 $1,000,000,000.00
Pre Post
U.S. Dollars
Expenses of Olympic and Non-Olympic Sports for the ACC
Total Olympic sport expenses for the ACC pre-expansion were $212,505,937 while post-expansion expenses were $334,713,940 for a 57.7% increase. Non-Olympic expenses increased 128.8% post-expansion with an increase in expenses from approximately
$272,000,000 to approximately $624,000,000. Figure 3 represents the increase in Olympic sport expenses while Figure 4 represents the increase in Non-Olympic sport expenses.
To further analyze the effect of these increases, net profit/loss was calculated. Olympic sports reported a net loss of $172,327,213 pre-expansion and $222,686,328 post-expansion. Non-Olympic sports had a net gain of $291,794,983 pre-expansion and $287,523,125 post-expansion.
Figure 3. Olympic sport total expenses for the ACC pre‐and post‐expansion.
$0.00 $50,000,000.00 $100,000,000.00 $150,000,000.00 $200,000,000.00 $250,000,000.00 $300,000,000.00 $350,000,000.00 $400,000,000.00
Pre Post
U.S. Dollars
37
$0.00 $100,000,000.00 $200,000,000.00 $300,000,000.00 $400,000,000.00 $500,000,000.00 $600,000,000.00 $700,000,000.00
Pre Post
U.S. Dollars
Conference Total
Total Revenues for the ACC
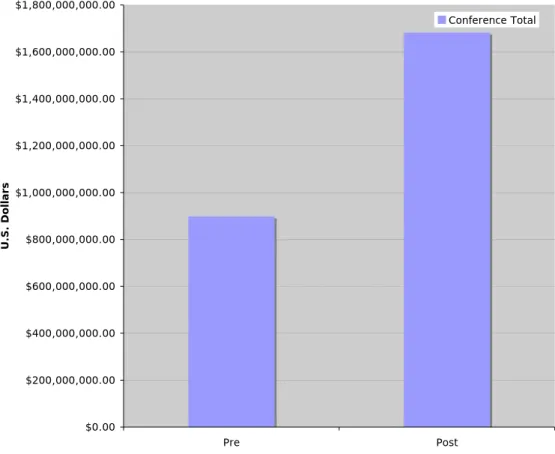
The ACC’s total revenues increased 87.3% post-expansion. Pre-expansion total revenues were $898,362,213 and post-expansion total revenues were $1,682,314,531 for the ACC collectively which can be seen in Figure 5.
Figure 5. Revenues for the ACC pre‐ and post‐expansion.
$0.00 $200,000,000.00 $400,000,000.00 $600,000,000.00 $800,000,000.00 $1,000,000,000.00 $1,200,000,000.00 $1,400,000,000.00 $1,600,000,000.00 $1,800,000,000.00
Pre Post
U.S. Dollars
39
Individual Institutional Athletic Department Total Revenues
Figure 6 demonstrates that the percent change in athletic department total revenues for the nine pre-expansion ACC member institutions was positive after the expansion of the conference in 2004. The range of increase spans from a percent change of 17.3% for Florida State University to 92% for the University of Virginia with a mean increase for the ACC pre-expansion institutions of 43.5%.
The three institutions that joined the ACC during the expansion have a percent change that ranges from 34.9% to 77.8% (see Figure 7). The average percent change for these three institutions is 52.2%.
Figure 6. Percent change from pre‐to post‐expansion in total revenues for athletic departments.
0.0% 10.0% 20.0% 30.0% 40.0% 50.0% 60.0% 70.0% 80.0% 90.0% 100.0%
Clemson Duke FL State Georgia
Tech Maryland NC State UNC Virginia Wake Forest
0.0% 10.0% 20.0% 30.0% 40.0% 50.0% 60.0% 70.0% 80.0% 90.0%
Boston College Miami Virgina Tech
Expansion Institution
Figure 7. Percent change from pre‐to post‐expansion in total revenues for athletic departments at
41
Total Expenses for the ACC
Total expenses for the ACC pre-expansion were $817,444,308. Although only three schools were added to the conference, Figure 8 reveals that expenses almost doubled, for a 98.8% change post-expansion for a total of $1,625,164,712 for the ACC collectively.
Since expenses increased, which is not necessarily a desired outcome for a business, data was further analyzed to determine net gain or net loss. Both pre- and post-expansion, the ACC recorded a net gain of $80,917,905 and $57,149,819 respectively. Even though both revenues and expenses increased, the conference collectively was able maintain a net gain.
$0.00 $200,000,000.00 $400,000,000.00 $600,000,000.00 $800,000,000.00 $1,000,000,000.00 $1,200,000,000.00 $1,400,000,000.00 $1,600,000,000.00 $1,800,000,000.00
Pre Post
U
.S. D
o
lla
rs
Conference Total
Individual Institutional Athletic Department Total Expenses
The percent change post-expansion for total expenses for the individual athletic departments who comprised the ACC prior to the expansion ranges from 21.5% for Georgia Tech to a high of 162.1% for Duke. The mean percent change for the ACC for individual athletic department total expenses is 57.7%. Figure 9 indicates that all schools encountered an increase.
The University of Miami, Boston College and Virginia Tech joined the ACC during the expansion of 2004 and encountered a percent change in total expenses of 38.5%, 32.9%, and 69.9 % respectively. These three expansion teams had an average of a 47.1% change in athletic department expenses with Virginia Tech encountering the largest increase according to Figure 10.
To further explain the financial state of the conference, the profit/loss margin was calculated for each institution pre- and post-expansion. The total financial profit margin prior to the expansion was positive for eight of the nine pre-expansion institutions. Georgia Institute of Technology was the only institution to report a loss prior to expansion
($1,471,244). Two of the three expansion institutions, Boston College and Miami, reported a loss pre-expansion ($2,013,778 and $1,384,551 respectively). All 12 institutions reported a profit post-expansion ranging from the University of Maryland reporting a profit of $26 to Virginia Tech with a profit of $21,150,068.
43
0.0% 20.0% 40.0% 60.0% 80.0% 100.0% 120.0% 140.0% 160.0% 180.0%
Clemson Duke FL State Georgia Tech
Maryland NC State UNC Virginia Wake Forest
Institution
0.0% 10.0% 20.0% 30.0% 40.0% 50.0% 60.0% 70.0% 80.0%
Boston College Miami Virgina Tech
Expansion Institution
Conference Total
Figure 10. Percent change from pre‐to post‐expansion in total expenses for athletic departments at
45
Winning Percentages in Football
The mean football winning percentage percent change for the pre-expansion members of the ACC after the expansion of 2004 is negative 9.5%. Four of the nine pre-expansion members had a negative percent change in winning percentages for all games. Figure 11 indicates Duke recorded the largest negative percent change at negative 48.5% while Georgia Tech recorded the largest positive percent change of 12 percent. Breaking football winning percentage down further to determine the winning percentage for the ACC in its
non-conference schedule, it is determined that the winning percentage of the ACC collectively in football for non-conference games decreased 7.2% after the expansion of 2004. Figure 13 indicates that the non-conference football winning percentage for the ACC pre-expansion was 64% and post-expansion was 59.4%.
Figure 11. Percent change in football winning percentages pre‐and post‐expansion. Clemson Duke FL State Georgia Tech Maryland NC State UNC Virginia Wake Forest -60.0% -50.0% -40.0% -30.0% -20.0% -10.0% 0.0% 10.0% 20.0% 30.0% Institution Boston College Miami Virgina Tech -30.0% -25.0% -20.0% -15.0% -10.0% -5.0% 0.0% 5.0% 10.0% 15.0% 20.0% Expansion Institution
Figure 12. Percent change in football winning percentages pre‐and post‐expansion for institutions joining the
47
57.0 58.0 59.0 60.0 61.0 62.0 63.0 64.0 65.0
ACC
Percen
t
Pre Post
Winning Percentages in Men’s Basketball
Overall, men’s basketball had a positive percent change in winning percentages after the expansion of 2004. The mean percent change of winning percentages for the nine pre-expansion members of the ACC was 7.9% with a range of negative 13.8% for Wake Forest University and an increase of 65.9 % for UNC (see Figure 14).
The three institutions that joined the ACC during the expansion had a mean percent change for men’s basketball winning percentages of 12.1%. Both Virginia Tech and Boston College had positive percent changes of 32.2% and 15.1% respectively while the University of Miami encountered a decrease of 11.1% as seen in Figure 15.
Looking solely at non-conference winning percentages, Figure 16 demonstrates that the ACC collectively had a positive percent change of 0.9% after the expansion. The collective non-conference winning percentage of the ACC in men’s basketball increased from 76.8% pre-expansion to 77.5% post-expansion.
49
Boston College
Miami
Virgina Tech
-15.0% -10.0% -5.0% 0.0% 5.0% 10.0% 15.0% 20.0% 25.0% 30.0% 35.0%
Expansion Institution
Figure 15. Percent change in men’s basketball winning percentages pre‐and post‐expansion for institutions
joining the ACC during the expansion.
Figure 16. ACC non‐conference football winning percentage pre‐and post‐expansion. 70.0
72.0 74.0 76.0 78.0
ACC
Winning P
e
rc
enta
ge
NCAA Men’s CBS Basketball Fund Units
Collectively, the ACC earned 40 units toward the CBS Basketball Fund pre-expansion and 38 units post-pre-expansion (see Figure 17). Figure 18 illustrates that year-by-year from 2001-02 through 2006-07 the conference earned 12, 9, 19, 15, 10, and 13 units respectively.
Figure 17. CBS Basketball Fund total units earned by the ACC pre‐and post‐expansion.
34 35 36 37 38 39 40 41 42
Units Earned by ACC
Uni
t
51
0 2 4 6 8 10 12 14 16 18 20
2001-02 2002-03 2003-04 2004-05 2005-06 2006-07
Academic Year
Earned Units
Football Bowl Appearances by the ACC
Figure 19 illustrates that the percentage of ACC members attending a football bowl game has fluctuated through the years. From 2001-02 through 2006-07 sixty-seven percent, 78%, 67%, 55%, 67%, and 67 % of the ACC member institutions attended a football bowl game. The lowest number of ACC teams to attend a bowl game in any given season has been six. Six out of nine members attended a bowl game in 2001-02 and 2003-04. Six out of 11 members attended a bowl game in 2004-05 which was the lowest percentage for the ACC at 55%. The final two years of analysis each had 8 out of 12 teams go to a bowl game for 67% while the highest percentage of ACC teams to attend a bowl game was 78% in 2002-03 when seven out of nine ACC teams went to a bowl game.
0.00% 10.00% 20.00% 30.00% 40.00% 50.00% 60.00% 70.00% 80.00% 90.00%
2001-02 2002-03 2003-04 2004-05 2005-06 2006-07
Year
Percent of ACC Institutions Attending A Bowl Game
53
U.S. Sports Academy Director’s Cup Total Points
For the nine pre-expansion ACC member institution’s Directors’ Cup total points pre- and post-expansion had a mean percent change of 14.31%. The range of percent change was a decrease of 6.77% for Clemson University and an increase of 46.74% for Duke University. Figure 20 demonstrates that the only other negative percent change occurred for Maryland who recorded a percent change of negative 1.20%.
The three teams added to the ACC during the expansion had a mean percent change of 47.9% pre- to post-expansion. Miami recorded the only negative percent change of negative 12.55% as depicted in Figure 21. Boston College recorded a positive percent change of 36.17% while Virginia Tech had a percent change of 120.30%. Virginia Tech earned 543 Directors’ Cup points pre-expansion (2001-04) and earned 1196.3 Directors’ Cup points post-expansion (2004-07).
Clemson
Duke
Georgia Tech
Maryland
NC State UNC
Virginia
Wake Forest FL State
-10.00% 0.00% 10.00% 20.00% 30.00% 40.00% 50.00%
Institution
Boston College
Miami
Virgina Tech
-20.00% 0.00% 20.00% 40.00% 60.00% 80.00% 100.00% 120.00% 140.00%
Expansion Institution
Television Contracts
Television contracts for the ACC were renewed in 2005 just after the expansion and are set to be renegotiated in 2012. The reported increase in the contract varied from my interviews. A definite figure could not be divulged but the increase was reported to be in between 20-30%.
Please reference the Appendices for complete data in the each of the above categories.
Figure 21. Percent change in U.S. Sports Academy Directors’ Cup total points pre‐ and post expansion for
55
Motives Realized
Have any of the motives that prompted the expansion of the ACC as well as the goals that were identified been realized? According to Swofford they have: “In terms of
measurable kinds of things in every instance the arrow is up” (personal communication, December 10, 2007).
Three motives were identified (maintain position in college athletics, increase
influence in NCAA, and competition) as well as four goals (to increase branding and identity, increase revenues, increase the value of the conference in the marketplace, and maintain the culture of the conference). It is evident that the three motives for expansion were factors in creating the goals set for expansion.
Amy Yakola noted the effect of branding on the conference as well as the institutions, “I think that branding-wise we have seen a lot of different opportunity to leverage being 12...we are much more diverse. We’ve got many more schools that are academically solid – it’s just been an enhancement all together” (personal communication, December 10, 2007). As was stated earlier, the name the Atlantic Coast Conference was indicative of what the conference should embody. After the expansion, McGlade states, “Now we are sort of really more indicative of what our name is. We are true to it...from Boston to Miami we’ve sort of got that whole Atlantic coast now which is part of our name” (personal communication, December 10, 2007).