STUDY DESIGN STRENGTH OF EVIDENCE AND LEVEL OF CLINICAL EFFICACY REPORTED IN THE CBCT SCIENTIFIC LITERATURE
Robert J. Timothy
A thesis submitted to the faculty at the University of North Carolina at Chapel Hill in partial fulfillment of the requirements for the degree of Masters of Science in the School of Dentistry
(Oral Radiology).
Chapel Hill 2015
iii
ABSTRACT
Robert J. Timothy: Study Design Strength of Evidence and Level of Clinical Efficacy Reported in the CBCT Scientific Literature
(Under the direction of Andre Mol)
Objective: To determine strength of evidence and level of efficacy for cone-beam computed tomography (CBCT) in dentistry. Scientific articles assessed by epidemiologic study design and level of efficacy. The following null-hypotheses were tested: 1: No temporal changes in study design and efficacy of CBCT literature from inception until June 2013. 2: No differences in study design and efficacy of scientific articles between clinical disciplines. 3: No differences in study design and efficacy between journals. 4. No differences in study design and efficacy between countries.
Methods: A PubMed search of English scientific dental literature regarding CBCT was conducted. Two evaluators independently assessed the selected articles.
Results: The number of articles published increased almost exponentially. An increase in efficacy over the time of this study was significant (P=0.04).
iv
v
TABLE OF CONTENTS
LIST OF FIGURES ... vii
LIST OF TABLES ... viii
LIST OF ABBREVIATIONS AND SYMBOLS ... x
INTRODUCTION ... 1
METHODS AND MATERIALS ... 10
Sample ... 10
Search Strategy ... 10
Article Classification ... 10
Data Analysis ... 13
RESULTS ... 15
Study Design and Efficacy Level ... 15
Clinical Disciplines ... 16
Journal of Publication... 17
Country of Corresponding Author ... 18
vi
Figures ... 33
DISCUSSION ... 45
APPENDIX 1 ... 53
APPENDIX 2 ... 56
APPENDIX 3 ... 58
APPENDIX 4 ... 61
vii
LIST OF FIGURES
Figure 1 Total number of CBCT papers published in dental journals between 2003 and 2013 ... 33
Figure 2 Percent of study designs per year between 2004 and 2013 ... 34
Figure 3 Plot of the means for study design over time ... 34
Figure 4 Percent of efficacy levels per year between 2003 and 2013 ... 35
Figure 5 Fixed plot of the means for efficacy level over time ... 35
Figure 6 Percent of articles by clinical discipline by year ... 36
Figure 7 Percent of articles by study design for each clinical discipline ... 37
Figure 8 Fixed plot of means for each clinical discipline by study design ... 38
Figure 9 Percent of articles by efficacy level for each clinical discipline ... 39
Figure 10 Fixed plot of means for each clinical discipline by efficacy level ... 40
Figure 11 Percent of articles by journal and by study design ... 41
Figure 12 Fixed plot of means for radiology journals and other journals by study design ... 42
Figure 13 Fixed plot of means for radiology journals and other journals by efficacy level ... 42
Figure 14 Percent of articles by country of corresponding author and study design ... 43
Figure 15 Percent of articles by country of corresponding author and efficacy level ... 43
Figure 16 Fixed plot of means for country by corresponding author by study design ... 44
viii
LIST OF TABLES
Table 1 Traditional Study Designs ... 20
Table 2 Hierarchical Model of Efficacy According to Fryback and Thornbury ... 20
Table 3 Study Design Codes ... 21
Table 4 Efficacy Level Codes ... 21
Table 5 Clinical Discipline Codes ... 21
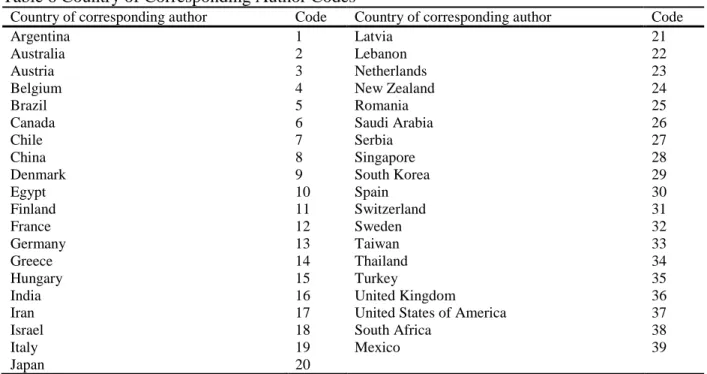
Table 6 Country of Corresponding Author Codes ... 22
Table 7 Number of Articles by Study Design by Year ... 22
Table 8 Weighted Linear Regression Analysis for Study Design ... 23
Table 9 Number of Articles by Efficacy Level by Year ... 23
Table 10 Weighted Linear Regression Analysis for Efficacy Levels ... 23
Table 11 Number of Articles by Clinical Discipline and Study Design ... 24
Table 12 Weighted Linear Regression Analysis for Clinical Discipline by Study Design ... 24
Table 13 ANCOVA Pairwise Least Square Means Analysis ... 25
Table 14 Number of Articles by Clinical Discipline and by Efficacy Level ... 26
Table 15 Weighted Linear Regression Analysis by Clinical Discipline... 26
Table 16 ANCOVA Pairwise Least Square Means Analysis ... 27
Table 17 Number of Articles by Study Design Between Radiology Journals ... 28
Table 18 Weighted Linear Analyses by Journal and by Study Design... 28
Table 19 Number of Articles by Efficacy Level between Radiology Journals ... 29
Table 20 Weighted Linear Analyses by Journal and by Efficacy Level ... 30
Table 21 Number of Articles by Country of Corresponding Author and Study Design ... 30
ix
x
LIST OF ABBREVIATIONS AND SYMBOLS
2D Two-Dimensional
3D Three-Dimensional
ADA The American Dental Association CBCT Cone-beam Computed Tomography CBVT Cone-beam Volumetric Tomography
CT Computed Tomography
DMFR Dentomaxillofacial Radiology
Euratom European Atomic Energy Community N/A Not Applicable
OMFR Oral Maxillofacial Radiology OMR Oral and Maxillofacial Radiology OMS Oral Maxillofacial Surgery
OOOOE Oral Surgery, Oral Medicine, Oral Pathology, Oral Radiology and Endodontics PDF Portable Document Format
RCT Randomized Clinical Trials
UK United Kingdom
1
INTRODUCTION
Dentists are continually making clinical decisions that affect the health of their patients, including diagnostic decisions and treatment decisions. While the scientific basis for current practice has dramatically expanded in the past decades, clinical decisions are not always based on best available evidence. Instead, the influence of information based on unverified and
potentially biased sources, including expert opinion, non-refereed journals and product literature, remains ubiquitous. A gradual shift has taken place over the past two decades to incorporate best available evidence in the practice of medicine and dentistry. The term evidence–based medicine first appeared in a publication in the early 1990’s and is now widely used in many different health related fields, including dentistry1. The American Dental Association (ADA) developed the following definition for the term evidence-based dentistry: “an approach to oral health care that requires the judicious integration of systematic assessments of clinically relevant scientific evidence, relating to the patient’s oral and medical condition and history, with the dentist’s clinical expertise and the patient’s treatment needs and preferences”2
2
necessary to make an appraisal of the scientific literature3-8. This series was followed up more recently with another series of articles entitled “A practical approach to evidence-based
dentistry” introducing evidence based dentistry and explaining how to appraise the evidence and use it in clinical decisions9-12.
While the practice of evidence-based dentistry appears commonsense, its adoption has not been without dispute. The lack of sound scientific studies and the limited generalizability of studies to specific patient scenarios are often quoted as barriers in the implementation of
3
collective undesirable components associated with a procedure, including but not limited to monetary costs, morbidity and mortality.
In radiology, a decision to perform a diagnostic imaging procedure requires that the expected benefits of the images outweigh their costs. While the financial burden of advanced imaging procedures should not be underestimated, most attention on the costs of radiological procedures is focused on the risks associated with exposure to ionizing radiation. To this end the European Atomic Energy Community (Euratom) published evidence-based guidelines for cone beam CT for Dental and Maxillofacial Radiology14. These risks can be calculated fairly
precisely and can be compared to other types of risks experienced on a day-to-day basis. The benefits of an imaging procedure often appear self-evident; however, limitations in sensitivity and specificity, the potential impact of the imaging procedure on different levels of outcome and the values associated with correct or incorrect test results represent a formidable challenge for the clinician. The decision-making process is further complicated by the rapid advancements in imaging technology, requiring an almost constant reassessment of variables in the cost-benefit equation. The scientific evaluation of emerging technologies plays a very important role in providing unbiased information that is essential for making decisions that maximize the chance of a desirable outcome. As the strength of evidence and clinical
significance of this information is determined by the scientific study design, it is of interest to assess what types of studies are published in the literature, both in terms of the strength of evidence of their study design and their level of clinical efficacy.
4
from weak to strong and include: case reports, case series, cross-sectional, case control, and cohort studies (Table 1).
Case reports and case series consist of one or more cases with a detailed description of the clinical presentation and can include histopathology, pathophysiology, differential diagnosis and other clinically relevant information. Cross-sectional studies examine the relationship between disease and other variables at the same point in time for a defined group of subjects. It measures current disease prevalence against current exposure prevalence. Case-control studies examine relationships between exposure and disease based on exposure history; subjects are defined as cases (those having the disease) and as controls (those not having the disease). In cohort studies, subjects are classified on the basis of exposure and followed through time to examine if a disease develops or not. At least two observational points are chosen. The strongest evidence is provided by experimental study designs, such as the randomized clinical trial.
Randomized clinical trials (RCT) compare two groups that are randomly assigned to either the experimental or the control group. The RCT is considered the gold standard for evidence-based dentistry and clinicians should look for clinical research with the highest level of evidence available for clinical decision making.
5
by physical parameters describing various aspects of the modality, such as contrast, modulation transfer function, dose and artifacts. The second level is the diagnostic accuracy efficacy, which represents how accurately the outcome of the test reflects the true disease state of the patient. Measures of diagnostic accuracy include sensitivity and specificity, predictive values and area under the receiver operating characteristic curve (ROC). The third level is the diagnostic thinking efficacy. This represents the extent to which an image is judged helpful in making a diagnosis as measured by, for instance, the impact on the differential diagnosis probability
distribution or the difference in pre- and post-test probabilities. The fourth level is the therapeutic efficacy. This represents the degree to which an image is helpful in planning patient
management as measured by the retrospective or prospective alteration of a treatment plan after the image information is obtained. The fifth level is the patient outcome efficacy, which is a measure of the effect of the test on patient-related outcomes, such as morbidity, changes in life expectancy, cost, function and esthetics. The sixth and highest level is the societal efficacy. At this level, the impact of the imaging modality on society is assessed using cost-benefit analyses. In order for a diagnostic imaging modality to be efficacious at a higher level, it must be
efficacious at the levels below. However, high efficacy at a lower level does not automatically imply high efficacy at a higher level.
6
The impact of a new technology that shows improved technical and diagnostic abilities, but fails to alter treatment decisions and outcomes is low. The need for studies addressing higher levels of efficacy according to the Fryback and Thornbury model is thus self-evident. However, it is recognized that such studies represent a significant challenge compared to those addressing lower levels of efficacy. The assessment of the higher levels of efficacy for a new technology is increasingly complicated by the influence of other factors. Isolating the effect of the imaging modality on treatment decisions and outcomes is a difficult task, requiring careful study designs.
The potential need for assumptions and simplifications may reduce the generalizability of the results and thus the relevance of the study to clinical practice. Nevertheless, a lack of strong evidence for efficacy at higher levels is problematic and could lead to wrongful acceptance of an imaging modality. The normal progression of research would suggest that early studies focus on safety and accuracy and subsequent studies include clinical trials that answer questions of
clinical importance at a higher efficacy level.
7
units for the oral maxillofacial region and ushered in the CT revolution in dentistry19, 20. The CBCT technique is based on a cone-shaped or pyramid-shaped x-ray beam that acquires a series of 2D images as both the source and detector rotate once around the object of interest. The images are then reconstructed in 3D using complex mathematical algorithms. While CBCT is the most costly imaging modality ever developed for dentistry and imparts the highest dose to the patient compared to traditional dental x-ray modalities, it is gaining acceptance in many aspects of dentistry and is becoming the standard of care in certain clinical settings. The question is whether the acceptance of this modality is supported by scientific studies providing evidence for its use and whether the scientific literature has matured since its inception. Furthermore, are there differences in the strength and efficacy of scientific articles associated with different clinical disciplines and are they increasing over time? Areas of particular interest in this regard include implant site assessment, orthodontics, oral surgery, periodontology and endodontics. Finally, are there differences in the strength and efficacy of scientific articles published in journals with a radiology focus versus other journals or between different geographic regions?
8
Fletchers in that the randomized clinical trials and multicenter studies increased and case series and nonrandomized controlled trials decreased, indicating an increase in the clinical evidence of the literature. In Obstetrics and Gynecology 151 articles from 1991 to 2001 were classified by research methodology and level of evidence and it was noted that analytic studies increased while anecdotal reports decreased24. Clinical studies published in neurosurgical journals from 1982, 1992 and 2002 were similarly evaluated and notwithstanding the modest increased in randomized clinical trials, case reports remained the predominate study design25. A study describing nursing research from 1956 to 1983 showed a peak in the use of experimental designs in the 1960s with a decline in 198322. Another study in Radiology that aimed to determine the use of advanced imaging techniques found results that suggest that criteria such as study design and relevance for daily clinical use have a major impact on the acceptance of papers in clinically oriented radiology journals27. A study of 1,831 articles from four otolaryngology journals over a 20-year period found that clinical research increased in both quality and quantity28.
9
for CBCT imaging and that terminology and technical device properties and settings were not consistent in the literature. In an unpublished pilot study, Kim and co-workers evaluated the study design and diagnostic efficacy of the CBCT literature through 2008.33 Their results showed that the majority of studies did not provide strong evidence for informed clinical decision making.
To our knowledge, a complete and update assessment of the CBCT literature with regard to study design and efficacy level does not exist. Such an assessment will show whether there are temporal changes in the literature and whether there are differences between clinical
disciplines, journal types and between geographic regions. This study may find that the literature in general has matured and that the use of CBCT in dentistry is based on sound scientific
evidence. On the other hand, this study may also find a lack of evidence, either generalized or only in certain clinical discipline areas. In this case, the proposed study can point to areas of weakness and establish a basis for future study design.
10
METHODS AND MATERIALS
Sample
The sample for this study comprised all articles on CBCT published in the English-language dental journals indexed in PubMed (National Center for Biotechnology Information, U.S. National Library of Medicine, Bethesda, MD) from the inception of CBCT for dentistry to June 2013.
Search Strategy
In order to capture all published scientific articles on CBCT in the dental journals, the following search strategy was used: Mesh term “Cone-Beam Computed Tomography”, and the following text words; CBCT, CBVT, Cone beam computed tomography and Cone beam volumetric tomography with the English language and dental journal filters being used.
Article Classification
11
other or not-applicable. Articles were downloaded in Portable Document Format (PDF). Each article was evaluated by two investigators. The investigators were a board certified Oral Maxillofacial Radiologist and an Oral Maxillofacial Radiology resident (primary author).
Prior to the classification of the actual sample, the investigators completed training and calibration sessions. The calibration consisted of a series of twenty articles spanning the various levels of study design and efficacy. The articles were not any of the articles that were considered in this study. The calibration samples were provided by a third investigator; a board certified Oral Maxillofacial Radiologist with more than 35 years of expertise in health care, public health, epidemiology, dentistry and academic scholarship, who did not participate in the assessment of the main study sample but acted as the trainer and calibrator for the project. Following
12
The following classifications were used to enter the results into an Excel (Microsoft Corp., Redmond, WA) file for study design: Case Report (1 or 2 cases), Case Series (3 or more cases), Cross-sectional, Case-control, Cohort, Experimental, and other (Table 3). For efficacy, the following classifications were used to enter the results; Technical, Diagnostic Accuracy, Diagnostic Thinking, Therapeutic, Patient Outcome, Societal and Not Applicable (Table 4).
Clinical disciplines were also used to categorize the articles by the general topic of the article related to the following disciplines; Dental public health, Endodontics, General Dentistry, Implantology, Oral and Maxillofacial Pathology, Oral and Maxillofacial Radiology, Oral and Maxillofacial surgery, Orthodontics and Dentofacial Orthopedics, Pediatric Dentistry,
Periodontology, Prosthodontics and Not Applicable (Table 5).
13
The articles were also coded by journal of publication. The journal codes were assigned alphabetically starting with the code of 1 for Acta Odontologica Latinoamericana: AOL and ending with the code of 116 for World Journal of Orthodontics (APPENDIX 1). The journals were then coded as “Radiology Journals” and “Other Journals”, the “Radiology journals” consisting of Dentomaxillofacial Radiology (DMFR) and Oral Surgery, Oral Medicine, Oral Pathology, Oral Radiology and Endodontics (OOOOE) and the “Other journal” consisting of all remaining journals.
The articles were further classified by the country of origin of the corresponding author (Table 6). 39 countries were initially identified and preliminary analysis revealed that 70% of the articles were produced by authors from seven countries. Each of the seven countries
identified were then coded individually with the remaining countries (32 countries) being coded together as the “Other Countries” category.
Data Analysis
14
15
RESULTS
Study Design and Efficacy Level
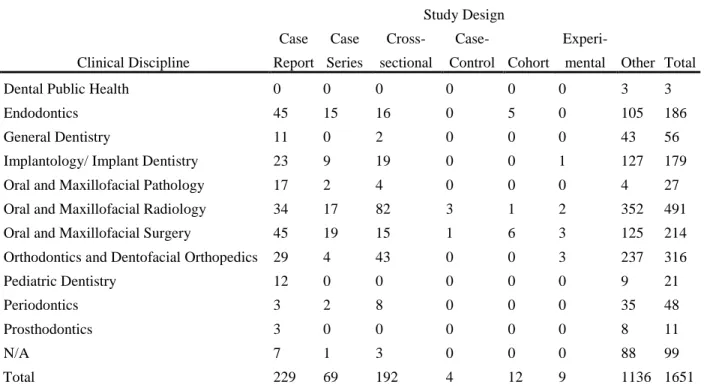
The search resulted in1651 articles (Figure 1). 515 of these articles met the definition of CBCT research and were classified according to the traditional epidemiological study design hierarchy. Of these 515, there were 229 case reports, 69 case series, 192 cross-sectional, 4 case-control, 12 cohort and 9 experimental studies (Table 7, Figure 2). There was no statistically significant difference in study designs over the time frame of this study (Table 8) (Figure 3). Of the 492 articles that were classified by the six efficacy levels, 21 were technical, 376 were diagnostic accuracy, 73 were diagnostic thinking, 8 were therapeutic, 13 were patient outcome and 1 was societal (Table 9, Figure 4).
16
Clinical Disciplines
Of the 10 clinical disciplines that were identified, all of the articles were classified into one of the disciplines with the exception of 99 articles which were classified as not applicable (N/A). Examples of articles that were not applicable were articles that were editorials, letters to the editor and viewpoints. The distribution of the articles by clinical discipline was; 491 Oral and Maxillofacial Radiology, 316 Orthodontics and Dentofacial Orthopedics, 214 Oral and Maxillofacial Surgery,186 Endodontics, 179 Implantology/ Implant Dentistry, 56 General Dentistry, 21 Pediatrics, 11 Prosthodontics and 4 Oral and Maxillofacial Pathology (APPENDIX 2, Figure 6).
The distribution of articles by clinical discipline and by study design was cross-tabulated and graphed by percentage and can be found in Table 11 and Figure 7 respectively. There was a statistically significant difference between clinical disciplines by study design (P<0.01, Table 12,) and the regression lines demonstrate a positive trend for all clinical disciplines except Oral Maxillofacial Pathology and Periodontology which show negative trends in study design over the study period (Figure 8). The differences between clinical discipline, study design and year of publication, however, were not significant (P=0.76, Table 12,). Post hoc pairwise ANCOVA comparisons using the least square means analysis, with study design as the dependent variable, resulted in a significant difference between the following clinical disciplines; Endodontics and Pedodontics (P=0.08), General dentistry and Implantology (P=0.04), General Dentistry and Pathology (P =0.01), General Dentistry and OMR, (P <0.01), General Dentistry and
17
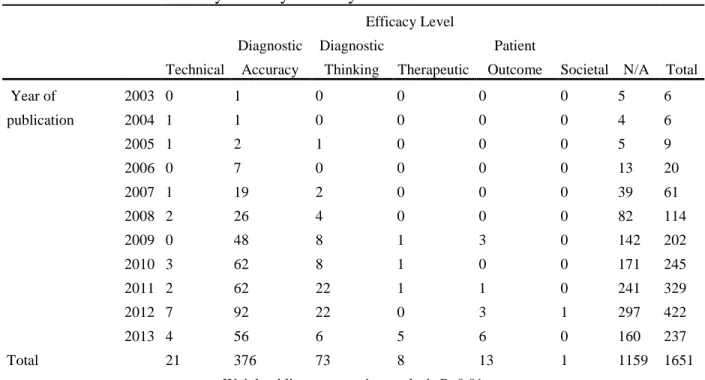
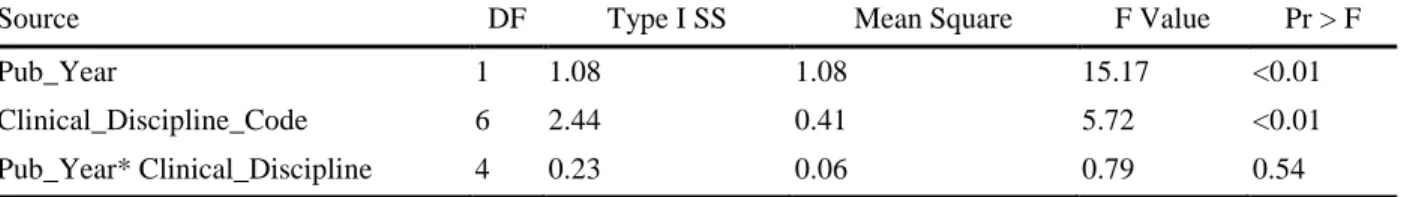
Within the clinical disciplines the articles were also classified by efficacy levels. The distribution of the articles by efficacy level is shown by count in Table 14 and by percentage in Figure 9. The distribution of the articles by clinical discipline and year of publication can be found in APPENDIX 3. There was a significant difference between clinical disciplines by efficacy level (P<0.01, Table 15) and the regression lines demonstrated a positive trend for all clinical disciplines except Implantology which shows a negative trend (Figure 10). The
differences between clinical disciplines by efficacy level and by year of publication over the time frame of this study, however, were not significant (P=0.54, Table 15,). The post hoc pairwise ANCOVA comparisons using the least square means analysis for clinical discipline with efficacy level as the dependent variable showed significant differences (Table 16) between the following clinical disciplines; Endodontics and OMS (P<0.01), Implantology and OMR (P<0.01),
Implantology and Orthodontics (P=0.01), OMR and OMS (P<0.01) and OMS and Orthodontics (P<0.01).
Journal of Publication
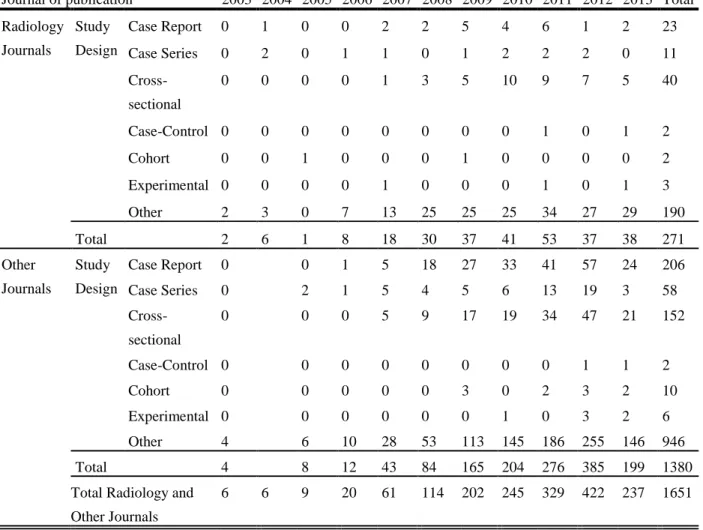
Articles classified by journal of publication resulted in 271 articles classified as
18
significant differences when the variable for year of publication was added to the analysis(P=0.29) (Table 18).
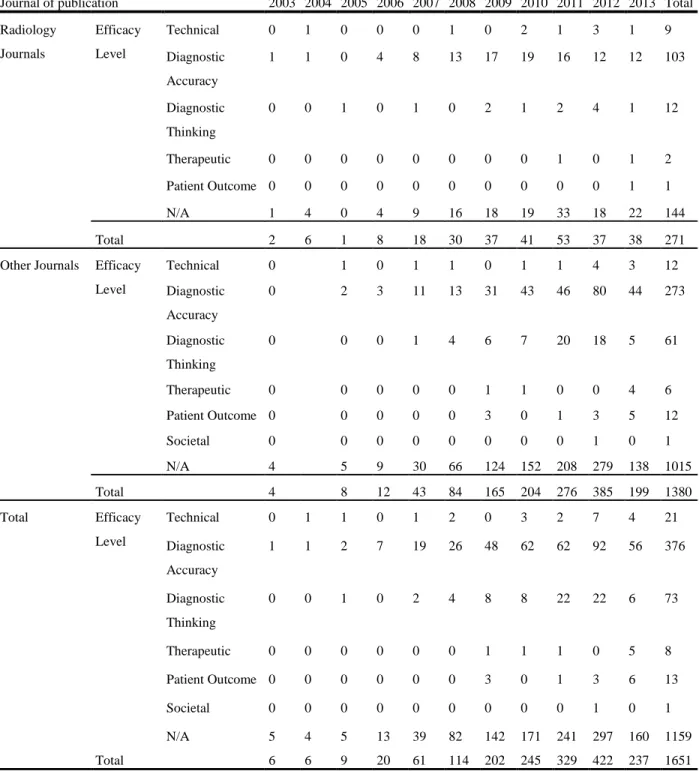
The distribution of articles in Radiology Journals by efficacy level resulted 9 technical, 103 diagnostic accuracy, 12 diagnostic thinking, 2 therapeutic, 1 patient outcome and 0 societal. The distribution of articles in Other Journals by efficacy level resulted 12 technical, 273
diagnostic accuracy, 61 diagnostic thinking, 6 therapeutic, 12 patient outcome and 1 societal (Table 19). There was a statistically significant difference between the Radiology Journals and the Other Journals category by efficacy level (P=0.04, Table 20, Figure 12) with the Other Journals having a higher average mean for efficacy levels. When the variable year of publication was added to the weighted linear regression model, however there were not any significant differences over time (P=0.21, Table 20).
Country of Corresponding Author
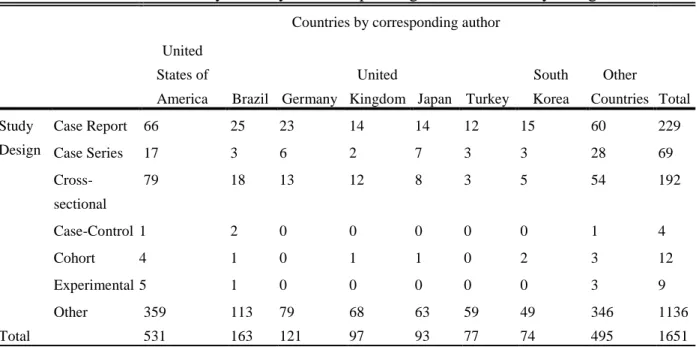
Articles classified by country of corresponding author resulted in 39 countries being identified. Preliminary analysis showed that seven countries accounted for 70% of the articles that were published in the dental journals (APPENDIX 4, APPENDIX 5). The seven countries with the highest numbers of articles were the United States of America with 531 articles, Brazil with 163 articles, Germany with 121 articles, The United Kingdom with 97 articles, Japan with 93 articles, Turkey with 77 articles, and South Korea with 74 articles. The remaining 32
19
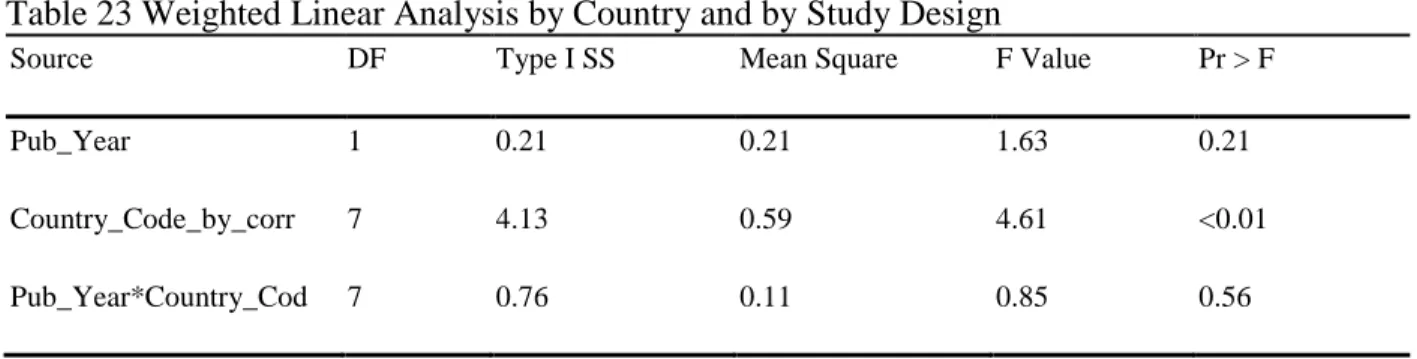
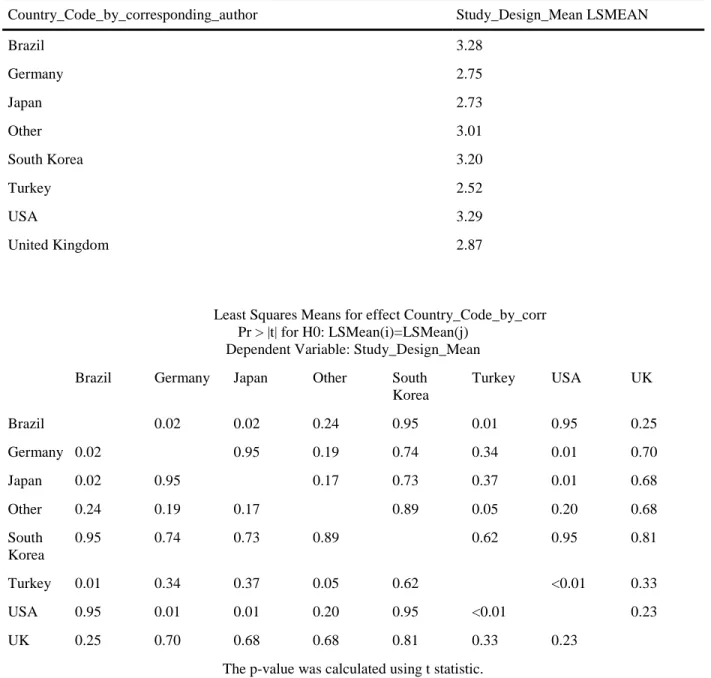
There was a statistically significant difference in study designs between countries by corresponding author (P=0.01, Table 23) with Brazil having the highest overall average mean for study design. The fixed plot of means for country of corresponding author with study design as the dependent variable showed positive trends over time toward higher study designs for all countries except Brazil which showed a negative trend toward lower study designs (Figure 16). When the variable for publication year was added to the weighted linear regression model, however, there were no significant differences for study design over the time frame of this study (P=0.66, Table 23). Post hoc pairwise ANCOVA comparisons using the least square means analysis for country by corresponding author with study design as the dependent variable showed that the significant differences were between the following countries; Brazil and Germany
(P=0.02), Brazil and Japan (P=0.02), Brazil and Turkey (P=0.01), USA and Germany (P=0.01), USA and Japan (P=0.01) and USA and Turkey (P<0.01) (Table 24).
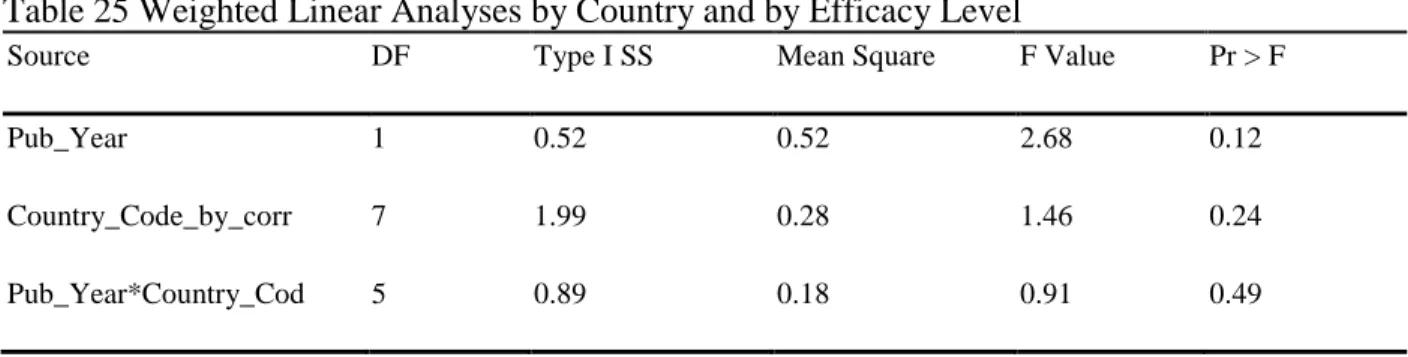
With regards to country by corresponding author, where efficacy was the dependent variable in the weighted linear regression analysis, there was not a statistically significant
20
Tables
Table 1 Traditional Study Designs
Study Design Description
Case report The presentation of one or two new cases
Case series The presentation of three or more new cases
Cross-sectional Examines relationships between exposure and disease prevalence in a defined population at one point in time
Case-control Examines relationships between exposure and disease based on exposure history ; subjects are defined as cases (those having the disease) and as controls (those not having the disease)
Cohort Subjects are classified on the basis of exposure and followed through time to examine if a disease develops or not. At least two observational points are chosen
Experimental Preventive or clinical trials with non-random or random allocation
Table 2 Hierarchical Model of Efficacy According to Fryback and Thornbury
Level Description
Technical efficacy Technical quality of an imaging modality as assessment by physical parameters describing various aspects of an imaging modality, such as contrast, modulation transfer function, dose and artifacts.
Diagnostic accuracy efficacy Yield of normal or abnormal diagnoses in a group of cases as assessed with sensitivity and specificity, predictive
values or ROC analysis*
Diagnostic thinking efficacy The extent to which an image is judged helpful in making a diagnosis as measured by, for instance, the impact on differential diagnosis
probability distribution or difference in pre- and post-test probabilities
Therapeutic efficacy The degree to which an image is helpful in planning patient management as measured by the retrospective or prospective alteration of a treatment plan after the image information is obtained
Patient outcome efficacy The proportion of patients who improve with the test compared to those without the test as measured by outcome measures such as morbidity, changes in life expectancy, cost, function and esthetics.
Societal efficacy The impact on society as determined by a cost-benefit analysis
21 Table 3 Study Design Codes
Study Design Code Study Design Code
Case Report (1 or 2 cases) 2 Cohort 6
Case series (3 or more cases) 3 Experimental 7
Cross-sectional 4 Other 8
Case-control 5
Table 4 Efficacy Level Codes
Efficacy Level Code Efficacy Level Code
Technical 1 Patient Outcome 5
Diagnostic Accuracy 2 Societal 6
Diagnostic Thinking 3 Not Applicable (N/A) 9
Therapeutic 4
Table 5 Clinical Discipline Codes
Clinical Discipline Code Clinical Discipline Code
Dental Public Health 1 Oral and Maxillofacial Surgery 7
Endodontics 2 Orthodontics and Dentofacial Orthopedics 8
General Dentistry 3 Pediatric Dentistry 9
Implantology/ Implant Dentistry 4 Periodontology 10
Oral and Maxillofacial Pathology 5 Prosthodontics 11
22 Table 6 Country of Corresponding Author Codes
Country of corresponding author Code Country of corresponding author Code
Argentina 1 Latvia 21
Australia 2 Lebanon 22
Austria 3 Netherlands 23
Belgium 4 New Zealand 24
Brazil 5 Romania 25
Canada 6 Saudi Arabia 26
Chile 7 Serbia 27
China 8 Singapore 28
Denmark 9 South Korea 29
Egypt 10 Spain 30
Finland 11 Switzerland 31
France 12 Sweden 32
Germany 13 Taiwan 33
Greece 14 Thailand 34
Hungary 15 Turkey 35
India 16 United Kingdom 36
Iran 17 United States of America 37
Israel 18 South Africa 38
Italy 19 Mexico 39
Japan 20
Table 7 Number of Articles by Study Design by Year
Study Design Total Case Report Case Series Cross-sectional
Case-Control Cohort Experimental Other
Year of publication 2003 0 0 0 0 0 0 6 6
2004 1 2 0 0 0 0 3 6
2005 0 2 0 0 1 0 6 9
2006 1 2 0 0 0 0 17 20
2007 7 6 6 0 0 1 41 61
2008 20 4 12 0 0 0 78 114
2009 32 6 22 0 4 0 138 202
2010 37 8 29 0 0 1 170 245
2011 47 15 43 1 2 1 220 329
2012 58 21 54 1 3 3 282 422
2013 26 3 26 2 2 3 175 237
Total 229 69 192 4 12 9 1136 1651
23
Table 8 Weighted Linear Regression Analysis for Study Design
Variable Label DF
Parameter
Estimate
Standard
Error t Value Pr > |t|
Intercept Intercept 1 2.94 0.11 26.60 <.01
Pub_Year Pub_Year 1 0.03 0.03 1.04 0.34
Table 9 Number of Articles by Efficacy Level by Year
Efficacy Level
Total Technical
Diagnostic Accuracy
Diagnostic
Thinking Therapeutic
Patient
Outcome Societal N/A Year of
publication
2003 0 1 0 0 0 0 5 6
2004 1 1 0 0 0 0 4 6
2005 1 2 1 0 0 0 5 9
2006 0 7 0 0 0 0 13 20
2007 1 19 2 0 0 0 39 61
2008 2 26 4 0 0 0 82 114
2009 0 48 8 1 3 0 142 202
2010 3 62 8 1 0 0 171 245
2011 2 62 22 1 1 0 241 329
2012 7 92 22 0 3 1 297 422
2013 4 56 6 5 6 0 160 237
Total 21 376 73 8 13 1 1159 1651
Weighted linear regression analysis P<0.01
Table 10 Weighted Linear Regression Analysis for Efficacy Levels
Variable Label DF
Parameter
Estimate
Standard
Error t Value Pr > |t|
Intercept Intercept 1 1.97 0.04 44.45 <0.01
24
Table 11 Number of Articles by Clinical Discipline and Study Design
Clinical Discipline
Study Design
Total Case
Report Case Series
Cross-sectional
Case-Control Cohort
Experi-mental Other
Dental Public Health 0 0 0 0 0 0 3 3
Endodontics 45 15 16 0 5 0 105 186
General Dentistry 11 0 2 0 0 0 43 56
Implantology/ Implant Dentistry 23 9 19 0 0 1 127 179
Oral and Maxillofacial Pathology 17 2 4 0 0 0 4 27
Oral and Maxillofacial Radiology 34 17 82 3 1 2 352 491
Oral and Maxillofacial Surgery 45 19 15 1 6 3 125 214
Orthodontics and Dentofacial Orthopedics 29 4 43 0 0 3 237 316
Pediatric Dentistry 12 0 0 0 0 0 9 21
Periodontics 3 2 8 0 0 0 35 48
Prosthodontics 3 0 0 0 0 0 8 11
N/A 7 1 3 0 0 0 88 99
Total 229 69 192 4 12 9 1136 1651
Weighted Linear regression analysis for clinical discipline by study design P=0.01
Table 12 Weighted Linear Regression Analysis for Clinical Discipline by Study Design
Source DF Type I SS Mean Square F Value Pr > F
Pub_Year 1 5.35 5.35 5.66 0.02
Clinical_Discipline_Code 7 47.07 5.88 6.23 <0.01
25 Table 13 ANCOVA Pairwise Least Square Means Analysis by Study Design and Clinical Discipline
Specialty_Code Study_Design_Mean LSMEAN
Endodontics 2.77
General Dentistry 2.02
Implantology 2.98
Pathology 2.74
OMS 3.43
OMR 2.73
Orthodontics 3.29
Pedodontics 2.00
Periodontology 3.69
Endo General
Dentistry
Implant Path Periodontology
Endodontics 0.09 0.71 0.93 0.12
General Dentistry 0.09 0.04 0.01 <0.01
Implantology 0.71 0.04 0.58 0.24
Pathology 0.93 0.01 0.58 0.05
OMR 0.22 <0.01 0.41 0.08 0.64
OMS 0.94 0.12 0.67 0.10 0.11
Orthodontics 0.37 0.01 0.60 0.23 0.51
Pedodontology 0.08 0.94 0.03 0.01 <0.01
Periodontology 0.12 <0.01 0.24 0.05
26
Table 14 Number of Articles by Clinical Discipline and by Efficacy Level
Clinical Discipline Efficacy Level Total T ec h n ical Diag n o stic Acc u rac y Diag n o stic T h in k in g T h er ap eu tic Patien t Ou tco m e So cieta l N/A
Dental Public Health 0 0 0 0 0 1 2 3
Endodontics 0 40 12 0 1 0 133 186
General Dentistry 0 5 1 0 0 0 50 56
Implantology/ Implant Dentistry 1 27 8 0 3 0 140 179
Oral and Maxillofacial Pathology 0 2 1 0 0 0 24 27
Oral and Maxillofacial Radiology 17 201 29 4 3 0 237 491
Oral and Maxillofacial Surgery 1 21 8 2 5 0 177 214
Orthodontics and Dentofacial Orthopedics 2 64 12 2 1 0 235 316
Pediatric Dentistry 0 3 0 0 0 0 18 21
Periodontics 0 12 1 0 0 0 35 48
Prosthodontics 0 0 0 0 0 0 11 11
N/A 0 1 1 0 0 0 97 99
Total 21 376 73 8 13 1 1159 1651
Table 15 Weighted Linear Regression Analysis by Clinical Discipline and by Efficacy Level
Source DF Type I SS Mean Square F Value Pr > F
Pub_Year 1 1.08 1.08 15.17 <0.01
Clinical_Discipline_Code 6 2.44 0.41 5.72 <0.01
27 Table 16 ANCOVA Pairwise Least Square Means Analysis by Efficacy Level and Clinical Discipline
Specialty_Code Efficacy_Level_Mean LSMEAN
Endodontics 2.25
General Dentistry Non-est
Implantology 2.47
Oral Pathology Non-est
OMR 2.09
OMS 2.76
Orthodontics 2.15
Pedodontics Non-est
Periodontology Non-est
Least Squares Means for effect Specialty_Code Pr > |t| for H0: LSMean(i)=LSMean(j)
Dependent Variable: Efficacy_Level_Mean
i/j Endo General
Dentistry
Implant Pathology OMR OMS Ortho Pedodontics Periodontology
Endo . 0.06 . 0.07 <0.01 0.21 . .
General Dentistry
. . . .
Implant 0.06 . . <0.01 0.09 0.01 . .
Pathology . . . .
OMR 0.07 . <0.01 . <0.01 0.47 . .
OMS <0.01 . 0.09 . <0.01 <0.01 . .
Ortho 0.21 . 0.01 . 0.47 <0.01 . .
Pedo . . . .
28
Table 17 Number of Articles by Study Design Between Radiology Journals and the Other Journals
Journal of publication
Year of publication
Total 2003 2004 2005 2006 2007 2008 2009 2010 2011 2012 2013 Radiology
Journals
Study Design
Case Report 0 1 0 0 2 2 5 4 6 1 2 23
Case Series 0 2 0 1 1 0 1 2 2 2 0 11
Cross-sectional
0 0 0 0 1 3 5 10 9 7 5 40
Case-Control 0 0 0 0 0 0 0 0 1 0 1 2
Cohort 0 0 1 0 0 0 1 0 0 0 0 2
Experimental 0 0 0 0 1 0 0 0 1 0 1 3
Other 2 3 0 7 13 25 25 25 34 27 29 190
Total 2 6 1 8 18 30 37 41 53 37 38 271
Other Journals
Study Design
Case Report 0 0 1 5 18 27 33 41 57 24 206
Case Series 0 2 1 5 4 5 6 13 19 3 58
Cross-sectional
0 0 0 5 9 17 19 34 47 21 152
Case-Control 0 0 0 0 0 0 0 0 1 1 2
Cohort 0 0 0 0 0 3 0 2 3 2 10
Experimental 0 0 0 0 0 0 1 0 3 2 6
Other 4 6 10 28 53 113 145 186 255 146 946
Total 4 8 12 43 84 165 204 276 385 199 1380
Total Radiology and Other Journals
6 6 9 20 61 114 202 245 329 422 237 1651
Table 18 Weighted Linear Analyses by Journal and by Study Design
Source DF Type I SS Mean Square F Value Pr > F
Pub_Year 1 0.47 0.47 26.46 <0.01
Journal_Code 1 0.63 0.63 35.81 <0.01
29
Table 19 Number of Articles by Efficacy Level between Radiology Journals and the Other Journals
Journal of publication
Year of publication
Total 2003 2004 2005 2006 2007 2008 2009 2010 2011 2012 2013 Radiology
Journals
Efficacy Level
Technical 0 1 0 0 0 1 0 2 1 3 1 9
Diagnostic Accuracy
1 1 0 4 8 13 17 19 16 12 12 103
Diagnostic Thinking
0 0 1 0 1 0 2 1 2 4 1 12
Therapeutic 0 0 0 0 0 0 0 0 1 0 1 2
Patient Outcome 0 0 0 0 0 0 0 0 0 0 1 1
N/A 1 4 0 4 9 16 18 19 33 18 22 144
Total 2 6 1 8 18 30 37 41 53 37 38 271
Other Journals Efficacy
Level
Technical 0 1 0 1 1 0 1 1 4 3 12
Diagnostic Accuracy
0 2 3 11 13 31 43 46 80 44 273
Diagnostic Thinking
0 0 0 1 4 6 7 20 18 5 61
Therapeutic 0 0 0 0 0 1 1 0 0 4 6
Patient Outcome 0 0 0 0 0 3 0 1 3 5 12
Societal 0 0 0 0 0 0 0 0 1 0 1
N/A 4 5 9 30 66 124 152 208 279 138 1015
Total 4 8 12 43 84 165 204 276 385 199 1380
Total Efficacy
Level
Technical 0 1 1 0 1 2 0 3 2 7 4 21
Diagnostic Accuracy
1 1 2 7 19 26 48 62 62 92 56 376
Diagnostic Thinking
0 0 1 0 2 4 8 8 22 22 6 73
Therapeutic 0 0 0 0 0 0 1 1 1 0 5 8
Patient Outcome 0 0 0 0 0 0 3 0 1 3 6 13
Societal 0 0 0 0 0 0 0 0 0 1 0 1
N/A 5 4 5 13 39 82 142 171 241 297 160 1159
30
Table 20 Weighted Linear Analyses by Journal and by Efficacy Level
Source DF Type I SS Mean Square F Value Pr > F
Pub_Year 1 0.31 0.31 6.59 0.03
Journal_Code 1 0.25 0.25 5.42 0.04
Pub_Year*Journal_Cod 1 0.08 0.08 1.77 0.21
Table 21 Number of Articles by Country of Corresponding Author and Study Design
Countries by corresponding author
Total United
States of
America Brazil Germany
United
Kingdom Japan Turkey
South Korea
Other Countries Study
Design
Case Report 66 25 23 14 14 12 15 60 229
Case Series 17 3 6 2 7 3 3 28 69
Cross-sectional
79 18 13 12 8 3 5 54 192
Case-Control 1 2 0 0 0 0 0 1 4
Cohort 4 1 0 1 1 0 2 3 12
Experimental 5 1 0 0 0 0 0 3 9
Other 359 113 79 68 63 59 49 346 1136
31
Table 22 Number of Articles by Country of Corresponding Author and Efficacy Level
Top 7 countries and all others
Total Other
Countries Brazil Germany Japan
South
Korea Turkey
United Kingdom
United States of America Efficacy
Level
Technical 11 1 1 0 0 0 2 6 21
Diagnostic Accuracy
109 38 26 19 13 13 17 141 376
Diagnostic Thinking
21 9 6 2 2 1 3 29 73
Therapeutic 2 1 0 0 0 0 0 5 8
Patient Outcome
5 4 0 0 0 0 3 1 13
Societal 0 0 0 0 0 0 0 1 1
N/A 347 110 88 72 59 63 72 348 1159
Total 495 163 121 93 74 77 97 531 1651
Table 23 Weighted Linear Analysis by Country and by Study Design
Source DF Type I SS Mean Square F Value Pr > F
Pub_Year 1 0.21 0.21 1.63 0.21
Country_Code_by_corr 7 4.13 0.59 4.61 <0.01
32
Table 24 ANCOVA Pairwise Least Square Means Analysis by Study Design Mean and by Country of Corresponding Author
Country_Code_by_corresponding_author Study_Design_Mean LSMEAN
Brazil 3.28
Germany 2.75
Japan 2.73
Other 3.01
South Korea 3.20
Turkey 2.52
USA 3.29
United Kingdom 2.87
Least Squares Means for effect Country_Code_by_corr Pr > |t| for H0: LSMean(i)=LSMean(j)
Dependent Variable: Study_Design_Mean
Brazil Germany Japan Other South
Korea
Turkey USA UK
Brazil 0.02 0.02 0.24 0.95 0.01 0.95 0.25
Germany 0.02 0.95 0.19 0.74 0.34 0.01 0.70
Japan 0.02 0.95 0.17 0.73 0.37 0.01 0.68
Other 0.24 0.19 0.17 0.89 0.05 0.20 0.68
South Korea
0.95 0.74 0.73 0.89 0.62 0.95 0.81
Turkey 0.01 0.34 0.37 0.05 0.62 <0.01 0.33
USA 0.95 0.01 0.01 0.20 0.95 <0.01 0.23
UK 0.25 0.70 0.68 0.68 0.81 0.33 0.23
33
Table 25 Weighted Linear Analyses by Country and by Efficacy Level
Source DF Type I SS Mean Square F Value Pr > F
Pub_Year 1 0.52 0.52 2.68 0.12
Country_Code_by_corr 7 1.99 0.28 1.46 0.24
Pub_Year*Country_Cod 5 0.89 0.18 0.91 0.49
Figures
34
Figure 2 Percent of study designs per year between 2004 and 2013 (*2013 Totals for 6 months )
Figure 3 Plot of the means for study design over time
Pub year: 1=2007 and prior, 2=2008, 3=2009, 4=2010, 5=2011, 6=2012, 7=2013
1 2 3 4 5 6 7
Pub_Year 2.5
3.0 3.5
S
tu
d
y
_
D
e
s
ig
n
95% Prediction Limits (Weighted) 95% Confidence Limits
Fit
35
Figure 4 Percent of efficacy levels per year between 2003 and 2013 (*2013 Totals for 6 months )
Figure 5 Fixed plot of the means for efficacy level over time
Pub year: 1=2007 and prior, 2=2008, 3=2009, 4=2010, 5=2011, 6=2012, 7=2013
1 2 3 4 5 6 7
Pub_Year 1.8
2.0 2.2 2.4 2.6 2.8
E
ffi
c
a
c
y
_
L
e
ve
l
95% Prediction Limits (Weighted) 95% Confidence Limits
Fit
37
38
Figure 8 Fixed plot of means for each clinical discipline by study design
1=Clinical discipline codes: 2=Endodontics, 3=General Dentistry, 4=Implantology, 5=Oral Pathology, 6=Oral Radiology, 7=Oral Surgery, 8=Orthodontics, 9=Pedodontics, 10=Periodontology
39
40
Figure 10 Fixed plot of means for each clinical discipline by efficacy level
1=Clinical discipline codes: 2=Endodontics, 3=General Dentistry, 4=Implantology, 5=Oral Pathology, 6=Oral Radiology, 7=Oral Surgery, 8=Orthodontics, 9=Pedodontics,
10=Periodontology
Pub year: 1=2007 and prior, 2=2008, 3=2009, 4=2010, 5=2011, 6=2012, 7=2013
1 2 3 4 5 6 7
Pub_Year 1.50
1.75 2.00 2.25 2.50 2.75 3.00
E
ffi
c
a
c
y
_
L
e
ve
l
10 9
8 7
6 5
4 3
2
Specialty_Code
42
Figure 12 Fixed plot of means for radiology journals and other journals by study design Pub year: 1=2007 and prior, 2=2008, 3=2009, 4=2010, 5=2011, 6=2012, 7=2013
Figure 13 Fixed plot of means for radiology journals and other journals by efficacy level Pub year: 1=2007 and prior, 2=2008, 3=2009, 4=2010, 5=2011, 6=2012, 7=2013
1 2 3 4 5 6 7
Pub_Year 2.75 3.00 3.25 3.50 3.75 4.00 S tu d y _ D e s ig n Radiology Journals Other Journals Journal_Code
Analysis of Covariance for Study_Design_Mean
1 2 3 4 5 6 7
Pub_Year 1.9 2.0 2.1 2.2 2.3 2.4 E ffi c a c y _ L e ve l Radiology Journals Other Journals Journal_Code
43
Figure 14 Percent of articles by country of corresponding author and study design (*2013 Totals for 6 months )
44
Figure 16 Fixed plot of means for country by corresponding author by study design Pub year: 1=2007 and prior, 2=2008, 3=2009, 4=2010, 5=2011, 6=2012, 7=2013
Figure 17 Fixed plot of means for country by corresponding author by efficacy level Pub year: 1=2007 and prior, 2=2008, 3=2009, 4=2010, 5=2011, 6=2012, 7=2013
1 2 3 4 5 6 7
Pub_Year 1.5
2.0 2.5 3.0 3.5 4.0
E
ffi
c
a
c
y
_
L
e
ve
l
United Kingdom USA
Turkey South Korea
Other Japan
Germany Brazil
45
DISCUSSION
From the inception of CBCT for dentistry in the late 1990’s to June 2013 when this search was completed, there has been no significant change in the types of study designs used in the clinical research published in dental journals regarding CBCT. The study designs were predominately at the lower levels of the epidemiological hierarchy with very few at the higher levels.
46
resulted in 57.9% of the articles being case reports/series and 37 % of the articles being cross-sectional study designs, results more in line with the studies by the Fletchers30 and Kim et al.31. A study of oral pathology papers published in 1972 and 1992 in OOOOE 34 reported that 57.8% of the pathology articles were case reports almost identical to the findings of this study. Cohort and case-control studies comprised 3.1% of the 515 articles that met the definition of CBCT research, comparable with 2.1% found in the general oral radiology literature and pediatric literature.31, 35 At the highest level of the epidemiological hierarchy are the longitudinal studies, randomized clinical trials (RCTs) being the pinnacle and considered the gold standard, which are uncommon in the oral radiology literature. Kim et al. reported only 7 of the 384(1.8%) articles being classified as experimental studies consistent with the findings of this study of 9 out of 515(1.7%.).
47
OMR literature31. While studies at the lower efficacy levels are necessary and foundational for studies at higher efficacy levels, studies at the higher efficacy levels are necessary for patient outcome and the benefit for society in general. For this reason it is important that studies with higher levels of efficacy are performed. The increase in efficacy found in this study, while at a significant level statistically, was primarily at the lower efficacy levels and may not be high enough to base health care policy on.
During the study period there were statistically significant differences among the clinical disciplines for study design. Five of the clinical disciplines (Endodontics, Implantology, OMR, OMS and Orthodontics) accounted for 84% of the articles that were published over the time frame of this study. The significant differences were mainly between these five major
contributors and the other clinical disciplines. There was and outlier, however, Periodontology with only 13 articles that were classified by study design and had the highest overall average mean study design. This was a result of eight out of thirteen articles having a cross-sectional study design and could represent a small sample bias. Considering that there were not any statistical differences between the clinical disciplines publishing the majority of the work, it can be concluded that there is no clinically significant difference between the study designs by clinical discipline. While there was not a statistically significant difference between the slopes of the lines for disciplines, a difference can be visually appreciated, with Oral Maxillofacial Surgery having the greatest slope, indicating an increased trend toward higher study designs. This increase was to be expected with the increasing integration of CBCT into the clinical practice of Oral Maxillofacial Surgery and the accompanying research for those clinical
48
in OOOOE and had a joint radiology/pathology emphasis the evaluator did not break down the journal by section but most likely defaulted to Oral Maxillofacial Radiology. This could have contributed to the low sampling frequency that was present for Oral Pathology resulting in this random effect.
When comparing efficacy levels by clinical discipline, a statistically significant
difference was found between Oral Maxillofacial Surgery and Oral Maxillofacial Radiology and between Oral Maxillofacial Surgery and Orthodontics. A significant difference was also found between Implantology and Oral Maxillofacial Radiology, between Implantology and
49
The differences between the Radiology journals and the Other Journals found in this study support the discussion about clinical discipline emphasis that was presented in regards to clinical discipline. The significant differences for both study design and efficacy level between the journals fell in line with the emphasis of the specialties that publish articles in their respective journals. The overall mean for study design was higher for Radiology Journals and the overall mean for efficacy was higher for Other Journals. Radiology has been involved in CBCT research since its introduction to dentistry. The maturation of studies over time lends toward higher study designs because the Radiology Journals decline studies that present the same levels of evidence with redundant information of less interest to their readers. Many of the journals in the Other Journal category are clinically based journals. In order to keep up with the rapid change in radiology technology clinically based journal may move on to new techniques and procedures without pursuing more rigorous studies of the existing technology. The fear of getting left behind and the pressure to appeal to the readership demanding information regarding new technology may also contribute to this problem. This could discourage the initiation of future research resulting in research that stays at the lower evidence levels.
The statistical difference in efficacy between Radiology Journals and the Other Journals is consistent with research questions that need to be answered. Research in radiology is very technical, answering questions concerning physical parameters and answering questions
50
efficacy levels over time were not significantly different, the regression lines for both categories indicate a trend toward higher study designs and higher levels of efficacy.
With regards to country by corresponding author there were statistically significant differences between countries by study design. The differences were between the two countries with the two highest overall means (Brazil and USA) and the countries with the countries with the three lowest overall means. However, the number of articles at the higher levels of evidence for all countries remain sparse and are all but absent at the RCT level. The statistically
significant finding between the countries is not a clinically significant finding due to the fact that the differences remain mainly between the lower levels of evidence. Brazil had the highest overall mean for study design. However, Brazil was the only country to show a negative trend in study design over time. There could be many reasons for this trend, however, one reason as suggested by the Fletchers is academic pressure, the “publish or perish” feeling 30, and the fact that studies at more rigorous levels are expensive, slow and difficult. As educational programs are established in Oral Maxillofacial Radiology there is also the time constraint that comes with completing your program/training on time that could potentially limit more rigorous studies.
51
journal; however, the remaining 70 articles were published in dental journals. Consulting with a senior research librarian at the Health Science Library it was discovered that journals have to be registered as dental journal in Pub med and if this step was missed it could account for the missing articles. All 70 of the articles were then classified by study design and efficacy level to evaluate any potential impact they might have had on the project. Classification Resulted in 18 articles that met the criteria for classification by study design, 12 were case reports, and 6 were cross-sectional study designs. Only 8 of the 70 articles were classified by efficacy level and all were classified as diagnostic accuracy efficacy level. The use of the dental journal filter should not bias the results, as the results from the subset are consistent with the overall sample.
The present study is a follow up study to a study published in DMFR in 201531 that analyzed the general OMR literature by study design and efficacy level. To our knowledge a complete analysis of the CBCT literature for dentistry by this same model has not been
completed. While there were some differences with regards to statistically significant increases in efficacy level between this study and the study of the general OMR literature the fact remains that the majority of the articles are still at the lower levels of efficacy.
52
53
APPENDIX 1
Journal Codes
Journal Code Journal Code
Acta Odontologica Latinoamericana : AOL
1 Journal of orthodontics 59
American Journal of Orthodontics and Dentofacial Orthopedics
2 Journal of periodontology 60 Atlas of the Oral and Maxillofacial
Surgery Clinics of North America
3 Journal of prosthodontics : official journal of the American College of Prosthodontists
61
Australian Dental Journal 4 Journal of the American Dental Association
62 Australian Endodontic Journal 5 Journal of the California Dental
Association
63 Australian Orthodontic Journal 6 Journal of the Indian Society of
Pedodontics and Preventive Dentistry
64
BMC oral health 7 Journal of the International
Academy of Periodontology
65 Brazilian dental journal 8 Journal of the Irish Dental
Association
66 Brazilian oral research 9 Journal of the Massachusetts Dental
Society
67 British dental journal 10 Journal of the New Jersey Dental
Association
68
Caries research 11 Journal of veterinary dentistry 69
Clinical implant dentistry and related research
12 Medicina oral, patologia oral y cirugia buccal
70
Clinical oral implants research 13 Minerva stomatologica 71
Clinical oral investigations 14 Northwest dentistry 72
Community dentistry and oral epidemiology
15 Operative dentistry 73
Compendium of continuing education in dentistry
16 Oral and maxillofacial surgery 74 Cranio : the journal of craniomandibular
practice
17 Oral and maxillofacial surgery clinics of North America
75 Dental clinics of North America 18 Oral surgery, oral medicine, oral
pathology and oral radiology
76 Dental implantology update 19 Oral surgery, oral medicine, oral
pathology, oral radiology, and endodontics
77
Dental materials : official publication of the Academy of Dental Materials
20 Orthodontics & craniofacial research
54
Dental materials journal 21 Orthodontics : the art and practice of dentofacial enhancement
79 Dental traumatology : official publication
of International Association for Dental Traumatology
22 Pediatric dentistry 80
Dental update 23 Pennsylvania dental journal 81
Dentistry today 24 Practical procedures & aesthetic dentistry : PPAD
82 Dento maxillo facial radiology 25 Primary dental care : journal of the
Faculty of General Dental Practitioners (UK)
83
European archives of paediatric dentistry : official journal of the European Academy of Paediatric Dentistry
26 Primary dental journal 84
European journal of oral Implantology 27 Progress in orthodontics 85 European journal of oral sciences 28 Quintessence international (Berlin,
Germany : 1985)
86 European journal of orthodontics 29 SADJ : journal of the South
African Dental Association
87 Frontiers of oral biology 30 Schweizer Monatsschrift fur
Zahnmedizin = Revue mensuelle suisse d'odonto-stomatologie = Rivista mensile svizzera di odontologia e stomatologia / SSO
88
General dentistry 31 Shanghai kou qiang yi xue =
Shanghai journal of stomatology
89
Gerodontology 32 Stomatologija / issued by public
institution "Odontologijos studija"
90
Head & face medicine 33 Swedish dental journal 91
Implant dentistry 34 Texas dental journal 92
Indian journal of dental research : official publication of Indian Society for Dental Research
35 The Alpha Omegan 93
International dental journal 36 The Angle Orthodontist 94
International endodontic journal 37 The British journal of oral & maxillofacial surgery
95 International journal of computerized
dentistry
38 The Bulletin of Tokyo Dental College
96 International journal of oral and
maxillofacial surgery
39 The Chinese journal of dental research : the official journal of the Scientific Section of the Chinese Stomatological Association
97
International journal of oral science 40 The Cleft palate-craniofacial journal : official publication of the American Cleft Palate-Craniofacial
55
Association International journal of orthodontics
(Milwaukee, Wis.)
41 The European journal of esthetic dentistry : official journal of the European Academy of Esthetic Dentistry
99
International orthodontics / College europeen d'orthodontie
42 The International journal of oral & maxillofacial implants
100 Journal - Oklahoma Dental Association 43 The International journal of
periodonology & restorative dentistry
101
Journal (Canadian Dental Association) 44 The International journal of prosthodontics
102 Journal (Indiana Dental Association) 45 The Journal of clinical pediatric
dentistry
103 Journal of applied oral science : revista
FOB
46 The journal of contemporary dental practice
104 Journal of clinical orthodontics : JCO 47 The Journal of craniofacial surgery 105 Journal of clinical periodontology 48 The journal of evidence-based
dental practice
106 Journal of cranio-maxillo-facial surgery :
official publication of the European Association for Cranio-Maxillo-Facial Surgery
49 The Journal of forensic odonto-stomatology
107
Journal of dental education 50 The Journal of oral implantology 108 Journal of dentistry 51 The Journal of prosthetic dentistry 109 Journal of endodontics 52 The Journal of the American
College of Dentists
110 Journal of esthetic and restorative
dentistry : official publication of the American Academy of Esthetic Dentistry
53 The Journal of the Michigan Dental Association
111
Journal of oral and maxillofacial surgery: official journal of the American
Association of Oral and Maxillofacial Surgeons
54 The Journal of the Western Society of Periodontology/Periodontal abstracts
112
Journal of oral rehabilitation 55 The New York state dental journal 113 Journal of oral science 56 The New Zealand dental journal 114 Journal of orofacial orthopedics =
Fortschritte der Kieferorthopadie : Organ/official journal
57 Today's FDA : official monthly journal of the Florida Dental Association
115
56
APPENDIX 2
TABLE OF ARTICLES BY CLINICAL DISCIPLINE BY YEAR AND STUDY DESIGN
Clinical Discipline
Year of publication
Total 2003 2004 2005 2006 2007 2008 2009 2010 2011 2012 2013
Dental Public
Health
Study
Design
Other 3 3
Total 3 3
Endodontics Study
Design
Case Report 0 1 3 1 11 16 10 3 45
Case Series 1 3 0 0 1 8 1 1 15
Cross-sectional 0 0 1 2 2 4 5 2 16
Cohort 0 0 0 1 0 1 2 1 5
Other 0 1 3 17 15 24 26 19 105
Total 1 5 7 21 29 53 44 26 186
General
Dentistry
Study
Design
Case Report 0 0 0 0 2 4 3 2 0 11
Cross-sectional 0 0 0 0 0 1 0 0 1 2
Other 1 1 2 5 5 6 7 11 5 43
Total 1 1 2 5 7 11 10 13 6 56
Implantology/
Implant
Dentistry
Study
Design
Case Report 0 0 0 5 1 2 3 8 4 23
Case Series 0 0 0 1 0 0 2 5 1 9
Cross-sectional 0 0 1 2 3 1 4 7 1 19
Experimental 0 0 0 0 0 0 0 0 1 1
Other 1 1 5 6 5 18 26 43 22 127
Total 1 1 6 14 9 21 35 63 29 179
Oral and
Maxillofacial
Pathology
Study
Design
Case Report 1 1 5 0 1 6 3 17
Case Series 0 0 0 0 0 2 0 2
Cross-sectional 0 1 0 2 0 1 0 4
Other 0 2 1 1 0 0 0 4
Total 1 4 6 3 1 9 3 27
Oral and
Maxillofacial
Radiology
Study
Design
Case Report 0 1 0 0 2 2 11 4 4 4 6 34
Case Series 0 1 0 0 1 2 2 4 2 5 0 17
Cross-sectional 0 0 0 0 3 6 7 12 20 22 12 82
Case-Control 0 0 0 0 0 0 0 0 1 0 2 3
Cohort 0 0 0 0 0 0 1 0 0 0 0 1
Experimental 0 0 0 0 0 0 0 1 1 0 0 2
57
Total 3 5 3 9 25 46 63 74 81 109 73 491
Oral and
Maxillofacial
Surgery
Study
Design
Case Report 0 0 0 0 5 6 11 8 13 2 45
Case Series 1 1 1 2 1 2 3 2 6 0 19
Cross-sectional 0 0 0 1 0 0 2 4 4 4 15
Case-Control 0 0 0 0 0 0 0 0 1 0 1
Cohort 0 1 0 0 0 2 0 1 1 1 6
Experimental 0 0 0 0 0 0 0 0 2 1 3
Other 0 1 1 1 9 12 18 24 34 25 125
Total 1 3 2 4 15 22 34 39 61 33 214
Orthodontics
and Dentofacial
Orthopedics Study
Design
Case Report 0 0 0 1 2 4 2 9 7 4 29
Case Series 0 1 0 0 0 2 0 0 0 1 4
Cross-sectional 0 0 0 1 1 7 8 10 12 4 43
Experimental 0 0 0 1 0 0 0 0 1 1 3
Other 1 2 3 8 6 32 41 46 57 41 237
Total 1 3 3 11 9 45 51 65 77 51 316
Pediatric
Dentistry
Study
Design
Case Report 1 0 0 2 2 1 2 4 12
Other 0 1 2 1 2 0 2 1 9
Total 1 1 2 3 4 1 4 5 21
Periodontology Study
Design
Case Report 0 0 1 0 0 0 2 0 3
Case Series 0 0 0 0 0 1 1 0 2
Cross-sectional 0 0 1 3 1 0 3 0 8
Other 1 2 3 3 5 10 8 3 35
Total 1 2 5 6 6 11 14 3 48
Prosthodontics Study
Design
Case Report 0 2 1 0 3
Other 1 2 3 2 8
Total 1 4 4 2 11
N/A Study
Design
Case Report 0 2 1 0 1 0 3 0 7
Case Series 0 0 0 0 0 0 1 0 1
Cross-sectional 0 0 0 0 0 1 0 2 3
Other 1 2 6 19 11 28 17 4 88
Total 1 4 7 19 12 29 21 6 99
Totals for all clinical
disciplines