Master Thesis
Systematic comparison of decision accuracy of complex decision rules combining
multiple measures in a higher education context
Iris Yocarini – s1495402
Faculty of Social Sciences, Psychology
Leiden University
Abstract
A new compensatory decision rule was introduced in the first year of Psychology at the
Erasmus University Rotterdam. Given that a conjunctive testing system is considered
standard practice in the Netherlands, this introduction sparked a debate. This study
investigates the decision accuracy of different complex decision rules having varying
compensatory and conjunctive aspects by simulating true and observed score distributions.
Addition, the influence of several factors related to the measures and setting is evaluated. The
results indicate that the accuracy of a decision, as indicated by a decisions’ sensitivity,
specificity, proportions of misclassifications, and positive predictive value, depends on the
degree of compensation allowed as well as several factors related to the tests and setting. The
results show that the decision accuracy of a complex compensatory decision rule depends on
both the minimum grade that is required (the conjunctive aspect), the required GPA (the
compensatory aspect) and the specific combination of both. Overall, within a complex
compensatory decision rule the sensitivity is higher and the specificity lower, meaning that
false positives are more likely than false negatives. For a conjunctive decision rule the
reverse is true. Which rule is more accurate by means of less classification errors depends on
the rule as well as the average test reliability, average test correlation, and the number of
retakes that are allowed. Taken together, the differences in decision accuracy illustrate the
importance of evaluating decision accuracy when making a high stake decision, considering
both the specific rule as well as the selected measures.
Keywords: high stake decision, multiple measures, conjunctive decision rule,
In the academic year of 2011-2012 a new compensatory testing system was
introduced in the first year of the Psychology bachelor at the Erasmus University Rotterdam
in the Netherlands. In this compensatory testing system students are allowed to compensate,
within certain boundaries, a low test score of one course with a high test score of another
course. Contrary, students in a conjunctive testing system are required to pass each individual
course (Chester, 2003). Given that a conjunctive testing system is commonly applied in
higher education programs in the Netherlands, the introduction of this new compensatory
testing system has been ground for some debate, as well as media coverage (e.g. Arnold &
Van den Brink, 2012). This media coverage has partly been sparked by the additional
condition in which students are required to obtain all 60 ECTS1 to progress to the second year
of their studies (Vermeulen et al., 2012). If this requirement is not met, students have to leave
the bachelor program. As a result, the average grade resulting from the compensatory testing
system serves as a decision-making tool in a situation in which the stakes are high.
Consequently, the accuracy of this decision is of great importance and is under study in this
paper.
The aim of this paper is to compare the decision accuracy of the complex decision
rules adopted in different and realistic testing systems in a Dutch higher education
curriculum. Comparing the decision accuracy of these testing systems implies comparing the
degree of erroneous decisions made based on the testing system applied (Douglas & Mislevy,
2010). One such erroneous decision is a false-positive, in which a student is allowed to
continue to the second year while not being proficiently skilled. The other is a false-negative,
which occurs when a student is not allowed to progress to the second year of the bachelor
when he or she is actually competent. Hereby, the newly introduced compensatory testing
system in first year Psychology of the Erasmus University will serve as a point of departure
and will be contrasted with a situation in which a fully conjunctive decision rule is applied (as
is the case in for example the first year of the bachelor Psychology at Leiden University).
Notably, the decision rules applied in a higher education curriculum are rarely completely
conjunctive or compensatory but rather a combination (Rekveld & Starren, 1994; Wilbrink,
1995; Douglas & Mislevy, 2010). This is true for the compensatory testing system applied at
the Erasmus University Rotterdam as well. More specifically, students are allowed to
compensate a grade with a minimum of 4.0 (out of 10) and are required to have a grade point
average (GPA) of 6.0 (unrounded) to pass2. Given that a purely compensatory testing system
is not commonly applied in educational settings, a complex decision rule combining a
compensatory rule with a conjunctive one will be referred to as a compensatory rule.
In the following sections the factors influencing the decision accuracy, i.e. validity of
an average grade as a decision-making tool, are evaluated. Hereby, a distinction is made
between factors influencing the reliability of a test, which indirectly affect the decision
accuracy through test reliability, and the factors influencing the decision accuracy directly.
Reliability
Several arguments motivated the implementation of a new compensatory system at
the Psychology bachelor at the Erasmus University Rotterdam. Most of these are based on
educational views (see e.g. Rekveld & Starren, 1994, for an overview). In this paper,
however, focus is on the psychometric argument for choosing the average grade as a
decision-making tool (Arnold & Van den Brink, 2009; Arnold, 2011; Vermeulen et al.,
2012). This argument stems from classical test theory (CTT). Namely, within the CTT
framework it is assumed that each individual observed test score, X, consists of someone’s
true score, T, and random measurement error, E (Lord & Novick, 1968):
= + .
Translating this to our situation, X is a student his or her grade on a course and T is a
student’s unobserved true ability and knowledge of this introductory psychology course. Put
another way, the true score would be the grade obtained if the test would be perfectly precise
(Furr & Bacharach, 2014). Importantly, in CTT it is assumed that the measurement error is
random. Consequently, for some students error leads to an observed score that is an inflation
of his or her true knowledge whereas for other students measurement error leads to a
deflation. Because of the random inflation and deflation, measurement error is assumed to
cancel out across n respondents or across k parallel tests when n or k approaches infinity (Furr
& Bacharach, 2014). When measurement error is lower, a test is more reliable. In other
words, with repeated test administration a student his or her observed score will be more
consistent. Consequently, it is argued that using an average exam score, in which error
measurement is expected to largely cancel out, will be more reliable than using the results of
individual exam scores, which each independently contain measurement error (Vermeulen et
al., 2012).
However, some serious caution is required here. In the framework of CTT the
assumption of parallel tests needs to be met. This assumption requires the variance of the true
scores and error variance to be equal across tests. Since the reliability of a test is a function of
the true score and error variance, the reliability of each parallel test is similar as well. This
also applies to the correlation between the tests, which are equal to the reliability in parallel
tests (Furr & Bacharach, 2014). Furthermore, in CTT it is assumed that measurement error
variance within a test is equal for each true score (Drenth & Sijtsma, 2006). More
specifically, CTT assumes measurement error to be uncorrelated to one’s true score (Lord &
Novick, 1968):
= 0.
These assumptions are problematic in practice. Firstly, in practice, tests have their
own reliability disputing the assumption of parallel tests. Secondly, in many first year
Psychology curricula multiple-choice tests are administered. In taking these multiple choice
tests, students with low true scores are expected to guess more often and therefore be
relatively more influenced by random measurement than students with high true scores.
Consequently, the assumption that measurement error variance is unrelated to one’s true
score is questionable given the type of tests administered in practice. Thirdly, in practice, the
number of n respondents or k parallel tests might be large, yet often does not reach infinity.
Importantly, the requirements of equal true score, equal error variance, similar reliabilities
and correlations to meet the assumption of parallel tests coincide. This concurrence makes it
difficult to theoretically deduce the effects of these violations of the CTT assumptions in
practice on the reliability of an average grade. Naturally, concluding that average grades are
more reliable, prior to analyzing the effects of these violations, would be too premature.
Therefore, simulations are performed in this study to investigate these effects.
Decision Accuracy
The psychometrical argument for using an average grade as a decision-making tool as
presented above mainly concerns the reliability of the average grade. As mentioned, different
factors directly influence the reliability of the average test score; namely, the correlation
among tests, individual test reliability, and the number of tests. Indirectly, through their effect
average grade as a decision-making tool in high-stake decisions. If, for example, the average
grade is unreliable, more measurement error is included in the average grade and it will
consequently provide less consistent information about a student his or her true score.
Subsequently, the decision accuracy of using the unreliable test score will be lower as more
uncertainty is included in the observed test score compared to the true score. Because of this
increased discrepancy between the true and observed score it is more likely that the decision
based on the observed and true score differ. This misalignment in decisions constitutes a
decisional error, i.e. false positives and false negatives.
In addition to these indirect influences on decision accuracy, several other factors
relevant in a testing system directly influence the validity of an average grade as a
decision-making tool. One such factor is the number of tests a student is allowed to retake. If a student
is allowed to retake a test it is assumed that regression to the mean will occur and a student
will obtain an observed score that is closer to his or her true score. Consequently, it is
expected that the number of misclassifications, i.e. false positives and false negatives, will
decrease using the average grade. Although it is expected that the total proportion of
misclassifications will decrease, retakes are expected to increase the false positives and
decrease the false negatives. To clarify this, keep in mind that a retake is only relevant to
those students who failed. In this group of students who failed there are those students who
rightly failed, i.e. their true score is below the cut off score, and those students who unjustly
failed, i.e. their true score is above the cut off score. For those students who rightly failed,
having a retake gives them another opportunity to be positively influenced by measurement
error which might result in a pass and hence a false positive. On the other hand, those
students who unjustly failed before, i.e. false negative, and have another opportunity to pass
will, through the mechanisms of regression to the mean, more likely score closer to their true
score. Since their true score is higher than the cut off score, the false negatives will more
likely turn into a correct classification. In addition, the required average and minimum grade
influence the decision accuracy of a testing system as well. Misclassifications are especially
present for true scores close to the cut-off score, i.e. minimum and average required grade
(Van Rijn, Béguin, & Verstralen, 2009).
Given all these possible influences, it is important to realize that the use of multiple
measures does not necessarily guarantee that a more accurate decision is made (Chester,
2003; McBee, Peters, & Waterman, 2014). Overall, empirical support for the psychometrical
assumptions might not hold in practice. Additionally, given the complexity of many factors
and combinations of them found in practice, reasoning the effects theoretically is impossible.
Hence, this study is needed to analyze the influence of these factors and evaluate whether, or
under which conditions, the psychometrical argument is justified and using a compensatory
decision rule results in a more accurate decision. For this reason, a simulation study is
performed in which the individual factors are systematically manipulated.
Previous Studies
Several studies exist that already tested the decision accuracy of different
combinations of multiple measures as well as the influence of different factors on the
decision accuracy of these combinations, like the number of tests and opportunities to pass, as
well as the magnitude of test reliability and correlations. Overall, these studies show that
using different decision rules, i.e. compensatory, conjunctive, or combinations, results in
different degrees of decision accuracy. Lord (1962) was the first to study the decision
accuracy when using multiple test scores by means of a simulation study. From his
simulations, Lord (1962) concluded that in the face of fallible measures one better opts some
sort of compensation rather than using multiple cutting scores, i.e. a purely conjunctive
decision rule. More recently, Douglas and Mislevy (2010) looked at complex decision rules
and showed that using a combination of a conjunctive, i.e. minimum score, and a
compensatory decision rule, i.e. more stringent overall average, results in less decision errors
made compared to a purely conjunctive rule, in terms of both false negatives and false
positives. Furthermore, Van Rijn, Béguin, and Verstralen (2012) evaluated the implications
of different decision rules in the context of Dutch secondary education and showed that
having individual requirements, i.e. conjunctive aspects, resulted in a higher percentage of
misclassification compared to adding a condition that is a combination of the individual
requirements.
In addition to different decision rules, the influence of several factors on the
decisional accuracy of these combinations has been studied. For example, McBee et al.
(2014) performed a study of decision accuracy in the context of the identification of gifted
students and evaluated the consequences of test reliability and correlations among tests. Their
study shows that given their decision rule (which combines several scores by means of a
conjunctive and a complementary rule, i.e. ‘or’ rule) lower test correlations and test reliability
more false negatives existed than false positives. In addition to the influence of test reliability
and test correlation, other influences on decisional accuracy have been studied. For example,
Douglas and Mislevy (2010) investigated the effect of the number of tests and number of
opportunities to pass. They showed that the number of false negatives and false positives was
higher for a conjunctive decision rule compared to a compensatory rule and that this effect
was exaggerated when more tests were used. In addition, their study showed that increasing
the number of opportunities to pass increased the false positive rates. Notably, with three
retakes, no false negatives were present in case of a compensatory decision rule. Although
each study gives some insight in the effect of different practical considerations, such as the
number of tests, each of the studies is confined to a specific testing situation and specific
decision rules. This complicates generalization to other situations.
To gain more understanding in the effect of each of the factors influencing decision
accuracy directly or indirectly and its combinations, this simulation study systematically
combines them and evaluates different decision rules. Specifically, the total number of
individual tests, the number of tests that may be retaken, the test reliability, and correlations
among tests are varied. Moreover, the studied decision rules differ in their degree of
compensation allowed, i.e. average grade required, as well as the conjunctive requirements,
i.e. allowed minimum grade. Hereby, several hypotheses are formulated. It is hypothesized
that more misclassifications will occur when the required average and minimum grade
increase toward the average true score as misclassifications are especially present for true
scores close to the cut-off score (Van Rijn et al., 2009). Overall, in line with previous studies,
it is predicted that more decision errors will be made using a conjunctive decision rule vs. a
compensatory decision rule. Furthermore, it is expected that lower test reliabilities will result
in more classification errors. This is hypothesized as lower test reliability implies more
measurement error is involved. As mentioned, more measurement error results in higher
discrepancies between the true and observed test scores and consequently different decisions
based on the true versus observed test scores, i.e. misclassifications, are more likely. Lower
correlations among tests is hypothesized to result in more misclassifications, as found by
McBee et al. (2014). In line with Douglas and Mislevy (2010) their results, it is hypothesized
that increasing the number of tests decreases the misclassifications made for compensatory
decision rules. Alternatively, for the conjunctive decision rule, the false negatives are
predicted to increase with the number of tests. With increasing the number of tests it is
administration might deflate an individual observed test score, resulting in a false negative.
Finally, following Douglas and Mislevy (2010) and the previously mentioned discussion on
the expectations regarding the number of retakes and the decision accuracy, increasing the
number of retakes allowed is expected to decrease the overall proportion of misclassification.
Specifically, it is hypothesized that the false negative rate decrease whereas the false positive
rate is hypothesized to increase.
Methods
Simulation Model
The simulations performed in this study were in line with the simulation method
developed by Douglas (2007) as applied in Douglas and Mislevy (2010). Broadly, the
simulations were structured through the following steps:
1. Simulate true score distributions for each test.
2. Simulate observed scores for each student by simulating error around true scores.
3. Simulate replicate scores for retakes.
4. Evaluate decision accuracy by computing appropriate indices.
Firstly, true score, T, distributions were simulated for each test. Hereby, the mean of T
was assumed to vary for each course. A realistic mean true score was estimated from the data
of test scores of eight introductory psychology courses at the Erasmus University and used to
sample true score means for each test. The same was done for the true score variance, which
was also estimated from the available data. However, the true score variance was assumed to
be equal across tests, meaning that the true scores were assumed to vary by the same amount
within each course. Importantly, the true scores were truncated between 1.0 and 10.0, to
mimic the Dutch higher education grading system. Given that the tests were correlated, the T
distributions were simulated from a multivariate truncated normal distribution. For a detailed
outline on the simulation procedure and a sample code of the simulations performed using R
(R Core Team, 2015), see Appendix A.
Correlation between tests. The correlation between two tests is a standardized
measure of the degree of association between the tests. In other words, it is the degree to
which two tests measure the same underlying construct. In the context of a first year
Psychology curriculum, the test correlations indicate the degree to which each course
taking the first year Psychology at Erasmus University as an example, a realistic average
correlation between courses was .3. In addition, the correlation was manipulated to be .1, .3
.5, or .7. In addition to looking at more or less cohesion in test scores (.1, .5), a correlation of
.7 was also evaluated as one might choose to allow compensation within certain clusters only.
Within such a cluster it might occur that the correlation between test scores is as high as .7.
Reliability of test scores. Secondly, the observed scores were produced by simulating
error around the previously simulated true scores. Within the simulation of the error, the
reliability of the tests was incorporated to test its effect on decision accuracy. The reliability
of a test is equal to the ratio of variance in true score to the variance in observed scores (Furr
& Bacharach, 2014);
= = .
Since we knew the variance in true scores, we could derive the error variance for different
values of the test reliability by rearranging the formula. This error variance was subsequently
used in simulating the observed scores. In addition to having the reliability incorporated in
defining the error variance, the error variance was assumed to vary for each true score.
Although, CTT assumes measurement error to be uncorrelated to someone’s true score, this
has been disputed. As mentioned, in multiple choice tests, students with a low true score are
predicted to guess more and therefore be relatively more influenced by random measurement
error than students with high true scores. Therefore, in these simulations, error variance, ,
was assumed to depend on one’s true score. Specifically, the error variance derived from
using the formula for test reliability applied to an average true score. For true scores above or
below the average true score, the error variance was an inverse linear function of the true
score, in which error decreased for high true scores and increased for low true scores.
Similarly, the test reliability that was incorporated in the true scores, applied to the reliability
of the test for someone with an average true score. As a consequence of varying the error in
relation to someone’s true score, test reliability changed as well. This follows from the
function above; test reliability is a function of both true score variance and error variance.
Hereby, test reliability was lower for true scores that lie below the average true score. To
investigate the effect of high and low test reliabilities, the values .4, .6, and .8 were simulated
as being the point estimate of the test reliability at an average true score. Overall, the mean
true score variance, and consequently the mean measurement error, was kept constant across
Number of tests and number of tests allowed to retake. Finally, to study the
influence of the number of tests that a student is allowed to retake, replicate observed scores
were drawn as well. For these scores, it was assumed that someone’s true score had increased
between the first test administration and the retake as students gained knowledge within this
time interval. An estimate of the increment in true score was obtained from available data of
retakes taken by first year Psychology students at the Erasmus University Rotterdam. To
analyze the influence of the number of tests a student is allowed to retake, two situations
were simulated; no vs. two tests allowed to retake. In addition to varying the number of tests
allowed to retake, the number of tests were also varied. Hereby, it was chosen to simulate 8
or 12 test scores. Both situations were realistic in a first year Psychology curriculum;
Erasmus University Rotterdam for example has eight courses, whereas the curriculum at
Leiden University includes twelve courses.
Measure of Decision Accuracy
Based on the true and observed scores and a pass or fail outcome, four possible
decisional classifications exist, which are displayed in Table 1. The decision accuracy of
using different decision rules was evaluated by looking at the misclassifications made. As
mentioned, misclassifications can exist in the form of false negatives and false positives.
Notably, as Van Rijn et al. (2012) point out, an evaluation based on the absolute number of
errors is not appropriate as a measure of decision accuracy as these are population dependent.
Therefore, relative indices of decision accuracy were evaluated. Firstly, the sensitivity was
evaluated. This is the conditional probability that someone who has the appropriate true score
is identified as such, i.e. passes (McBee et al., 2014):
> | > ) = & )
) .
Here, c indicates a cutoff score. Put differently, it is the proportion of those who are correctly
classified to pass of those who are eligible to pass based on their true score. With this
sensitivity rate the probability of a false negative can be easily obtained, as it equals one
minus sensitivity (McBee et al., 2014). Another measure of agreement was the specificity
measure, a conditional probability indicating correct classification of fails (Van Rijn et al.,
2012). This is the proportion of persons who were correctly identified as fails from those who
have a true score that indicates a fail:
< | < ) = & )
Likewise, the probability of false positive can be obtained from the specificity measure by
subtracting the specificity rate from one (McBee et al., 2014). Furthermore, an overall
measure of misclassification was included. This is the proportion of persons in the
misclassification quadrants in Table 1, relative to the overall population:
< | > & > | < ) = < | > ) + > | < ).
Finally, the positive predictive value was included (Van Rijn et al., 2012). This is the
proportion of students who justly passed from all the students who passed.
> | > ) = & ) ).
Table 1
Classification Decisions
Decision based on true score Decision based on observed score Fail Pass
Fail Correct classification Misclassification
False negative
Pass Misclassification
False positive
Correct classification
Decision Rules
Overall, Chester (2003) distinguishes different categories of decision rules for
combining multiple measures; such as the conjunctive, compensatory, and mixed
conjunctive-compensatory rules. As explained, in educational practices most decision rules
use a combination of conjunctive and compensatory rules, resulting in a complex mixed
decision rule. In this study, different decision rules were evaluated. Hereby, the situation as
applied in first year Psychology at the Erasmus University Rotterdam functioned as an
example of a realistic complex compensatory decision rule. Each of the compensatory
decision rules were contrasted with a conjunctive decision rule as is commonly applied in
Dutch higher education.
By studying this specific situation, multiple assumptions were made concerning the
setting, i.e. the students and structure of the program. Overall, first year psychology students
at the Erasmus University Rotterdam follow eight courses, subdivided into a knowledge and
practical component. This study focused on the knowledge tests as more course credits are
is allowed to their second year of study. In total, students complete eight knowledge tests that
have a multiple choice format. Each of these courses gives an introduction into psychology.
As mentioned, students are required to have a GPA of 6.0 with each test score being at least
4.0 at the end of their first year. Hereby, students are allowed to compensate a grade with a
minimum of 4.0 with higher grades on other courses. Also, if their GPA is below 6.0,
students are allowed to retake a course. In total, the number of retakes is restricted to two
knowledge tests (Vermeulen et al., 2012). These retakes are planned at the end of the
academic year.
In addition to this baseline situation, the effect of a higher or lower required GPA and
higher or lower required minimum grade within compensation on decision accuracy was
evaluated. This is interesting as a misclassification becomes more likely for true scores close
to the cut-off score (Douglas, 2007). Testing this effect systematically was achieved by
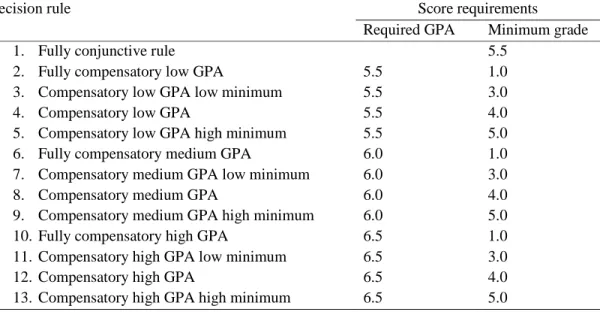
evaluating several additional decision rules, which are displayed in Table 2. Notably, as the
test scores were allowed to range between 1.0 and 10.0, requiring a minimum grade of 1.0 is
similar to using a completely compensatory rule, as only the required GPA is relevant in
these situations.
Table 2
Decision Rules
Decision rule Score requirements
Required GPA Minimum grade
1. Fully conjunctive rule 5.5
2. Fully compensatory low GPA 5.5 1.0
3. Compensatory low GPA low minimum 5.5 3.0
4. Compensatory low GPA 5.5 4.0
5. Compensatory low GPA high minimum 5.5 5.0
6. Fully compensatory medium GPA 6.0 1.0
7. Compensatory medium GPA low minimum 6.0 3.0
8. Compensatory medium GPA 6.0 4.0
9. Compensatory medium GPA high minimum 6.0 5.0
10. Fully compensatory high GPA 6.5 1.0
11. Compensatory high GPA low minimum 6.5 3.0
12. Compensatory high GPA 6.5 4.0
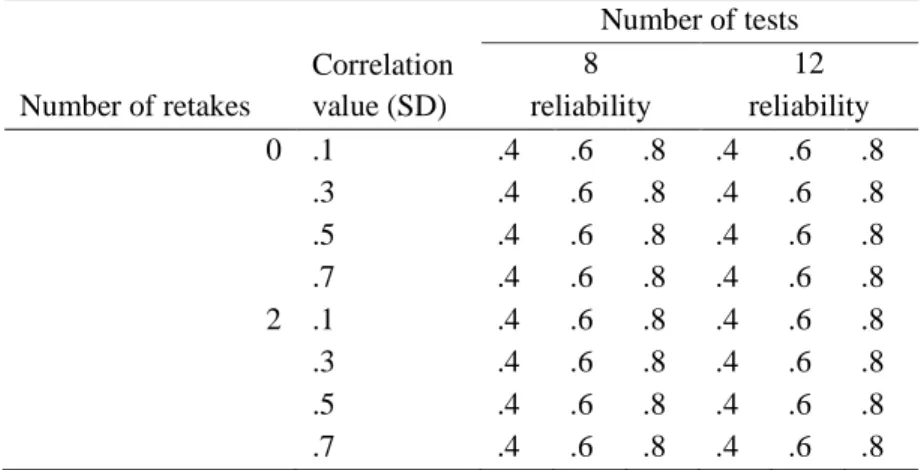
Table 3
Simulation Contexts
Number of retakes
Correlation value (SD)
Number of tests
8 12
reliability reliability 0 .1 .4 .6 .8 .4 .6 .8
.3 .4 .6 .8 .4 .6 .8 .5 .4 .6 .8 .4 .6 .8
.7 .4 .6 .8 .4 .6 .8
2 .1 .4 .6 .8 .4 .6 .8 .3 .4 .6 .8 .4 .6 .8 .5 .4 .6 .8 .4 .6 .8
.7 .4 .6 .8 .4 .6 .8
Furthermore, the consequences of varying the number of tests, test reliabilities, test
correlations, and varying the number of retakes allowed were evaluated. In total 48
conditions existed under which simulations were performed, as indicated by Table 3. In each
of these simulations an average classification table was obtained from 500 datasets of 1000
students for each of the 13 decision rules described in Table 2. Subsequently, four outcome
measures were computed from these classification tables to assess the accuracy of each
decision, namely the sensitivity rate, specificity rate, total proportion of misclassifications,
and the positive predictive value. In discussing the results, the decision accuracy of the
decision rules was considered most important, i.e. assessing the influence of the required
GPA and minimum grade. Subsequently, the influence of the different factors, i.e. test
correlation, test reliability, number of tests, and number of retakes were evaluated for the
different compensatory decision rules. Finally, a comparison between the compensatory and
conjunctive decision rules was made based on the mean values on each of the outcome
measures. For those interested, the specific values of each accuracy measure across several
factors are displayed in the tables in Appendix B.
Data as Basis for Simulations
Data from three cohorts of first year Psychology students at the Erasmus University
Rotterdam was used to estimate the necessary values. Specifically, data was obtained from
246 students in cohort 2011, 245 students in cohort 2012, and 330 students in cohort 2013.
Notably, these samples only contained students who had obtained at least one test score
sample of students are provided in Table 4. These statistics were used to compute the true
score mean and its standard deviation, as well as the mean variance of true scores over all
tests.
Table 4
Descriptive Statistics Sample
Introductory psychology courses
Statistic 1 2 3 4 5 6 7 8
Mean (SD) 5.89 (1.16)
6.70 (1.34)
6.11 (1.70)
6.85 (1.26)
6.71 (1.20)
6.64 (1.11)
6.77 (1.15)
6.43 (1.04) Min- Max 1.9- 9.3 1.0- 10.0 1.0- 10.0 2.0- 9.7 2.3-9.7 2.9- 10.0 1.8- 9.8 3.1- 9.5
N 817 797 758 727 719 706 687 678
Results
To check whether the correlations between the tests were manipulated adequately, the
resulting average correlation was compared to the input correlation for each of the simulated
datasets; for the simulations with a correlation r = .1, the average resulting correlation was r
= .19, for the r = .3 simulations it was r = .37, for the r = .5 simulations it was r = .54, and
finally for the r = .7 simulations the simulated datasets had an average correlation of r = .72.
Although slight differences in correlations between the input and resulting dataset existed,
these were small and the simulated datasets still differed sufficiently from one another to look
at the effect of test score correlations. Notably, these differences exist because of the
truncation and the algorithm used to sample the truncated multivariate distribution (see
Appendix A for a more elaborate explanation).
Factors Influencing Sensitivity
Table 4 shows the mean sensitivity rates for each of the thirteen decision rules. In
addition, the mean sensitivity rate is reported for each decision rule for each of the factors
that were manipulated in the simulations. To simplify interpretation, colors illustrate the
height of the degree of accuracy; the darker the shades of grey in a cell, the higher the
sensitivity rate, and the higher the accuracy of the decision. Looking at the overall mean
sensitivity shows that the fully compensatory decision rules, in which the required minimum
grade equals one, resulted in the most accurate decisions. With increasing the required GPA
in a fully compensatory decision rule, the sensitivity slightly decreased, while increasing the
sensitivity. Given a specific required GPA, increasing the required minimum grade towards
the average population true score decreased the sensitivity of a decision. Overall, the results
show that the required minimum grade is more important in determining the sensitivity
within a compensatory decision rule than the required GPA.
Looking at the influence of the factors shows that the influence of the test correlation
was only small or not present. For the fully compensatory decision rules the positive
influence of the test correlation was very small or not present. Although the influence
remained small, the positive influence of the test correlation appeared when the required GPA
increased towards the average population true score. For compensatory rules with a
conjunctive aspect, the test correlation became more important in determining the decision
accuracy when the minimum required grade increased towards the average population true
score. Secondly, the effect of the average test reliability was positive as well. Remarkably,
almost no differences in accuracy existed between the compensatory decision rules if the
average test reliability was high. Contrary, for a low to medium test reliability, the influence
of the average test reliability differed across decision rules. Comparable to the average test
correlation, the positive influence of the test reliability was largest when the minimum
required grade was closest to the average population true score. The influence of the
reliability slightly increased with increasing the required GPA for fully compensatory
decision rules. However, the positive influence of the test reliability became smaller with
increasing the required GPA when a conjunctive aspect was added rule. Thirdly, there was a
very small negative to none influence of the number of tests included in a curriculum. This
small negative influence was mostly present when the required minimum grade was high and
the required GPA low. Finally, the number of retakes allowed was important in determining
the sensitivity rate of a compensatory decision rule; with allowing two retakes the sensitivity
rate of a compensatory decision increased. The influence of the number of retakes was
smallest for fully compensatory decision rules in which increasing the required GPA resulted
in a slight increase in the influence of the number of retakes. However, the minimum required
grade was more important in determining the sensitivity, where the influence of the retakes
was highest for minimum grades closer to the average population true score. For mixed
compensatory decision rules, the influence of the number or retakes given a specific
minimum grade slightly decreased with increasing the GPA.
Conclusion. Overall, the results illustrate that the minimum required grade was most
grade the lower the sensitivity. The required GPA had a similar negative influence, yet to a
smaller extent. Additionally, given the GPA and minimum required grade, the average test
reliability, test correlation, and numbers of retakes allowed had a positive influence.
Contrary, the number of tests had a slightly negative or no influence on the sensitivity. The
average test reliability and the number of retakes had the strongest influence on the
sensitivity, followed by the average test correlations. Hereby, the influence of the factors
increased if the minimum required grade increased as well. Remarkably, if test reliability was
high or two retakes were allowed sensitivity was high for each of the compensatory decision
rules.
Table 4
Mean Sensitivity Rate for Decision Rules and Different Factors
D ec is io n R u le G P A M in im u m Mean Sensitivity Average Test Correlation Average Test Reliability Number of Tests Number of Retakes
.1 .3 .5 .7 .4 .6 .8 8 12 0 2 1 5.5 .62 .55 .61 .65 .68 .36 .64 .86 .66 .62 .48 .76 2 5.5 1 .97 .97 .97 .97 .97 .94 .98 .99 .97 .97 .95 .99 3 5.5 3 .88 .86 .87 .89 .91 .73 .93 .99 .90 .88 .81 .96 4 5.5 4 .79 .75 .77 .8 .82 .56 .84 .96 .82 .79 .67 .90 5 5.5 5 .67 .61 .66 .69 .71 .41 .69 .9 .71 .67 .53 .8 6 6 1 .95 .94 .94 .95 .95 .9 .95 .98 .94 .95 .92 .97 7 6 3 .89 .86 .88 .9 .92 .75 .93 .98 .9 .89 .82 .96 8 6 4 .81 .76 .79 .83 .86 .6 .86 .96 .84 .81 .7 .91 9 6 5 .68 .62 .66 .7 .73 .42 .71 .91 .72 .68 .54 .82 10 6.5 1 .92 .89 .92 .93 .94 .86 .93 .97 .92 .92 .88 .96 11 6.5 3 .89 .85 .88 .9 .92 .78 .92 .97 .89 .89 .82 .95 12 6.5 4 .84 .78 .82 .86 .89 .67 .88 .96 .85 .84 .74 .93 13 6.5 5 .72 .64 .7 .74 .79 .47 .76 .92 .76 .72 .59 .85
Factors Influencing Specificity
The results for the specificity of the different decision rules are displayed in Table 5.
As the results illustrate, the decision became more accurate with increasing the minimum
required grade. Increasing the GPA towards the average population true score, given a certain
minimum grade, resulted in a slight increase in the specificity. However, this positive
influence of the GPA was not present when the minimum grade was closest to the average
been achieved. As with the sensitivity, the minimum required grade had a higher influence on
the specificity of a compensatory decision than the required GPA.
Looking at the positive influence of the test correlation, the results illustrate that the
specificity increased most with increasing correlations for a fully compensatory decision rule.
Overall, increasing the GPA did not alter the influence of the test correlation. An exception
exists for the fully compensatory decision rules, in which increasing the GPA decreased the
positive influence of the test correlation. Given a specific GPA, increasing the required
minimum grade also decreased the influence of the test correlation on the decision accuracy.
Secondly, there was a positive influence of the test reliability which was strongest when a
fully compensatory decision rule was applied. Remarkably, when a conjunctive aspect was
added to the decision rule, the influence of the test reliability became considerably smaller.
This difference in the influence of the test reliability for different minimum grades was most
pronounced when the required GPA was low. In this case, there was almost no influence of
the test reliability and its influence was almost independent of the minimum required grade.
Thirdly, increasing the number of tests slightly increased the specificity of a compensatory
decision rule. Hereby, the influence of the number of tests seemed almost independent of the
required GPA and slightly increased with increasing the minimum required grade. Finally, a
negative influence of allowing tests to be retaken was present; with allowing retakes, the
specificity decreased. The influence of the number of retakes decreased as the minimum
grade increased towards the average population true score. Depending on the minimum
grade, a very small difference in the influence of the retakes existed for different GPAs; at
low minimum grades the influence of the number of retakes slightly decreased with higher
GPAs while this effect was reversed at higher minimum grades and the influence of the
number of retakes slightly increased.
Conclusion. The results show that the specificity of a compensatory decision rule
was lower than the sensitivity; meaning that relatively more false positives existed than false
negatives in a compensatory decision rule. Here, the minimum required grade was more
important in determining the specificity rate than the required GPA; the higher the minimum
grade the more accurate a decision. Furthermore, the test reliability and number of retakes
had the strongest influence on the specificity. Followed by the test correlation and a slight
influence of the number of tests. Except for the number of retakes, each of the factors had a
positive influence on the specificity. Consequently, with allowing tests to be retaken, the
Table 5
Mean Specificity Rate for Decision Rules and Different Factors
D ec is io n R u le G P A M in im u m Mean Specificity Average Test Correlation Average Test Reliability Number of Tests Number of Retakes
.1 .3 .5 .7 .4 .6 .8 8 12 0 2 1 5.5 .93 .92 .92 .93 .94 .93 .91 .94 .91 .95 .96 .90 2 5.5 1 .66 .58 .65 .69 .72 .49 .65 .84 .65 .67 .75 .57 3 5.5 3 .77 .71 .76 .79 .81 .77 .69 .84 .74 .79 .86 .68 4 5.5 4 .83 .78 .82 .86 .88 .87 .78 .85 .81 .85 .89 .77 5 5.5 5 .9 .87 .89 .91 .93 .91 .87 .91 .88 .92 .93 .86 6 6 1 .72 .65 .71 .75 .77 .56 .72 .89 .71 .73 .8 .64 7 6 3 .78 .72 .77 .8 .82 .71 .73 .89 .76 .8 .87 .69 8 6 4 .83 .79 .83 .85 .86 .83 .78 .89 .81 .86 .9 .76 9 6 5 .9 .87 .89 .91 .92 .91 .87 .91 .88 .92 .94 .86 10 6.5 1 .79 .74 .79 .81 .83 .63 .8 .94 .78 .8 .86 .72 11 6.5 3 .81 .77 .81 .83 .84 .7 .81 .94 .8 .83 .89 .74 12 6.5 4 .85 .81 .84 .86 .87 .78 .82 .94 .83 .87 .92 .78 13 6.5 5 .9 .88 .9 .91 .92 .9 .87 .94 .88 .92 .95 .86
Factors Influencing Proportion of Misclassifications
Table 6 reports the proportion of misclassifications for each of the decision rules and
the different factors. The darker the shade of grey the less classification errors were made and
the higher the accuracy of the decision. The mean proportion of classification errors was
lowest when a fully compensatory decision rule was used. Increasing the GPA towards the
average population true score resulted in more classification errors. Similarly, increasing the
minimum required grade given a specific GPA increased the classification errors as well.
Notably, the influence of the minimum required grade in determining the decision accuracy
was considerably higher when the GPA was low compared to when a high GPA was
required. Overall, the minimum grade seemed more important in determining the mean
proportion of classification errors than the required GPA.
Furthermore, the influence of the test correlation on the total proportion of decisional
errors was mostly negative; with increasing the test correlations a decision became more
accurate. The influence of the test correlation became larger with increasing the required
GPA. Increasing the test correlation seemed to have a slightly nonlinear relation with the
minimum required grade; for low minimum grades the influence of the test correlations was
closest to the average true score in the population the influence of the test correlation on the
proportion of misclassifications became smaller again. This nonlinear relation was mostly
visible at a low required GPA. Secondly, a negative influence of the test reliability on the
proportion of misclassifications was clearly apparent. If a fully compensatory decision rule
was applied, the test reliability was least important in determining the proportion of errors.
Within fully compensatory rules, the influence of the test reliability slightly increased with
higher required GPAs. As the minimum grade required increased, the influence of the test
reliability became more pronounced. Here, the influence of the test reliability remained
strong yet decreased with increasing the required GPA. Furthermore, Table 6 shows that the
influence of the number of tests on the proportion of errors was almost non-existent. It
became slightly negative when the required GPA was close to the average population true
score. Alternatively, if the GPA was lower, there was a slight positive influence of the
number of tests, which increased a little with increasing the minimum grade. Finally, when
retakes were allowed the proportion of classification errors was lower than when no tests
could be retaken. Here, the influence of the number of retakes was very small if a fully
compensatory decision rule was applied. With increasing the minimum grade required, the
negative influence of the number of retakes increased as well. Given a minimum grade,
increasing the required GPA resulted in a smaller negative influence of the retakes.
Conclusion. The proportion of misclassifications increased if the GPA and minimum
grade increased. Overall, the proportion of errors was lowest when a fully compensatory
decision rule was used and increased when a conjunctive aspect was added to the decision
rule. However, the influence of the minimum grade strongly depended on the required GPA;
the higher the GPA the lower the influence of the minimum grade. Furthermore, the test
reliability had the highest negative influence on the proportion of misclassifications, followed
by the number of retakes allowed and the test correlations. Here, the influences increased
with increasing minimum grades given a required GPA and mostly decreased with higher
Table 6
Mean Proportion of Misclassifications for Decision Rules and Different Factors
D ec is io n R u le G P A M in im u m Mean Proportion Errors Average Test Correlation Average Test Reliability Number of Tests Number of Retakes
.1 .3 .5 .7 .4 .6 .8 8 12 0 2 1 5.5 .17 .16 .17 .18 .19 .27 .17 .08 .18 .17 .19 .16 2 5.5 1 .05 .03 .05 .06 .06 .09 .05 .02 .05 .05 .06 .04 3 5.5 3 .12 .14 .13 .12 .10 .27 .08 .02 .11 .14 .19 .06 4 5.5 4 .20 .24 .22 .19 .17 .40 .16 .05 .18 .23 .29 .11 5 5.5 5 .23 .23 .23 .22 .22 .37 .22 .09 .22 .23 .28 .17 6 6 1 .10 .09 .10 .10 .09 .16 .09 .04 .10 .09 .11 .08 7 6 3 .13 .16 .14 .12 .11 .25 .11 .04 .12 .14 .17 .09 8 6 4 .18 .23 .19 .16 .14 .34 .15 .05 .16 .19 .24 .12 9 6 5 .22 .23 .22 .21 .20 .36 .21 .08 .21 .22 .27 .17 10 6.5 1 .13 .16 .14 .12 .11 .23 .13 .05 .14 .13 .13 .13 11 6.5 3 .14 .17 .14 .12 .11 .24 .13 .05 .14 .14 .14 .13 12 6.5 4 .15 .19 .16 .14 .12 .26 .14 .05 .15 .15 .17 .13 13 6.5 5 .17 .20 .18 .17 .14 .29 .17 .06 .17 .18 .20 .15
Factors Influencing Positive Predictive Value
The positive predictive values for each of the decision rules and factors are reported in
Table 7. Overall, the mean values show that the positive predictive value of a decision based
on a compensatory decision rule was quite high. With increasing the GPA, the positive value
decreased. In addition, given a specific GPA, there was a slight decrease in the accuracy of a
decision if the minimum required grade approached the average population true score. Here,
the required GPA seemed more important in determining the positive predictive value
compared to the required minimum grade.
Furthermore, the influence of the test correlation was largest when the required GPA
was closest to the average population true score. Likewise, when the minimum grade was
closest to the average population true score, there was a higher influence of the test
correlation as well. Overall, the influence of the test correlation seemed to be positive;
increasing the test correlation resulted in higher positive predictive values. Secondly, the
influence of the test reliability on the positive predictive value was positive. Hereby, the
influence was strongest when the required GPA increased towards the average population
test reliability decreased. Thirdly, the results show that there was almost no visible influence
for the number of tests. Finally, the influence of the number of retakes was small and mostly
negative. Only if the required grade was high or the GPA was low, a slight positive influence
of the number of retakes on the positive predictive value was evident. This influence of the
number of retakes became slightly stronger if the GPA increased towards the average
population true score.
Conclusion. Overall, the positive predictive value of the compensatory decision rules
was quite high. Hereby, it was highest when the required GPA was less stringent, i.e. further
removed from the average population true score. Again, the test reliability had the highest
influence. Compared to the previously described accuracy indices however, the factors
influenced the positive predictive value to a smaller extent. Furthermore, the influence of the
test correlation and number of retakes was small and ranged from positive to negative,
depending on the specific combination of required GPA and minimum grade used. Finally,
the number of tests did not seem to influence the positive predictive value of a compensatory
decision rule.
Table 7
Mean Positive Predictive Value for Decision Rules and Different Factors
D e ci si o n R u le G P A M in im u m Mean Positive Predictive Value Average Test Correlation Average Test Reliability Number of Tests Number of Retakes
.1 .3 .5 .7 .4 .6 .8 8 12 0 2
Conjunctive vs. Compensatory Decision Rule
After looking at the influences of the different predictors on the accuracy of a
compensatory decision rule, the accuracy of a compensatory decision rule was compared to
that of a conjunctive rule. Hereby the mean values and the influences of each factor were
considered for each of the outcome measures as displayed in Table 4 to 7. Comparing the
sensitivity values, showed that the decision based on the conjunctive rule had an overall
lower sensitivity than the compensatory rules regardless of the different factors. Furthermore,
the difference between the sensitivity of a conjunctive and compensatory rule was larger if a
fully compensatory decision rule was applied, i.e. the minimum required grade equals 1. In
these instances the sensitivity was highest. Also, the difference was largest if the average test
reliability and the average test correlation were low. Overall, the difference between the
sensitivity of the conjunctive and compensatory decision rules became considerably smaller
if students were allowed to retake two tests or the test reliability was high. Overall, the
sensitivity of the compensatory rules that required a high minimum grade as well as a low
GPA was most similar to the sensitivity of the conjunctive rule.
Secondly, the specificity of a decision based on the conjunctive rule was higher than
that based on a compensatory rule. Hereby, the difference between the decision rules became
smallest when the minimum grade required within a compensatory decision rule was closest
to the average population true score. Given a minimum grade, the difference in specificity
slightly decreased when the required GPA was high as well. The difference between the
compensatory and conjunctive was smallest when the test reliability was high. If the test
reliability was low, the specificity of a compensatory decision rule became more similar to
that of a conjunctive rule if the minimum required grade was stricter, i.e. closer to the average
population true score. The difference was also small if the tests within a curriculum
correlated highly. Additionally, with two retakes, the difference between the specificity of a
conjunctive and compensatory rules became larger relative to the difference when no retakes
were allowed. Remarkably, the factors each seemed to have only a small influence in
determining the specificity of a conjunctive decision rule relative to that of a compensatory
decision rule.
Thirdly, the proportion of misclassifications was smaller in a compensatory decision
rule relative to a conjunctive rule when the minimum required grade was low or a fully
combination with a GPA that was further removed from the average population true score, a
compensatory decision rule resulted in more decisional errors. Overall, the difference
between the two types of rules was smallest if the required GPA and minimum grade within a
compensatory decision rule were both close to the average population true score.
Remarkably, the test reliability had a larger influence for compensatory decision rules. Also,
at low test reliabilities the difference between the conjunctive and compensatory decision
rules was strongest where more errors were made in a compensatory decision rule if the
minimum grade increased towards the average population true score. The same holds for the
number of retakes; the influence of the number of retakes was larger for compensatory
decision rules that also had a conjunctive aspect, i.e. a required minimum grade.
Finally, comparing the positive predictive values showed that the positive predictive
value of a conjunctive rule was overall lower than that of a compensatory decision rule. The
difference between the two types of rules became smaller when the required GPA increased.
Furthermore, the influence of the test correlation, test reliability and number of retakes on the
positive predictive value was considerably larger for a conjunctive decision rule.
Discussion
This study evaluated the decision accuracy of different complex decision rules that
combine multiple measures in a context of a higher education first year curriculum.
Specifically, this study investigated the influences of several factors that affect the decision
accuracy of these high stake decisions. Overall, the purpose of this study was to evaluate the
psychometric argument that motivated the implementation of a compensatory testing system
in the first-year of the Psychology bachelor at the Erasmus University Rotterdam; namely,
that decisions based on the average grade, in which measurement error is likely to cancel out,
are more accurate than decisions based on the individual test scores which each contain
measurement error individually. As the results indicate, an evaluation of the implementation
of the compensatory testing system is not as straightforward as this psychometric argument
implies. Importantly, the results indicated that the accuracy of the decisions, as indicated by
the decisions’ sensitivity, specificity, proportion of misclassifications, and positive predictive
value, depends on the degree of compensation allowed as well as several aspects of the
combined tests and setting.
Overall, in evaluating different compensatory decision rules, the results showed that
population true score. Likewise, more classification errors were made when the conjunctive
aspect of the complex compensatory decision rule became more stringent, i.e. increased
towards the average population true score. Here, an interplay between the required GPA and
minimum grade existed as the influence of the minimum grade on the proportion of
misclassifications became smaller at a high GPA. Looking at the false positive and false
negative rates separately revealed that within a compensatory decision rule false positives
were more likely than false negatives (i.e. the sensitivity of a compensatory decision rule was
higher than its specificity). The height of both rates was influenced more by the required
minimum grade compared to the required GPA. Finally, the results showed that the overall
positive predictive value, the proportion of students who justly passed from all students who
passed, was quite high and influenced more by the required GPA relative to the minimum
grade required.
Assessing the influences of different practical factors showed that the average test
reliability was the most important determinant of the accuracy of a compensatory decision
rule. The positive influence of the test reliability on the total proportion of misclassifications,
the sensitivity, and the positive predictive value was highest if both the required GPA and
minimum grade were close to the average population true score. Contrary, for the specificity,
the test reliability had the largest influence if both the required GPA and minimum grade
were low. The average test correlation also had a large positive influence comparable to that
of the test reliability. Furthermore, the number of retakes also seemed important in
determining the decision accuracy. Specifically, the number of retakes allowed had a positive
influence on the sensitivity and a negative influence on the specificity as hypothesized. In
other words, allowing students to retake a test resulted in less false negatives and more false
positives. Finally, the number of tests seemed to have no influence on the accuracy of a
compensatory decision rule. In general, the results show that the practical factors manipulated
in this study were relevant in determining the decision accuracy of compensatory decision
rules. Moreover, the results indicate that their influence depends on the specific requirements
within the compensatory decision rules, i.e. the required GPA and minimum grade.
Since the decision accuracy of a compensatory decision rule was influenced by
several practical factors, comparing the accuracy of a compensatory decision rule with a
conjunctive rule became less straightforward. However, in light of the media coverage on the
introduction of a compensatory testing system at the Erasmus University Rotterdam, a
the proportion of misclassifications was smaller for the conjunctive decision rule compared to
the compensatory rules that required a high minimum grade with a low GPA. As the required
GPA increased, the difference with the conjunctive rule became smaller. If the conjunctive
aspect of the complex compensatory rule was not strict, fewer classification errors were made
applying the compensatory rules relative to the conjunctive rule. Remarkably, when two
retakes were allowed, almost all compensatory decision rules were more accurate than the
conjunctive decision rule. Looking at the type of errors made, the results showed that the
specificity was mostly higher for a conjunctive rule while the sensitivity of a conjunctive rule
was generally lower than that of a compensatory rule. In other words, under a compensatory
testing system more false positives are made compared to a conjunctive testing system, while
relatively less false negatives occur under a compensatory testing system. Finally, the mean
positive predictive value is lower for the conjunctive decision rule than for the compensatory
rules. This comparison illustrates how the accuracy of a decision is highly dependent on the
exact requirements and on practical considerations such as the number of retakes allowed.
Consequently, critiquing the use of a compensatory testing system in a higher education
context without taking into account the specific situation in terms of e.g. test reliability,
retakes, and test correlations, would be too short sighted.
Overall, this study produces new insights into the accuracy of high-stake decisions
made based on multiple measurements. Where previous studies evaluated different decision
rules and looked at the effect of one or two factors that influence the accuracy of a decision,
this study took a more comprehensive approach by including multiple factors. Moreover, in
addition to the previously documented main effects this study distinguishes itself by focusing
on the interplay of the factors and the specific requirements within a decision rule and how
these influence the decisions’ accuracy. Generally, the findings from this study are in line
with previous findings. As Douglas and Mislevy (2010) found, a combination of a
conjunctive and compensatory decision rule results in less decision errors. The findings from
this study indicate this as well, however some additional requirements are present for the
compensatory rule to result in less decisional errors. Namely, two retakes are allowed, tests
have high reliability, or the required minimum grade is low and the GPA high. Furthermore,
the results from this study support McBee et al. (2014) their finding that with lower test
correlations and test reliability a higher proportion of false negatives and false positives is
present. Hereby, the influence of test reliability showed to be stronger than the influence of
increasing the number of tests exaggerated the difference in the number of false positives and
false negatives between the conjunctive and compensatory decision rule. The results of this
study did not show such a pattern for increasing the number of tests. A possible explanation
for the discrepancy of this finding with previous results originates in the different factors that
were included in this study. As additional factors were manipulated, the influence of the
number of tests might not be as apparent as in Douglas and Mislevy (2010) their study due to
the influences of the other factors. On the other hand, this study did replicate Douglas and
Mislevy (2010) their findings indicating that increasing the opportunities to pass increases the
false positive rate. As a whole, the findings from this study indicate that, supporting Chester
(2003) his conclusion, it is not only the manner in which the multiple measures are combined
that is important for the accuracy of a decision, the measures selected are as important.
Specifically, a selection of measures in terms of average reliability and correlation among the
measures seems important.
Considerations Simulation Assumptions
Wanting to evaluate the decision accuracy of a decision this study used simulations to
obtain a student his or her true score as well as observed score. In the simulations several
assumptions were made that might limit the generalizability of the results. In setting up the
simulations, it was ensured that these assumptions were plausible in representing an actual
higher educational context. A strong assumption concerned the underlying true score
distribution which was assumed to be one dimensional and normally distributed. Another
strong assumption was made in simulating measurement error. Deviating from the
assumptions on error within the framework of CTT, which was adopted in previous
simulation studies (e.g. Douglas & Mislevy, 2010; Van Rijn et al. 2012), this study assumed a
relation between the measurement error and a student his or her true score. Although this
deviates from previous studies, this assumption is in line with the reasoning in item response
theory (IRT) that measurement error depends on someone’s true score (Embretson & Reise,
2000). Additionally, this assumption partly comes forth by the assumption of the type of tests
included in the curriculum; namely multiple-choice tests.
Additional assumptions apply to the retake opportunities incorporated in the
simulation studies. Here, it was assumed that only one retake opportunity existed for each of
the tests included in the curriculum. Also, it was assumed that the retake score replaced the
a similar strategy and choose to retake the course on which their observed score was lowest.
In real life situations different groups of students might employ different strategies. One
might for example argue that students opt a more optimal retake strategy and choose those
tests where the discrepancy between their observed and true score is highest. Since generally
students might not be good in defining their true score accurately and consequently the
discrepancy between their observed and true score, it was chosen to simulate a strategy in
which students retook the test that had the lowest observed score. Notably, retakes were only
allowed if an observed test score was below the minimum required grade or GPA was below
the required GPA. In addition, true scores were assumed to increase at the retake tests as
students were assumed to have obtained more test taking skills and relevant knowledge in the
interval between the first attempt and the retake. Hereby it was assumed that students take
retakes at the end of the academic year.
Other Considerations
In this simulation study an empirical approach was taken by using empirical data as
the foundation for the simulations. This data only includes Dutch first year Psychology
students at the Erasmus University Rotterdam. Consequently, the specific accuracy levels
might differ for other programs or similar bachelor programs in different cities or countries
and therefore one should not focus on these specific values. Alternatively, this study aims at
analyzing overall effects of for example having a higher or lower minimum required grade,
not the specific value ascribed to it as this might vary in different testing systems.
Accordingly, interpreting the results as such, the results are more easily generalized to other
testing systems as well as other decision-making situations.
In this study it was assumed that students behave similar under each of the decision
rules by means of similar true and observed score distributions. Hereby, specific learning
strategies that could be applied by students were ignored. Likewise Van Rijn et al. (2010)
argued it is not to say that in practice these exact accuracy levels will automatically occur
once a specific decision rule is applied. Students are able to react to different testing systems
by, for example, allocating their study time accordingly. Nevertheless, the results indicate
that errors are made and that these differ per decision rule. Additionally, students that are
exempted from the criteria set in a bachelor program due to personal circumstances were not
considered in this study and the results consequently do not generalize to this group of