4312
|
www.ecolevol.org Ecology and Evolution. 2017;7:4312–4325. O R I G I N A L R E S E A R C HLocally adapted populations of a copepod can evolve different
gene expression patterns under the same environmental
pressures
Thiago G. Lima
|
Christopher S. Willett
This is an open access article under the terms of the Creative Commons Attribution License, which permits use, distribution and reproduction in any medium, provided the original work is properly cited.
© 2017 The Authors. Ecology and Evolution published by John Wiley & Sons Ltd.
Data archival location: Illumina reads were deposited in the NCBI SRA BioProject PRJNA308869. Gene expression was archived in the NCBI Gene Expression Omnibus under Accession No.
GSE80737.
Department of Biology, University of North Carolina at Chapel Hill, Chapel Hill, NC, USA
Correspondence
Thiago G. Lima, MBRD, Scripps Institution of Oceanography, UCSD, La Jolla, CA, USA. Email: [email protected]
Present address
Thiago G. Lima Marine Biology Research Division, Scripps Institution of Oceanography, La Jolla, CA, USA
Funding information
Division of Integrative Organismal Systems, Grant/Award Number: 1155325
Abstract
As populations diverge in allopatry, but under similar thermal conditions, do similar thermal performance phenotypes evolve by maintaining similar gene expression pat-terns, or does genetic divergence lead to divergent patterns of gene expression be-tween these populations? We used genetically divergent populations of the copepod Tigriopus californicus, whose performance at different thermal conditions is well char-acterized, to investigate transcriptome- wide expression responses under two differ-ent thermal regimes: (1) a nonvariable temperature regime and (2) a regime with variable temperature. Our results show the expression profiles of the response to these regimes differed substantially among populations, even for populations that are geographically close. This pattern was accentuated when populations were raised in the variable temperature environment. Less heat- tolerant populations mounted strong but divergent responses to the different thermal regimes, with a large heat- shock re-sponse observed in one population, and an apparent reduction in the expression of genes involved in basic cellular processes in the other. Our results suggest that as populations diverge in allopatry, they may evolve starkly different responses to changes in temperature, at the gene expression level, while maintaining similar thermal performance phenotypes.
K E Y W O R D S
local adaptation, phenotypic plasticity, RNA-seq, Tigriopus californicus
1
|
INTRODUCTION
Understanding how ectotherms adjust to changing environments across generations, through adaptation, or within a generation, through phenotypic plasticity, is issue that has been of interest to evo-lutionary biologists and physiologists for some time. These processes can be a driver of divergence and represent a key component of fitness
Early studies of thermal adaptation revealed the importance of heat- shock proteins (HSPs) as one of the mechanisms to protect the cell from damage following exposure to stressful conditions (Feder & Hofmann, 1999; Lindquist, 1986), and now more recent results from transcriptomic studies are highlighting a wider variety of genes import-ant for thermal response (DeBiasse & Kelly, 2016). The genes coding for HSPs are often found to be upregulated in a range of organism under thermal stress (Tomanek & Somero, 1999; Sorensen et al., 2005; Bedulina, Zimmer, & Timofeyev, 2010; Schoville et al., 2012; Barshis et al., 2013; Wang et al., 2014; Gleason & Burton, 2015 but exceptions do exist: e.g., Franssen et al., 2014). The advent of next- generation sequencing has allowed for transcriptome- wide studies in nonmodel organisms, which has improved our knowledge of the genetic basis of thermal adaptation and plasticity beyond what is known from candi-date genes (reviewed in DeBiasse & Kelly, 2016). Besides the upregu-lation of HSP genes, other common responses to thermal stress have also been described; these responses included an overrepresentation of genes with Gene Ontology terms associated with the production of molecules that prevent cell damage from reactive oxygen species, molecules that target proteins that have been damaged beyond re-pair for proteolysis, immune- system related genes, and cell wall/ membrane modification genes (Barshis et al., 2013; Dayan, Crawford, & Oleksiak, 2015; Franssen et al., 2014; Gleason & Burton, 2015; Narum & Campbell, 2015; Wang et al., 2014). While the functions of these genes are similar across studies, there is a lot of variation in the set of genes that respond to thermal stress. This is in part because of differences in study design, but also because these divergent taxa have evolved different ways to deal with thermal changes. Therefore, we were interested in determining how much the transcriptome- wide response varies when divergent populations of the same species are compared under different thermal regimes. As populations diverge in similar environments but in allopatry, does selection favor similar ge-netic responses across the populations? Or do novel mutations that appear in each population contribute to increased divergence in their response to thermal changes?
The copepod Tigriopus californicus is an ideal species in which to test this, as it gives us the opportunity to compare a number of lo-cally adapted populations across a broad latitudinal spectrum differing in thermal tolerance. Populations of this species inhabit splash pools on the Pacific coast of North America and can be exposed to large changes in temperature on a daily basis. Gene flow is extremely low, which has led to the formation of many genetically divergent popu-lations, even for populations that are only a few kilometers apart (Burton, 1997; Willett & Ladner, 2009). Within California, northern and southern populations fall out into two clades, with the north-ern clade encompassing populations north to Alaska (Burton, 1998; Edmands, 2001; Willett & Ladner, 2009; Figure 1a). Populations from the two clades show significant differences in local adaptation, partic-ularly for thermal tolerance where upper thermal tolerance increases as latitude decreases, with lethal temperatures ranging from 35° in the northern clade to 38° in the southern clade (Kelly, Sanford, & Grosberg, 2012; Pereira, Barreto, & Burton, 2014; Tangwancharoen & Burton, 2014; Willett, 2010). In a study of acute thermal stress (35°),
Schoville et al. (2012) found that T. californicus from a southern clade population (San Diego, CA) showed much greater upregulation of genes that are known to respond to heat stress, such as heat- shock proteins, than did individuals from a northern clade population (Santa Cruz, CA), suggesting that their ability to upregulate these genes may be at least in part responsible for their higher heat tolerance. The northern population differentially expressed a much higher number of genes overall (both up- and downregulated), but to much lower levels of fold change.
Differences in thermal adaptation in this species can also be ob-served as a shift in the thermal performance curve (TPC) of popula-tions from south to north (Hong & Shurin, 2015). The width of the TPC remains the same, but the fitness peak shifts from warmer to cooler temperatures as you move north. In agreement with this, Willett (2010) showed that at higher nonlethal daily variable temperatures (20°–28°), two different southern populations outcompete two other north-ern ones, and the opposite is true for colder variable temperatures (16°–25°) or lower nonvariable temperatures (16°). The populations have roughly equivalent fitness at 20° (Willett, 2010). Both south-ern and northsouth-ern populations commonly experience temperatures to and beyond 28° in nature, and when in the high variable temperature environment by themselves, all populations are able to develop and have offspring normally (Willett, 2010). Therefore, it seems northern populations are unable to survive in these high temperatures because of low competitiveness compared to the more heat- tolerant southern populations.
followed by a one- time moderate heat stress. Our results suggest that the less heat- tolerant northern populations are potentially outcom-peted by southern ones at least in part due to the costs associated with changing the expression of a much higher number of genes when in the moderately high variable temperature regime.
2
|
MATERIALS AND METHODS
2.1
|
Copepod collection, culture, and thermal
treatments
Copepods were collected in May 2013 from rocky intertidal pools at four sites, the two southern populations of San Diego (SD- S, 32°44′44″N, 117°15′18″W) and Bird Rock (BR- S, 32°48′54″N, 117°16′23″W), and the two northern populations of Santa Cruz (SC- N, 36°56′58″N, 122°02′49″W) and Bodega Bay (BB- N, 38°19′4″N, 123°4′23″W) (Figure 1a). Copepods were maintained en masse cultures in petri dishes in 35 ppt artificial seawater (Instant Ocean,
Aquarium Systems) and consumed both commercial fish food and natural algae growth. Cultures were kept in incubators with 12- hr light:dark cycle at 20° for two to three generations before beginning the experiment. Copepods were exposed to two thermal regimes: (1) a nonvariable 20° and (2) a variable environment with 12 hr at 20° and 12 hr at 28° each day. Although the variable environment is more sim-ilar to the natural environment where daily temperature fluctuations are common, aspects such as rate of temperature change may be less representative (but are identical to those used in the Willett (2010) study). For both regimes for all populations, 25 gravid females were transferred to petri dishes (four dishes per population per treatment) and randomly assigned to one of the thermal regimes. Mothers were removed when offspring reached the copepodid stage. Therefore, co-pepods were born in their respective thermal regimes and stayed in this regime until they reached the adult life stage (copepodid stage 6) at which point RNA was extract for the different treatments. Differences in gene expression for each population, between thermal regimes, should be due to plasticity differences and not adaptation, as
F I G U R E 1 Phylogeography of
the copepods were in the different regimes only for the one genera-tion. On the day before RNA isolation, 100 adult copepods (50 males and 50 females) were transferred to a new petri dish, without addi-tional food. Each petri dish with 100 individuals was a replicate for one of the treatments. For each treatment, all populations had two dishes with 100 copepods and a separate mRNA library was created from the pool of 100 copepods for each population/treatment repli-cate (Fig. S1). As shown in Figure 1b, there were two sampling points for each thermal regime: (1) At the end of the 20° period in the vari-able regime, RNA was extracted from copepods from both regimes (20NV and 20V); at this point, copepods from the nonvariable regime were transferred to 28°; (2) 2 hr after the temperature shift to 28° on the variable regime, RNA was extracted from copepods at 28° from both regimes (28ST and 28V) (Figures 1b; S1.).
2.2
|
RNA extraction and Illumina sequencing
For each treatment at the appropriate sampling time, copepods from each dish (~100 individuals) were collected onto filter paper, rinsed with filtered seawater, and immediately transferred to 250 μl of TRI Reagent (Sigma). RNA isolation was performed following the manu-facturer’s protocol. RNA samples were quantified using Qubit 2.0 fluorometer (Life Technologies), and 2 μg of total RNA per sample were submitted to the UNC High- Throughput Sequencing Facility for library preparation and sequencing. RNA- seq libraries were pre-pared using the TruSeq Sample Prep Kit (Illumina), and samples were sequenced as 100- bp single- end unstranded mRNA libraries in the Illumina HiSeq 2000 (for one replicate of SD- S and SC- N, and both replicates of BR- S and BB- N) and HiSeq 2500 (for the second repli-cate of SD- S and SC- N). Each Illumina sequencing lane contained two populations (SD- S and SC- N; BR- S and BB- N), with all treatments bar-coded. Replicates were sequenced in the same manner in separate lanes, for a total of four lanes. A total of 32 libraries were sequenced (four populations x two thermal regimes x two treatments per thermal regime × two replicates per treatment). Illumina reads were depos-ited in the NCBI SRA BioProject (PRJNA308869). Illumina reads were trimmed for quality using CLC Genomics Workbench (CLC GW) 7.0.4 (CLC Bio) discarding bases with Phred score lower than 20, and keep-ing reads with at least 15 bp remainkeep-ing after trimmkeep-ing.
2.3
|
Transcriptome assembly and annotation
An annotated reference genome for the SD- S population has been published online (https://i5k.nal.usda.gov/Tigriopus_californicus), and it was used to build transcriptome references for all populations in this study as follows. Annotated genes from the SD- S reference genome were extracted, and alternative splice variants were removed, keeping only the longest splice variant of a gene. To avoid a bias in mapping of reads from SD- S to its own high- quality reference with reads from the other populations likely to have some SNP differences, we built refer-ences from each of the four populations by mapping them to the SD- S genes. Trimmed reads from all treatments were combined for each single population and mapped to the SD- S genes using BWA MEM
using default parameters (Li & Durbin, 2009). Following mapping, reads with low mapping quality (MAPQ < 20, likely the result of incor-rect alignment) were removed, and the consensus sequences for each population were extracted using SAMtools and BCFtools (Li, 2011; Li et al., 2009). We assessed the quality of the references by calculat-ing the total percentage “N” in the reference transcript set of each population. We also compared the sizes of the orthologous contigs and the percentage “N” in each contig for all transcripts that occurred in all four populations. As our gene expression analysis only compared within- population differences in treatment reads mapped to their own reference, no further action was taken at this stage of the analysis to remove short transcripts with a high percentage of “N,” as these were removed during gene expression analysis.
The current SD- S genome assembly is thought to include ~80% of the entire genome, and certain genes are known to not be in this ref-erence. To avoid excluding these genes from our analysis, we used de novo transcriptome assemblies from Pereira et al. (2016) to comple-ment the pool of genes in our analysis as the populations used in this study are the same as the ones used in Pereira et al. (2016). To avoid confusion, we will refer to the set of genes relating to the reference genome as genomic transcripts (GTs), and from the de novo transcrip-tome assembly as de novo transcripts (DNTs). Transcripts originating from the different references can be differentiated based on their ID, where GT IDs begin with “TCALIF,” while DNT IDs begin with either “Contig” or “comp.”
BLAST2GO (Conesa et al., 2005) was used to annotate transcripts from the references. We used the SD- S reference for annotation as it had slightly higher quality than the others. BLASTX searches were performed against the “nr” NCBI protein database, retaining hits with E ≤ 10−3. Gene Ontology (GO) terms (Ashburner et al. 2000) were retrieved for contigs with positive BLAST hits, with an E ≤ 10−3.
2.4
|
Mapping and identification of differentially
expressed genes
Trimmed reads for each treatment were mapped to their respec-tive population’s GT references in CLC GW (mapping parameters: similarity fraction = 0.99; length fraction = 0.8; mismatch cost = 2; insertion cost = 3; deletion cost = 3). Unmapped reads were re-tained and mapped to the DNT references using the same mapping parameters. Only unique mapped reads from the two sets of map-ping files were used in further analyses. Only orthologous genes that occurred in all four populations were considered. Orthologous genes from the GT reference already had the same ID, while those from the DNT reference were extracted from the orthologous list in Pereira et al. (2016) and were given the SD- S ID for ease of com-parison in later steps.
expression in both treatments were removed by retaining only those that accumulated at least two counts per million in at least two of four samples, allowing for both replicates of a treatment to have zero mapped reads, if both replicates in the other treatments had enough reads mapped to them. This also removed all genes that had zero mapped reads in the DNT reference, because the appropriate reads for these transcripts had already mapped to the GT reference. Compositional differences between the libraries were normalized using the trimmed mean of M- value method (Robinson & Oshlack, 2010). For each population, all treatments were examined for pos-sible batch effects between the replicates, using a multidimensional scaling (MDS) plot to visualize the level of similarity between each RNA sample for each population (Fig. S2). To account for batch effects between the replicates, a negative binomial generalized linear model (GLM) was fit, where “sequencing lane” was used as a blocking factor. Likelihood ratio tests were used to determine genewise expression differences between two treatments, followed by a false discovery rate (FDR) correction of p values set to 5% (Benjamini & Hochberg, 1995). Genes that were detected as differentially expressed (DE), but had 0 reads mapped to both replicates in one of the treatments, were considered DE but were excluded in comparisons of the magnitude of their relative expression, as they showed abnormally high levels of fold change. Gene expression data are available through the NCBI Gene Expression Omnibus under Accession No. GSE80737.
2.5
|
Pairwise comparisons of relative gene
expression
Three pairwise comparisons between treatments were performed in EdgeR, each aimed at answering a specific question (Figure 1b). To determine how populations respond to potentially low levels of ther-mal stress, relative expression between the nonvariable 20° (20NV) and stress 28° (28ST) treatments was calculated. To determine how populations respond to daily fluctuations in temperature, relative expression between the variable 20° (20V) and variable 28° (28V) was calculated. Differences between these two comparisons (28ST vs. 20NV vs. 28V vs. 20V) should then reflect the effects of pheno-typic plasticity responses to exposure to 28°. To determine whether genes were being differentially expressed between variable and non-variable regimes, relative expression between 20NV and 20V was calculated.
2.6
|
Gene ontology enrichment analysis
Enrichment of Gene Ontology (GO) terms was assessed in Blast2GO using Fisher’s exact tests for every GO term that appeared in a subset of genes, compared to all genes used in the analysis for each popula-tion (reference set). p-values were adjusted for multiple comparisons using a FDR set at 5%. GO enrichment analysis was performed for up- and downregulated genes separately for each pairwise compari-son in each population. In many cases, redundant GO terms were significantly enriched in a dataset, in which case only one of these terms was included in our results using the following criteria: (1) If
the terms associated with the same transcript belonged to different GO categories (i.e., biological process (P), molecular function (F), or cellular component (C)), they were all kept; (2) the most specific term was kept if it included approximately the same number of genes as the more broad term (e.g., response to stress (more specific) had 13 genes, response to stimulus (broader) also had 13 genes, response to stress was kept); (3) when multiple more specific terms combined in-cluded most of the genes in their common broader term, the specific ones were kept.
3
|
RESULTS
3.1
|
Illumina sequencing and RNA- seq mapping
RNA sequencing yielded ~7.6–29 million reads per sample after trim-ming (Table S1). The genomic transcript (GT) references created by mapping RNA- seq reads to the annotated T. californicus reference genome yielded 13,839 orthologous transcripts, while the de novo transcript assembly (DNT) from Pereira et al. (2016) included 12,576 orthologous transcripts, for a total of 26,415 transcripts. Of these, 20,211 (76%) had a significant BLAST hit and were assigned a gene name. GO terms were retrieved for 17,422 transcripts (66%). The approximately 26,000 transcripts is an overestimate of the number that factored in the analyses for two reasons. First, the two transcrip-tomes are redundant (redundant DNT transcripts were dropped after mapping reads as described in the methods), and second, several transcripts were filtered out during differential expression analysis due to low number of mapped reads. The resulting datasets varied slightly for each population because the transcripts with low cov-erage were not always the same, but all genes included in any of the populations’ set occur in all other populations, even if they were dropped due to low number of mapped reads in this study. The num-ber of transcripts used for the remainder of the study was as follows: SD- S: 18,471 (11,715 GT, 6,756 DNT); BR- S: 18,018 (11,676 GT, 6,342 DNT); SC- N: 18,962 (11,573 GT, 7,389 DNT); BB- N: 18,294 (11,516 GT, 6,778 DNT).3.2
|
Response to moderate thermal stress in the
two thermal regimes
When the different populations experience 28°, we expect northern populations to be more stressed as they have lower heat tolerance and their thermal performance curve is shifted to colder tempera-tures. Therefore, in both thermal regimes [nonvariable (NV) and vari-able (V)], we hypothesized that the northern populations will have to mount a stronger heat- shock response, which should translate into a larger number of differentially expressed (DE) genes, as well as higher magnitude of change for these genes. We expect, especially in northern populations, upregulated genes to be involved in the heat- shock response pathway (such as HSP genes), but not necessarily up-regulation of genes associated with proteolysis or apoptosis as the high- temperature treatments are well below the populations’ lethal temperatures. We also expect to see the downregulation of genes associated with normal cell maintenance as the heat- shock response is known to favor the synthesis of HSPs while suppressing the ex-pression of other genes (Tomanek, 2010). Southern and northern populations are expected to share more DE genes when compared to the population in the same region, as opposed to comparisons be-tween regions. Our results, however, did not support (or only partially
supported) our expectations. Below we detail the results for each thermal regime comparison.
3.3
|
Response to moderate thermal stress after
nonvariable temperature regime (28ST vs. 20NV)
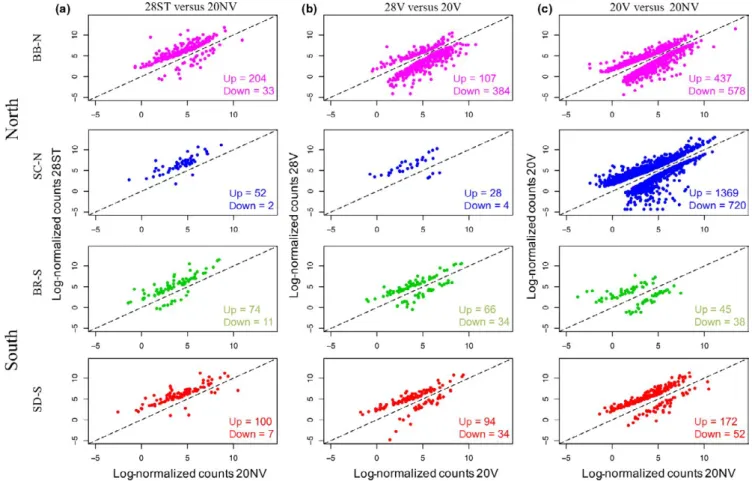
For the northern populations, BB- N differentially expressed a higher number of genes than the two southern populations (204 up, 33 down; versus 100 up and 7 down for SD- S, and 74 up and 11 down for BR- S), while SC- N had the lowest number of DE genes of the four populations in the 28ST versus 20NV comparison (52 up and 2 down; Figure 2a and Appendix S1). The composition of DE genes in the 28ST versus 20NV comparison indicates that each population has a mostly unique pattern of differential gene expression for this stress. Only 25 genes were DE in all four populations in this comparison (Table S2), and while the majority of these shared DE genes are well- characterized genes involved in heat- shock response (including 12 HSP genes), they only make up between 10 and 46% of all DE genes in each popula-tion. In pairwise comparisons, the populations share only a few more genes than these 25 common DE genes, but southern and northern populations do not share more DE genes within region than they do between regions (Figure 3a; Appendix S2). Even if we consider genesF I G U R E 2 Differentially expressed genes for the three pairwise treatment comparisons. (a) Stress 28° (28ST) versus nonvariable 20° (20NV);
that are DE in at least one of the populations in pairwise compari-sons and look at the direction of the expression change (regardless of whether or not the p- value threshold is met), southern and northern populations share approximately the same percentage of genes within and between regions, with some between- region comparisons shar-ing a higher percentage of genes that change in the same direction (Figure 3a; Appendix S2). The magnitude of the fold change of these genes, however, may be more informative. Overall, SD- S on average upregulated the shared 25 DE genes to the smallest degree compared with the other populations, and this increased as you moved north, with BB- N showing the highest average magnitude of change in ex-pression of these genes (Table S2).
In all four populations, GO enrichment analysis found that terms associated with response to stress, unfolded protein binding, and protein folding (except for BB- N) were enriched in DE genes that were upregulated (Table 1). Heat- shock protein genes contributed to the enrichment of these terms and were the most common class
of upregulated genes (16 in SD- S, 13 in BR- S, 14 in SC- N, and 15 in BB- N). GO terms related to protein targeting and cell motility were also enriched in SD- S, while structural molecule activity and extracel-lular region terms were enriched in downregulated genes in BB- S. In this last case, these terms are overrepresented in large part due to the large number of cuticle proteins that are DE (especially in BB- N; Table 1).
3.4
|
Response to moderate thermal stress in
variable versus nonvariable temperature regimes
(28ST vs. 20NV compared to 28V vs. 20V)
Next, we looked at the effects that raising individuals in a variable temperature regime (20°–28°) would have compared to the effects of raising them at a nonvariable 20° and exposing them to 28° as adults. Between 28V and 20V, BB- N differentially expressed a larger number of genes than the southern populations (107 up, 384 down versus 94
F I G U R E 3 Percentage of genes
T A B L E 1 Enriched gene ontology (GO) terms for differentially expressed genes in the three treatment comparisons
Term Category p value # Genes with term Expression change GO- ID
28ST versus 20NV SD- S
Response to stress P 1.47E−12 23 Up GO:0006950
Unfolded protein binding F 1.02E−07 7 Up GO:0051082
Protein folding P 2.97E−04 6 Up GO:0006457
Protein targeting P 6.05E−03 4 Up GO:0006605
Cell motility P 2.65E−02 4 Up GO:0048870
BR- S
Response to stress P 7.37E−08 16 Up GO:0006950
Unfolded protein binding F 7.54E−07 6 Up GO:0051082
Protein folding P 1.39E−03 5 Up GO:0006457
SC- N
Response to stress P 2.29E−11 17 Up GO:0006950
Unfolded protein binding F 6.26E−06 5 Up GO:0051082
Protein folding P 4.15E−03 4 Up GO:0006457
BB- N
Response to stress P 3.75E−08 26 Up GO:0006950
Unfolded protein binding F 1.93E−04 6 Up GO:0051082
Structural molecule activity F 0.00147 4 Down GO:0005198
Extracellular region C 0.02583 3 Down GO:0005576
28V versus 20V SD- S
Structural molecule activity F 1.73E−09 15 Up GO:0005198
Response to stress P 1.08E−08 18 Up GO:0006950
Unfolded protein binding F 1.44E−06 6 Up GO:0051082
Extracellular region C 3.68E−02 7 Up GO:0005576
Protein folding P 2.36E−03 5 Up GO:0006457
Protein targeting P 3.68E−02 3 Up GO:0006605
BR- S
Unfolded protein binding F 0.0301 3 Up GO:0051082
Structural molecule activity F 4.24E−03 5 Down GO:0005198
Hydrolase activity, acting on carbon– nitrogen (but not peptide) bonds
F 4.24E−03 3 Down GO:0016810
Carbohydrate metabolic process P 2.08E−02 4 Down GO:0005975
SC- N
Response to stress P 3.35E−07 10 Up GO:0006950
Unfolded protein binding F 1.73E−03 2 Up GO:0051082
BB- N
Response to stress P 1.16E−06 17 Up GO:0006950
Unfolded protein binding F 2.60E−03 4 Up GO:0051082
Structural molecule activity F 3.79E−51 71 Down GO:0005198
Extracellular region C 4.69E−06 27 Down GO:0005576
20V versus 20NV SD- S
Structural molecule activity F 3.07E−13 21 Up GO:0005198
Peptidase activity F 2.94E−04 8 Down GO:0008233
up and 34 down for SD- S, and 66 up and 34 down for BR- S), but once again SC- N had a much lower number of DE genes than the other pop-ulations (28 up, four down) (Figure 2b and Appendix S1). Only shared 10 genes were DE in all four populations in this comparison (Table S2), and as for 28ST versus 20NV, only a small number of DE genes were shared between pairs of populations (Figure 3b; Appendix S3). The differences in gene expression profile (measured as the percentage of genes with the same fold change direction in pairwise comparisons) between the populations were higher in the 28V versus 20V than in the 28ST versus 20NV comparison (Figure 3, Appendices S2 and S3).
Differences between the 28ST versus 20NV and 28V versus 20V comparisons are due to phenotypic plasticity of gene expression,
and if this plasticity is dampened when copepods experience a tem-perature on a daily basis (20°–28° variable regime), we would ex-pect a smaller number of DE genes in all populations, and lower fold change for genes involved in heat- shock response. Most genes that were DE in both 28ST versus 20NV and 28V versus 20V had lower fold change in the variable regime, consistent with our expectations (Figure 4). This was especially true for HSPs where in all but one case (an HSP 90 in SC- N), the fold change was lower in 28V versus 20V. BB- N showed the highest difference in fold change between 28ST versus 20NV and 28V versus 20V, indicating it is expressing the greatest degree of plasticity in gene expression, with different HSPs 70 and 90 going from a range of 333.38- 8.88 fold change in 28ST
Term Category p value # Genes with term Expression change GO- ID
BR- S
Extracellular region C 3.28E−03 6 Up GO:0005576
Carbohydrate metabolic process P 3.40E−02 4 Up GO:0005975
Hydrolase activity F 3.40E−02 8 Up GO:0016787
Peptidase activity F 4.64E−02 4 Down GO:0008233
SC- N
Extracellular region C 2.43E−12 78 Up GO:0005576
Cell wall organization or biogenesis P 2.50E−06 10 Up GO:0071554
Carbohydrate metabolic process P 4.10E−05 48 Up GO:0005975
Structural molecule activity F 2.45E−04 42 Up GO:0005198
Hydrolase activity F 1.73E−03 129 Up GO:0016787
Oxidoreductase activity F 6.66E−03 66 Up GO:0016491
Sulfur compound metabolic process P 2.39E−02 15 Up GO:0006790
Cytoskeletal protein binding F 2.42E−02 22 Up GO:0008092
Nucleus C 2.52E−06 100 Down GO:0005634
Chromosome C 7.13E−04 29 Down GO:0005694
Cellular nitrogen compound metabolic process
P 2.26E−02 114 Down GO:0034641
DNA binding F 1.04E−02 44 Down GO:0003677
Protein binding transcription factor
activity F 1.04E−02 11 Down GO:0000988
Cell cycle P 1.04E−02 32 Down GO:0007049
External encapsulating structure C 2.26E−02 3 Down GO:0030312
Peptidase activity F 3.07E−02 36 Down GO:0008233
Microtubule organizing center C 3.92E−02 11 Down GO:0005815
BB- N
Structural molecule activity F 6.46E−15 38 Up GO:0005198
Hydrolase activity F 1.90E−03 59 Down GO:0016787
Extracellular region C 3.59E−02 22 Down GO:0005576
Oxidoreductase activity F 3.59E−02 29 Down GO:0016491
Carbohydrate metabolic process P 3.59E−02 18 Down GO:0005975
Lyase activity F 3.59E−02 9 Down GO:0016829
“Category” refers to the GO categories: C, cellular component; F, molecular function; P, biological process. p values are corrected for multiple comparisons using a false discovery rate of 5%.
SD- S, San Diego; BR- S, Bird Rock; SC- N, Santa Cruz; BB- N, Bodega Bay.
versus 20NV to 4.85- 2.30 fold change in 28V versus 20V. Several other genes went from being upregulated in 28ST versus 20NV to downregulated in 28V versus 20V, including several cuticle proteins and lectins (Figure 4; Appendix S1). Even though SC- N had a much smaller number of DE genes than any of the other populations, the magnitude of the potentially plastic gene expression change was high for several genes. For example, fold change between three HSP 70 genes (TCALIF_06728, TCALIF_04517, comp38417) decreased from 54.94, 24.16, and 22.90, to 14.18, 12.69, and 12.55, respectively (Appendix S1). However, even though the fold change decreased in the variable regime, fold change of these HSP genes is the highest for any population in this regime. Southern populations also showed plastic responses with HSP 70 and 90 genes showing fold change decreasing in SD- S from a range of 30.90–4.59 in 28ST versus 20NV to 5.19–1.97 in 28V versus 20V, and in BR- S from a range of 42.41–8.34 in 28ST versus 20NV to 6.55–3.75 in 20V- c28 (Figure 4; Appendix S1).
GO terms that were enriched in the 28V versus 20V comparison included response to stress and unfolded protein binding for upreg-ulated genes in SD- S, SC- N, and BB- N, while BR- S only had the un-folded protein biding term enriched. These two terms were enriched in all populations for the 28ST versus 20NV comparison as well. Terms associated with structural molecule activity and extracellular region were also enriched in upregulated genes in SD- S, and downregulated genes in BB- N. BR- S had enrichment of structural molecule activity on downregulated genes as well (Table 1). As mentioned before, cuticle protein genes contribute to this enrichment.
3.5
|
Differential expression between thermal
regimes (20V versus 20NV)
Lastly, we looked at how the levels of gene expression differed when the populations were at 20° in the nonvariable versus the variable regimes (20V vs. 20NV). Genes that were upregulated in this com-parison had higher expression in 20V, while downregulated genes had higher expression in 20NV. Unlike the two previous comparisons, 20V versus 20NV displays the biggest difference in the pattern of gene expression between southern and northern populations, where both northern populations differentially expressed a much larger number of genes (both up and down) than southern populations (Figure 2c and Appendix S1), and SC- N differentially expressed many more genes than any of the other populations (BB- N: 437 up, 578 down; SC- N: 1369 up, 720 down; BR: 45 up, 38 down; SD- S: 172 up, 52 down). Within southern populations, SD- S differentially expressed more genes in both directions than BR; however, it did so to a lower magni-tude, especially in upregulated genes (SD- S average fold change: 4.48 up- and 2.10 downregulated; BR- S average fold change 10.95 up- and 2.22 downregulated; Appendix S1).
The number of DE genes in northern populations was between 4.5 and 25 times greater than in southern populations for this compari-son. However, even though the number of DE genes was more similar within a region than between regions, the actual set of genes and their functions were very different for each population. GO enrichment analysis (Table 1) found structural molecule activity genes to be en-riched in upregulated genes in SD- S, while peptidase activity genes
F I G U R E 4 Comparison of log2 fold
change (FC) for genes that are differentially expressed in both 28ST versus 20NV and 28V versus 20V. Filled circles are heat- shock protein genes; open circles are all other genes. Diagonal black line is the 1:1 line; genes below this line have higher FC
in 28ST versus 20NV, and genes above
were enriched in downregulated genes in these populations. In BR- S, extracellular region, carbohydrate metabolic process, and hydrolase activity terms were enriched in upregulated genes, and peptidase ac-tivity terms are enriched in downregulated genes. In SC- N, eight terms were enriched for upregulated genes, while nine were enriched for downregulated genes (Table 1). Several of these enriched GO terms in downregulated genes indicate that SC- N has to downregulate a num-ber of genes that are involved in basic cell maintenance processes. In BB- N, genes associated with structural molecule activity are over-represented in upregulated genes, while three catalytic activity terms, as well as, extracellular region, and carbohydrate metabolic process genes are enriched in downregulated genes (Table 1).
One reason for genes to be upregulated at 20V compared to 20NV could be in “anticipation” of the higher temperatures individuals in the variable regime experience daily compared to those in the nonvariable regime (frontloading). In this study, these frontloaded genes would be genes that were upregulated in 28ST versus 20NV as well as in 20V versus 20NV. SD- S had 18 frontloaded genes (including six HSPs and one cuticle protein), BR- S had 10 frontloaded genes (including one small HSP and two cuticle proteins), SC- N had four frontloaded genes (three HSPs), and BB- N had 84 frontloaded genes (including eight HSPs and seven cuticle proteins) (Appendix S1).
4
|
DISCUSSION
We used RNA- seq to determine transcriptome- wide patterns of gene expression for locally adapted populations of the copepod T. califor-nicus in two thermal regimes. The higher temperature experienced by these populations (28°) should present a moderate stress, but all of the populations encounter this temperature in nature (Kelly et al., 2012), and it is well below their acute lethal temperature (Kelly et al., 2012; Pereira et al., 2014; Tangwancharoen & Burton, 2014; Willett, 2010). Unlike studies that expose organisms to an acute thermal stress, the changes in gene expression we expect to observe are not the maxi-mum response these organisms can mount, but the level of their re-sponse (both as the number of DE genes, as well as the magnitude of the expression change) should indicate the level of thermal stress each population is experiencing. Our results can also give us insights into the differences in fitness that have been observed between these populations under these specific temperature regimes (Willett, 2010).
4.1
|
Transcriptome- wide response to moderate
thermal stress differs between populations
The most striking result in this study was the level of differentiation in gene expression observed between the populations when they were exposed to a moderate heat stress (28°). This was particularly surprising for the two southern populations (SD- S and BR- S), which are separated by only 8 km and should share roughly similar thermal environments overall. There are, however, aspects of the biology of these copepods that can explain our results. There is extremely low gene flow between these two populations (Burton, 1997; Willett &
Ladner, 2009), and shared polymorphism is also very low. Pereira et al. (2016) showed that shared polymorphism rapidly decreases as diver-gence increases between populations of this species. Mitochondrial DNA divergence is ~10% between SD- S and BR- S, and it can be >20% between the southern and northern populations used in this study (Burton, 1998; Willett & Ladner, 2009). Our results may also help par-tially explain the observed transgressive segregation that has been shown in hybrids between the SD- S and BR- S populations (Pereira et al., 2014). Late- generation hybrids (F9) between these two popula-tions have higher thermal tolerance than either parental population, and some hybrid lines were even able to survive temperatures that are lethal to both parental populations. The results presented would suggest that this increased thermal tolerance of hybrids could be due to these two populations having evolved different ways to deal with increases in temperatures. When the two genomes are combined in hybrids, complementary gene action of factors that are associated with higher heat tolerance could then lead to transgressive, higher tolerance in these hybrids; however, this remains to be tested.
When we consider the two northern populations, where differ-ences in gene expression profiles were even more dramatic, a com-bination of differences in abiotic selective pressures and population history is likely to play a more important role than between the southern populations. These northern populations are approximately 240 km apart and are twice as genetically divergent as the southern populations (Figure 1a; Pereira et al., 2016). It is important to remem-ber, however, that these two populations have similar upper thermal limits (Willett, 2010), have similar thermal performance curves (Hong & Shurin, 2015), and are both outcompeted by the southern popu-lations when raised in variable 20°–28° environment (Willett, 2010). Therefore, these thermal phenotypes might have different genetic un-derpinnings between these populations. While it is not uncommon for species or populations that differ in thermal tolerance to show differ-ent sets of DE genes with small overlap between them (Barshis et al., 2013; Dayan et al., 2015; Franssen et al., 2014; Gleason & Burton, 2015; Narum & Campbell, 2015; Wang et al., 2014), our results are unique as we observe large differences between populations of the same species with similar thermal tolerance phenotypes.
4.2
|
Possible genetic underpinnings for lower
competitiveness of northern populations
in both thermal regimes, with high levels of fold change compared to the other populations (especially for HSP genes). This, however, was not the case for SC- N, as it did not change the expression of a large number of genes between 28° and 20°, and even the magnitude of change for DE genes was not much higher than that of the southern populations (except for a small number of HSP genes). We suggest that the lower competitive ability of SC- N compared to SD- S in the variable temperature regime (Willett, 2010) may then be due to how it responds to the high- temperature variable regime, compared to the nonvariable regime, and not specifically because of how it responds to a temperature change from 20° to 28°. It is important to mention that SC- N outcompetes SD- S at a low- temperature variable regime (16°–25°), so it is the combination of variable and high temperatures that leads to the observed pattern. SC- N is maintaining a large number of genes (including some HSPs) at higher levels of expression at both 20V and 28V than at 20NV, while downregulating a large number of genes that are important for basic cellular processes at both tem-peratures in the variable regime (Table 1; Appendix S1). Therefore, it is possible that SC- N may have lower fitness at these variable tem-peratures not solely due to their level of heat- shock response when exposed to moderately stressful temperatures on a regular basis, as appears to be the case for BB- N, but also potentially because of how much it has to change its metabolic framework as a whole when it lives in these variable temperatures.
4.3
|
General patterns of gene expression across all
populations
It is interesting that even at this moderately high temperature (28°), all populations display some level of heat- shock response, upregulat-ing a number of HSP genes and other genes associated with protein biding and refolding (Table 1, Appendix S1). This suggests that all populations, but especially the southern ones, often have to elicit a heat- shock response during the warmer months in nature (Kelly et al., 2012). The production of HSPs, and their dependence on ATP for function (HSP 70 and 90), can add considerable ATP demand to the cell and negatively affect the organism (Clare & Saibil, 2013; Feder et al., 1992; King & MacRae, 2015; Tomanek, 2010). Therefore, even though this heat- shock response is likely an adaptation that allows these organisms to persist when exposed to these temperatures, in-creases in mean temperature due to climate change may have a strong negative impact in this species. The southern populations already ex-perience these temperatures (or higher) often in nature, and as is the case for many other intertidal species (Tomanek, 2010), increases in their ambient temperature would mean they have to mount this heat- shock response for a higher proportion of time, possibly leading to decreased fitness.
As was observed in a previous RNA- seq study in T. californicus (Schoville et al., 2012), a number of genes that are annotated as cu-ticle protein genes are DE in all populations and are overrepresented in at least one of the treatments comparisons, although the direction of the expression change differs between the populations (Table 1). While we do not know the exact function these genes/proteins have
in response to thermal stress, cuticle protein genes have been ob-served to be DE in studies of thermal adaptation in Drosophila (Zhao et al., 2015), and a gene homologous to a DE T. californicus cuticle protein gene (Contig_59_58) in Anopheles gambiae (agap006369- pa) is annotated with a GO term associated with stress response. This gene occurs in A. gambiae within an inversion that contains a large cluster of cuticle protein genes, as well as three hsp83 genes (White et al., 2007); however, it is still unknown the role these cuticle protein genes play in heat or desiccation resistance in this mosquito. While we do not know the function these genes are serving, it is possible that cuticle- associated proteins are part of the thermal response in arthropods.
Studies in Chlorostoma snails, a species of Acropora corals, and two species of seagrass show that more thermally tolerant popula-tions or species in these groups have higher constitutive levels of HSP gene expression (frontloading), which may enable them to more read-ily respond to thermal stress (Barshis et al., 2013; Dong et al., 2010; Franssen et al., 2014; Gleason & Burton, 2015; Tomanek & Somero, 1999). The same may be expected in individuals that were raised in a variable environment compared to a nonvariable one, where some genes that respond to thermal stress in the nonvariable temperature environment (28ST versus 20NV) would also be upregulated at 20° in the variable environment compared to 20° in the nonvariable environ-ment (20NV- 20V). Frontloading genes can be seen as a form of plastic response to higher daily temperatures, and while all populations have at least some frontloaded genes, BB- N has by far the most, including not only several HSP genes, but also several cuticle protein and lectin genes (Appendix S1). SC- N has a small number of upregulated genes at 20NV- 28ST, which limits the number of frontloaded genes it can have in this case, but of the four genes that are frontloaded, three are HSP genes (Appendix S1). The two southern populations have intermediate numbers of frontloaded genes (18 for SD- S and 10 for BR- S), again suggesting that the two northern populations mount very different molecular responses to the variable temperature environment.
5
|
CONCLUSION
The present study highlights some key ways that local adaptation can impact the manner in which an organism deals with temperature changes at the level of gene expression. First, it is clear that locally adapted populations of the same species can display different re-sponses at the molecular level despite showing similar thermal perfor-mance phenotypes. This was particularly striking between SD- S and BR- S, which are only 8 km apart and yet show substantial differences in their responses to both temperature variability and moderate heat stress. Therefore, even for closely related populations, the molecular mechanisms they use to deal with temperature changes can be dif-ferent. Second, as seen in the northern populations, the molecular response to changes in thermal variability (i.e., 20NV vs. 20V com-parison) may be drastically different, even though their upper ther-mal limit is very similar. Therefore, we may be underestimating the amount of variation to stress response at the molecular, and poten-tially physiological, level in species with very segregated populations, by assuming that populations with similar thermal tolerances respond to changes in temperature in the same way.
ACKNOWLEDGMENTS
We thank S. Morgan for collecting copepods from Bodega Bay; L. Gleason, F. Barreto, R. Pereira, and T. Pierce for help with gene expression analysis; and J. Kingsolver, F. Barreto, J. Lee, M. Servedio, M. Noor, T. Vision, and C. Jones for helpful comments on previous versions of the manuscript. This work was supported by NSF grant IOS- 1155325 to C.S.W. T.G.L. was supported by NSF PRFB Award No. 1523543 during the preparation of this manuscript.
CONFLICT OF INTEREST
None declared.
REFERENCES
Angilletta, M. J. (2009). Thermal adaptation: A theoretical and empirical
syn-thesis. Oxford University Press.
Ashburner, M., Ball, C. A., Blake, J. A., Botstein, D., Butler, H., Cherry, J. M., … Sherlock, G. (2000). Gene ontology: tool for the unification of biol-ogy. Nature Genetics, 25(1), 25–29.
Barreto, F. S., Schoville, S. D., & Burton, R. S. (2015). Reverse genetics in the tide pool: Knock- down of target gene expression via RNA interference in the copepod Tigriopus californicus. Molecular Ecology Resources, 15(4), 868–879.
Barshis, D. J., Ladner, J. T., Oliver, T. A., Seneca, F. O., Traylor-Knowles, N., & Palumbi, S. R. (2013). Genomic basis for coral resilience to climate change. Proceedings of the National Academy of Sciences of the United
States of America, 110(4), 1387–1392.
Bedulina, D. S., Zimmer, M., & Timofeyev, M. A. (2010). Sub- littoral and supra- littoral amphipods respond differently to acute thermal stress.
Comparative Biochemistry and Physiology - part B, 155(4), 413–418.
Benjamini, Y., & Hochberg, Y. (1995). Controlling the false discovery rate: A practical and powerful approach to multiple testing. Journal of the Royal
Statistical Society, 57(1), 289–300.
Burton, R. S. (1997). Genetic evidence for long term persistence of marine invertebrate populations in an ephemeral environment. Evolution, 51, 993–998.
Burton, R. S. (1998). Intraspecific phylogeography across the point concep-tion biogeographic boundary. Evoluconcep-tion, 52(3), 734–745.
Clare, D. K., & Saibil, H. R. (2013). ATP- driven molecular chaperone ma-chines. Biopolymers, 99(11), 846–859.
Conesa, A., et al. (2005). Blast2GO: A universal tool for annotation, visu-alization and analysis in functional genomics research. Bioinformatics,
21(18), 3674–3676.
Dayan, D. I., Crawford, D. L., & Oleksiak, M. F. (2015). Phenotypic plasticity in gene expression contributes to divergence of locally adapted popu-lations of Fundulus heteroclitus. Molecular Ecology, 24(13), 3345–3359. DeBiasse, M. B., & Kelly, M. W. (2016). Plastic and evolved responses to
global change: What can we learn from comparative transcriptomics?
Journal of Heredity, 107(1), 71–81.
Dong, Y. W., et al. (2010). Difference in thermotolerance between green and red color variants of the Japanese Sea Cucumber, Apostichopus
ja-ponicus Selenka: Hsp70 and heat- hardening effect. Biological Bulletin, 218(1), 87–94.
Edmands, S. (2001). Phylogeography of the intertidal copepod Tigriopus
californicus reveals substantially reduced population differentiation at
northern latitudes. Molecular Ecology, 10, 1743–1750.
Feder, M. E., & Hofmann, G. E. (1999). Heat- shock proteins, molecular chaperones, and the stress response: Evolutionary and ecological phys-iology. Annual Review of Physiology, 61, 243–282.
Feder, J. H., et al. (1992). The consequences of expressing hsp70 in
Drosophila cells at normal temperatures. Genes and Development, 6(8),
1402–1413.
Franssen, S. U., et al. (2014). Genome- wide transcriptomic responses of the seagrasses Zostera marina and Nanozostera noltii under a simulated heatwave confirm functional types. Marine Genomics, 15, 65–73. Gleason, L. U., & Burton, R. S. (2015). RNA- seq reveals regional differences
in transcriptome response to heat stress in the marine snail Chlorostoma
funebralis. Molecular Ecology, 24(3), 610–627.
Hoffmann, A. A, & Sgrò, C. M. (2011). Climate change and evolutionary adaptation. Nature, 470(7335), 479–485.
Hong, B. C., & Shurin, J. B. (2015). Latitudinal variation in the response of tidepool copepods to mean and daily range in temperature. Ecology,
96(9), 2348–2359.
Kelly, M. W., Sanford, E., & Grosberg, R. K. (2012). Limited potential for adaptation to climate change in a broadly distributed marine crusta-cean. Proceedings of the Royal Society B: Biological Sciences, 279(1727), 349–356.
Kenkel, C. D., & Matz, M. V. (2016). Gene expression plasticity as a mecha-nism of coral adaptation to a variable environment. Nature Ecology and
Evolution, 1, 14.
Kenkel, C. D., Meyer, E., & Matz, M. V. (2013). Gene expression under chronic heat stress in populations of the mustard hill coral (Porites
astreoides) from different thermal environments. Molecular Ecology, 22(16), 4322–4334.
King, A. M., & MacRae, T. H. (2015). Insect heat shock proteins during stress and diapause. Annual Review of Entomology, 60, 59–75. Li, H. (2011). A statistical framework for SNP calling, mutation discovery,
association mapping and population genetical parameter estimation from sequencing data. Bioinformatics, 27(21), 2987–2993.
Li, H., & Durbin, R. (2009). Fast and accurate short read alignment with Burrows- Wheeler transform. Bioinformatics, 25(14), 1754–1760. Li, H., et al. (2009). The sequence alignment/map format and SAMtools.
Bioinformatics, 25(16), 2078–2079.
Lindquist, S. (1986). The heat- shock response. Annual Review of
Biochemistry, 55, 1151–1191.
Narum, S. R., & Campbell, N. R. (2015). Transcriptomic response to heat stress among ecologically divergent populations of redband trout. BMC
Pereira, R. J., Barreto, F. S., & Burton, R. S. (2014). Ecological novelty by hybridization: Experimental evidence for increased thermal tolerance by transgressive segregation in Tigriopus californicus. Evolution, 68(1), 204–215.
Pereira, R. J., et al. (2016). Transcriptome- wide patterns of divergence during allopatric evolution. Molecular Ecology, 25(7), 1478–1493. Robinson, M. D., McCarthy, D. J., & Smyth, G. K. (2010). edgeR: A
Bioconductor package for differential expression analysis of digital gene expression data. Bioinformatics, 26(1), 139–140.
Robinson, M. D., & Oshlack, A. (2010). A scaling normalization method for dif-ferential expression analysis of RNA- seq data. Genome Biology, 11(3), R25. Schoville, S. D., et al. (2012). Investigating the molecular basis of local ad-aptation to thermal stress: Population differences in gene expression across the transcriptome of the copepod Tigriopus californicus. BMC
Evolutionary Biology, 12(1), 170.
Sorensen, J. G., et al. (2005). Full genome gene expression analysis of the heat stress response in Drosophila melanogaster. Cell Stress and
Chaperones, 10(4), 312–328.
Tangwancharoen, S., & Burton, R. S. (2014). Early life stages are not always the most sensitive: Heat stress responses in the copepod Tigriopus
cal-ifornicus. Marine Ecology Progress Series, 517, 75–83.
Tomanek, L. (2010). Variation in the heat shock response and its impli-cation for predicting the effect of global climate change on species’ biogeographical distribution ranges and metabolic costs. The Journal of
Experimental Biology, 213(6), 971–979.
Tomanek, L., & Somero, G. N. (1999). Evolutionary and acclimation- induced variation in the heat- shock responses of congeneric marine snails (genus Tegula) from different thermal habitats: Implications for limits of thermotolerance and biogeography. Journal of Experimental Biology,
202, 2925–2936.
Wang, W., et al. (2014). De novo transcriptome sequencing of the snail
Echinolittorina malaccana: Identification of genes responsive to
ther-mal stress and development of genetic markers for population studies.
Marine Biotechnology, 16(5), 547–559.
White, B. J., et al. (2007). Localization of candidate regions maintaining a common polymorphic inversion (2La) in Anopheles gambiae. PLoS
Genetics, 3(12), e217.
Willett, C. S. (2010). Potential fitness trade- offs for thermal tolerance in the intertidal copepod Tigriopus californicus. Evolution, 64(9), 2521–2534. Willett, C. S., & Ladner, J. T. (2009). Investigations of fine- scale
phylogeog-raphy in Tigriopus californicus reveal historical patterns of population divergence. BMC Evolutionary Biology, 9, 139.
Zhao, L., et al. (2015). Parallel gene expression differences between low and high latitude populations of Drosophila melanogaster and D.
simu-lans. PLOS Genetics, 11(5), e1005184.
SUPPORTING INFORMATION
Additional Supporting Information may be found online in the supporting information tab for this article.
How to cite this article: Lima TG, Willett CS. Locally adapted