A R T I C L E
Genomic Analysis of Immune Cell Infiltrates
Across 11 Tumor Types
Michael D. Iglesia, Joel S. Parker, Katherine A. Hoadley, Jonathan S. Serody,
Charles M. Perou*, Benjamin G. Vincent*
Affiliations of authors:Lineberger Comprehensive Cancer Center (MDI, JSP, KAH, JSS, CMP, BGV), Curriculum in Genetics and Molecular Biology (MDI, JSP), Department of Medicine (JSS, BGV), Department of Genetics (KAH, CMP), Department of Microbiology and Immunology (JSS), and Department of Pathology & Laboratory Medicine (CMP), University of North Carolina, Chapel Hill, Chapel Hill, NC
*Authors contributed equally to this work.
Correspondence to:Benjamin Vincent, MD, Lineberger Comprehensive Cancer Center, University of North Carolina, 125 Mason Farm Road, 27599 Chapel Hill NC (e-mail: [email protected]).
Abstract
Background:Immune infiltration of the tumor microenvironment has been associated with improved survival for some patients with solid tumors. The precise makeup and prognostic relevance of immune infiltrates across a broad spectrum of tumors remain unclear.
Methods:Using mRNA sequencing data from The Cancer Genome Atlas (TCGA) from 11 tumor types representing 3485 tumors, we evaluated lymphocyte and macrophage gene expression by tissue type and by genomic subtypes defined within and across tumor tissue of origin (Cox proportional hazards, Pearson correlation). We investigated clonal diversity of B-cell infiltrates through calculating B-cell receptor (BCR) repertoire sequence diversity. All statistical tests were two-sided. Results:High expression of T-cell and B-cell signatures predicted improved overall survival across many tumor types including breast, lung, and melanoma (breast CD8_T_Cells hazard ratio [HR]¼0.36, 95% confidence interval [CI]¼0.16 to 0.81,
P¼.01; lung adenocarcinoma B_Cell_60gene HR¼0.71, 95% CI¼0.58 to 0.87,P¼7.80E-04; melanoma LCK HR¼0.86, 95% CI¼0.79 to 0.94,P¼6.75E-04). Macrophage signatures predicted worse survival in GBM, as did B-cell signatures in renal tumors (Glioblastoma Multiforme [GBM]: macrophages HR¼1.62, 95% CI¼1.17 to 2.26,P¼.004; renal: B_Cell_60gene HR¼1.17, 95% CI¼1.04 to 1.32,P¼.009). BCR diversity was associated with survival beyond gene segment expression in melanoma (HR¼2.67, 95% CI¼1.32 to 5.40,P¼.02) and renal cell carcinoma (HR¼0.36, 95% CI¼0.15 to 0.87,P¼.006). Conclusions:These data support existing studies suggesting that in diverse tissue types, heterogeneous immune infiltrates are present and typically portend an improved prognosis. In some tumor types, BCR diversity was also associated with survival. Quantitative genomic signatures of immune cells warrant further testing as prognostic markers and potential biomarkers of response to cancer immunotherapy.
The complex interplay between solid tumors and host immu-nity has been widely studied but remains incompletely under-stood. In multiple tumor types, tumor-infiltrating lymphocytes (TILs) have been associated with clinical outcomes (1–8). For ex-ample, CD8þ
TILs have been shown to be favorably prognostic in melanoma, colorectal, breast, ovarian, and non–small cell lung cancer. In selected tumors, it has been demonstrated that these CD8þ
TILs are able to specifically kill tumor cells (9,10).
Several schemas have been developed to leverage immune infil-tration as a prognostic factor (11,12). Solid tumors are thought to cultivate an immunosuppressive microenvironment that promotes exhaustion of TILs and induction of a protumor, in-flammatory wound-healing response (13). This is supported by data that regulatory T-cells (Treg), tumor-associated macro-phages (TAMs), and/or myeloid-derived suppressor cells (MDSCs) predict worse outcomes in melanoma, renal cell
ARTICLE
Received:December 21, 2015;Revised:March 7, 2016;Accepted:April 26, 2016
©The Author 2016. Published by Oxford University Press. All rights reserved. For Permissions, please e-mail: [email protected]. 1 of 4 doi: 10.1093/jnci/djw144
carcinoma, breast, ovarian, bladder, prostate, and non–small cell lung cancer (14–16). The wide impact and clinical relevance of the multifaceted tumor-associated immune response makes it critical to develop a more thorough understanding of this phenomenon.
Next-generation sequencing and large-scale genomics have become critical to our understanding of human cancers. Through efforts such as The Cancer Genome Atlas (TCGA) Project, genomic data on a wide variety of tumors have become available. By combining diverse datasets, groupings both within and across tumor types have emerged (17). This has deepened our understanding of distinctions within tumor types and high-lighted similarities between previously distinct tumor types, such as identification of the “squamous” genomic subtype, which combines lung squamous, head and neck, and some bladder cancers into a single group (17,18). While many tumor types are thought to harbor prognostic TILs, the interplay be-tween genomic subtype and the antitumor immune response has not been adequately explored.
Cancer immunotherapy has been pursued as an alternative or complement to cytotoxic chemotherapy and radiotherapy. Inhibition of the immune checkpoint proteins CTLA-4, PD-1, and PD-L1 reduces the ability of the tumor microenvironment to sup-press host antitumor immunity (19–21), and immune checkpoint inhibitors have shown clinical responses in diverse cancers (20– 24). As these and other immune-targeted therapies gain wide-spread clinical usage, a key question is identification of tumor characteristics that predict response. Evidence in melanoma and bladder cancer suggests that responders may harbor clonally restricted, antitumor TILs that are able to respond after immuno-suppression has been lifted (23,25). In this work, we use mRNA-seq data for a large number of diverse tumors to analyze the prevalence and prognostic relevance of tumor-immune infiltrates and evaluate the clonal diversity of tumor-infiltrating B-cells.
Methods
Datasets
The dataset used comprised mRNA-seq data from 3485 TCGA tumors (see TCGA Data Portal at https://tcga-data.nci.nih.gov/ tcga/, CGHub at https://cghub.ucsc.edu/), which was originally described in Hoadley, 2014, with the following modifications (17). AML samples were removed. Data for 329 melanoma sam-ples were added (26). All samsam-ples were assayed by mRNA-seq, as described by the TCGA Research Network (27). Gene expres-sion values were represented as RSEM data normalized within each sample to the upper quartile of total reads (37). For gene signature and hierarchical clustering analyses, gene expression values were median-centered across all 3485 tumors. Genomic subtypes within tissue types and TCGA Pan-Cancer Cluster of Clusters Assignments (COCA) subtypes were obtained from pre-vious publications of those TCGA tissue types (17,18,27–33). No COCA subtype was assigned to melanoma samples, and thus melanoma was assigned to its own group in COCA subtype analyses (34).
Gene Signatures and BCR Expression and Diversity
Several immune gene signatures were previously developed by unsupervised hierarchical clustering of mRNA-seq expression data for 728 breast tumor samples (35). In addition to these, other tumor-infiltrating lymphocyte and macrophage gene
signatures were obtained from published studies. Multiple sig-natures were used for each cell type to reduce bias from individ-ual gene lists and included: IGG_Cluster (36), B_Cell (37), B_Cells (12), B_Cell_cluster (35), B_Cell_60gene (38), and TNBC_B_Cell (39) are B/plasma cell signatures. T_Cell (37), T_Cells (12), T_Cell_cluster (35), CD8 (37), CD8_cluster (35), LCK (40), and TNBC_T-Cell (39) are T-cell signatures, with the CD8 and CD8_cluster signatures specifically representing CD8þ
T-cells. MacTh1_cluster (35), CD68_cluster (35), Mac_CSF1 (41), and Macrophages (12) are all macrophage/monocyte signatures. For each signature, the mean expression of all genes in the signa-ture was used as the signasigna-ture score for a given tumor/patient. Expression levels for all BCR gene segments, overall BCR gene segment expression, and BCR diversity values were calculated according to previously described methods (35).
Statistical Analysis
Gene signature expression levels were compared using one-way analysis of variance (ANOVA). Correlations were evaluated us-ing Pearson coefficient calculation. Univariate survival analyses were performed by Cox proportional hazards modeling, with each signature tested as a continuous variable. Multivariable Cox proportional hazards models were used to evaluate the prognostic value of individual gene expression signatures when combined with tumor type/subtype information and clinical variables. All multivariable survival analyses included one gene expression signature, as well as patient age and pathologic tu-mor size (T), node (N), and metastasis (M) stages. Pathologic T, N, and M stages were binned into T1 vs T>1, N0 vs N>0, and M0 vs M>0 groups to reduce the number of variables in each model and to standardize across tumor types. Multiple testing correction was done by calculating q-values for eachPvalue, and statistically significant q-values were confirmed using the Kaplan-Meier estimator and log-rank testing of high-expression vs low-expression groups. All survival analyses were performed in R version 2.13.1 using the “survival” package (42,43). To as-sess the statistical significance of association between BCR di-versity and survival, multivariable Cox proportional hazard models were constructed for each tumor tissue type where vari-ables included BCR gene segment expression, diversity, and the expression*diversity interaction term. Separate models were fit using the expression term alone, and statistical significance was assessed by performing analysis of variance comparing the full and reduced models using the likelihood ratio test imple-mented in R (43). APvalue of less than .05 was considered sta-tistically significant, and all statistical tests were two-sided.
Results
Genomic Signatures of Immune Infiltration in Human Cancer
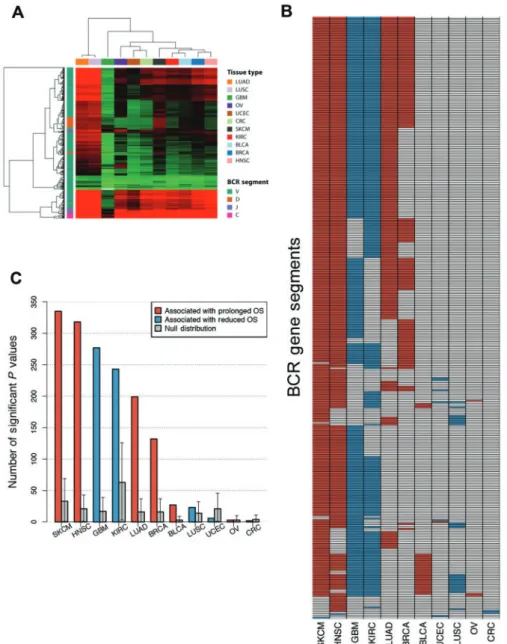
To clarify the role of tumor-infiltrating immune cells in human cancer, gene signatures associated with immune cell types were evaluated in a diverse set of 3485 tumors representing 11 tumor types. Signatures chosen were previously published as corre-sponding to tumor-infiltrating immune cells in at least one solid tumor type. A heat map of signature expression across all 3485 samples ordered by tissue type and genomic subtype showed high expression across particular cancer types and subtypes (Figure 1). Immune signature expression in general was highest in the basal-like bladder, basal-like and human epidermal
ARTI
growth factor 2 (HER2)–enriched breast, immunoreactive ovar-ian, and immune melanoma subtypes, as well as in the head and neck, clear cell renal cell, lung adenocarcinoma, and lung squamous tissue types.
While only the ovarian immunoreactive and melanoma im-mune subtypes were defined with imim-mune infiltration as a key feature, immune infiltration often segregated by tumor genomic subtype. Similarly, assignment by Cluster of Cluster Analysis classification yielded differences in immune gene signature ex-pression (Figure 2;Supplementary Figure 1, available online) (17). Within all tumor types, immune gene signatures tended to be positively correlated, with the average Pearson correlation above .63 for all tumor tissue or COCA types (Figure 3). Signatures repre-senting the same immune cell type in most cases were highly correlated regardless of tissue of origin or COCA type. The lowest intersignature correlation was among glioblastoma samples, which showed low expression of lymphocyte-related gene signa-tures and high expression of signasigna-tures related to macrophages and other myeloid-derived cell types.
Prognostic Significance of Immune Infiltration Signatures
Univariate survival analyses for immune signature expression within tissue and COCA types are summarized inTable 1and Supplementary Table 1(available online), with hazard ratios pro-vided inSupplementary Tables 2 and 3(available online). The number of events and median follow-up times varied substan-tially between tumor types. Almost all immune signatures tested were prognostic in the complete set of 3485 samples. The breast, head and neck, lung adenocarcinoma, melanoma, and endome-trial groups showed improved survival among patients with tu-mors scoring high for a variety of immune signatures (eg, breast CD8_T_Cells hazard ratio [HR]¼0.36, 95% confidence interval [CI] ¼0.16 to 0.81,P¼.01; head and neck B_Cell_Cluster HR¼0.82, 95% CI¼0.74 to 0.91,P¼2.22E-04; lung adenocarcinoma B_Cell_
60gene HR¼0.71, 95% CI¼0.58 to 0.87,P¼7.80E-04; melanoma LCK HR¼0.86, 95% CI¼0.79 to 0.94,P¼6.75E-04; endometrial CD8_cluster HR¼0.71, 95% CI¼0.55 to 0.92,P¼.001). When sam-ples were divided by COCA subtype, the LUAD-enriched, squa-mous, UCEC, and melanoma subtypes showed improved survival with high immune signature expression for at least four signa-tures each (LUAD-enriched HR¼0.73/0.69/0.75/0.77, 95% CI¼0.63 to 0.86/0.58 to 0.82/0.61 to 0.92/0.64 to 0.92,P¼1.32E-04/2.14E-05/. 006/.004, for IGG_Cluster/B_Cell_60gene/T_Cells/CD8_cluster; squamous HR¼0.89/0.86/0.85/0.87, 95% CI¼0.83 to 0.96/0.78 to 0. 95/0.76 to 0.95/0.79 to 0.96,P¼.003/.003/.006/.004, for B_Cell_clus ter/T_Cell_cluster/T_Cells/CD8_cluster; UCEC HR¼0.71/0.70/0. 69/0.71, 95% CI¼0.54 to 0.93/0.52 to 0.93/0.50 to 0.96/0.55 to 0.93,
P¼.01/.02/.03/.01, for TNBC_T-Cell/LCK/T_Cells/CD8_cluster; mel-anoma HR¼0.61/0.86/0.86/0.80, 95% CI¼0.46 to 0.79/0.80 to 0.92/ 0.79 to 0.94/0.71 to 0.91,P¼2.09E-04/1.77E-05/6.75E-04/6.04E-04, for B_Cell/B_Cell_60gene/LCK/Mac_CSF1). Signatures representing lymphocytes more consistently predicted overall survival than did other signatures; the lung adenocarcinoma, head and neck, breast, and endometrial tumor types showed consistent prognos-tic ability for lymphocyte signatures and a decreased association between survival and macrophage signatures. Interestingly, in clear cell renal cell carcinoma there was an association of B-cell signature expression with worse survival (eg, IGG_Cluster HR¼1. 22, 95% CI¼1.08 to 1.39,P¼.002). Macrophage-related signatures were less commonly prognostic though they were associated with worse survival overall and within GBM (eg, Macrophages HR¼1.62, 95% CI¼1.17 to 2.26,P¼.004).
Multivariable survival analyses of immune signatures were performed for each tumor tissue type individually, incorporat-ing patient age, pathologic stage, and signature expression (Supplementary Tables 4-11, available online). Multivariable modeling results largely supported the results seen in the uni-variate survival models, with head and neck, lung adenocarci-noma, and melanoma showing consistent prognostic benefit for patients with high immune gene expression (eg, B_Cell_cluster HR¼0.82/0.77/0.92, 95% CI¼0.73 to 0.91/0.65 to 0.93/0.86 to 0.98, Figure 1.Concordant expression of genes from different immune cell types in specific solid tumor types and subtypes. Tumors are ordered bycolumnaccording to tis-sue type and subtype. Within signatures, genes are ordered byrowby unsupervised hierarchical clustering across all patients. Log 2 gene expression is median-cen-tered across all samples. IGG_Cluster, B_Cell, B_Cells, B_Cell_cluster, B_Cell_60gene, and TNBC_B_Cell are B/plasma cell signatures. T_Cell, T_Cells, T_Cell_cluster, CD8, CD8_cluster, LCK, and TNBC_T-Cell are T-cell signatures, with the CD8 and CD8_cluster signatures specifically representing CD8þ T-cells. MacTh1_cluster,
CD68_cluster, Mac_CSF1, and Macrophages are all macrophage/monocyte signatures.
Figure
2.
Immune
gene
signature
expression
by
tumor
tissue
type
and
Cancer
Clus
ter
of
Clusters
Assignments
(COCA
)
subtypes.
Boxplots
of
expression
of
IGG_Cl
uster,
CD8,
and
CD68_clus
ter
gene
expression
signatures,
as
well
as
genes
PD-1,
PDL-1,
and
CTLA-4,
by
tumor
tissue
type
(A,
C,
E,
G,
I,
K)
or
COCA
sub
type
(B,
D,
F,
H,
J,
L)
are
shown.
Stati
stical
significance
testing
was
done
using
one-way
analysis
of
variance
(ANOVA).
Expression
of
immune
genes
was
consistently
hig
h
in
SKCM,
HNSC,
LUAD,
LUSC,
and
KIRC
tumors.
AN
OVA
P
values
for
gene
or
signature
expression
by
tissue
type/COCA
group:
CD8
P
¼
5.12E-155/6.26E-169;
IGG_Clust
er
P
¼
1.01E-238/6.42E
-224;
CD68_cluster
P
¼
1.09-208/3
.77E-199;
PD
-1
P
¼
6.46E-97/8.71E-103;
PD-L1
P
¼
1.90E-271/1.11E
-279;
CTLA-4
P
¼
4.66E-1
17/4.85E-127.
All
statistical
tests
were
two-sided.
ARTI
P¼.005/3.30E-04/.01 for head and neck/lung adenocarcinoma/ melanoma). GBM, ovarian, and endometrial tumors were ex-cluded from multivariable analyses within tissue types, as path-ologic staging data were not available.
Prognostic BCR Gene Segment Expression
Previous investigations of TILs have suggested that many tumors contain clonally restricted T- and/or B-cell infiltrates
(44–46), consistent with an antigen-driven response. As previ-ously described, mRNA-seq data can be used to estimate the relative clonal diversity of B-cell populations and discover as-sociations between specific BCR gene segment expression and improved survival (35). Given our prior results that B-cell gene signature expression was more statistically significantly asso-ciated with improved OS than either T-cell gene signature ex-pression or the classical clinical prognostic variables of age and lymph node involvement in breast cancer, and that spe-cific BCR segments where expression was associated with OS Figure 3.Correlation of lymphocyte infiltration signatures in tumors. In(A)all samples and(B-L)within samples in each tissue type, Pearson correlations are shown be-tween all immune gene signatures.
varied by tumor subtype, we were interested in exploring BCR gene segment expression associations with survival in the broader TCGA datasets. Figure 4A illustrates BCR gene seg-ment expression across all tissue types, highlighting the same tissue types identified by gene signature analysis. While BCR expression was able to distinguish certain samples and tumor types as high expressers, expression was high across multiple BCR gene segments in such samples. To more specifically dis-sect the importance of oligoclonal B-cell populations, we de-termined if individual BCR gene segment expression was associated with overall survival (Figure 4B). For melanoma and head and neck squamous cell carcinoma, expression of the majority of BCR gene segments was associated with prolonged survival whereas in renal cell carcinoma and glioblastoma multiforme most segments were associated with reduced
survival. There was a high degree of overlap of prognostic BCR segments across tumor types in which many BCRs were prog-nostic (melanoma, head and neck, glioblastoma, renal cell, lung adenocarcinoma, and breast). To understand the statisti-cal significance of individual BCR gene segment expression, we assessed for each tumor type whether the number of prog-nostic BCR segments exceeded the number of progprog-nostic genes expected by chance. To do this, we used a bootstrap resam-pling approach by randomly choosing a subset of genes of the same size as the number of total BCR gene segments (n¼1000 resamplings) and considering as the null distribution the 95% confidence interval of the number of prognostic genes in the resampling dataset. For seven tumor types, the number of prognostic BCR segments exceeded the upper confidence in-terval of the null distribution (Figure 4C).
Figure 4.B-cell receptor (BCR) gene segment expression and pattern of BCR gene segments, where expression was associated with overall survival by tumor type.A) Unsupervised hierarchical clustering of average BCR gene segment expression by tissue type.B)Grid of BCR gene segments, where increased expression was statisti-cally significantly associated with prolonged overall survival (OS;red) and gene segments associated with diminished OS (blue).C)Number of gene segments with sta-tistically significant association with OS by tumor type. Cox proportional hazard models were built using Log10gene expression for each gene segment. Null distributions were estimated by bootstrap resampling (n¼1000) of 353 random genes and calculating the number where expression was associated with OS.Error bars show the 95% bootstrap confidence interval.
Figure
5.
B-cell
recep
tor
(BCR)
variable
gene
segment
expression
and
diversity
by
tumor
type.
BCR
V
segment
sequence
diversity
(by
log10(effective
number
of
specie
s))
vs
BCR
V
segment
expression
(by
log10(read
counts))
for
all
tu-mor
type
s.
In
eac
h
plot,
tumors
of
a
single
type
are
colored
in
red
,
with
all
other
tumors
colored
in
gray.
ARTI
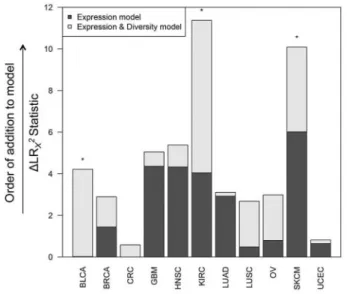
Figure 5shows BCR gene segment expression and sequence diversity for all samples and demonstrates the existence of a high-expression, low-diversity group composed mainly of a sub-set of melanoma, breast, head and neck, renal cell, and ovarian tumors. To test the association of restricted BCR diversity with survival, Cox proportional hazards models were built using BCR-variable gene segment expression, diversity, and the interaction term between expression and diversity. For each tissue type, this model was compared with a reduced model containing BCR gene segment expression as the sole variable. These models were compared using analysis of variance to assess whether including the diversity term in the full model provided a statistically signifi-cantly more robust explanation of variance than the expression term alone. This approach was used because B-cell gene segment expression was highly correlated with B-cell gene signature ex-pression, which was statistically significantly associated with overall survival in multiple tumor types (Table 1). The results of this analysis are shown inFigure 6. The full model was found to be statistically significantly better at predicting survival in blad-der, renal cell, and melanoma datasets. Decreased diversity was associated with improved survival in melanoma (HR¼2.67, 95% CI¼1.32 to 5.40,P¼.02). In contrast, decreased diversity was as-sociated with diminished overall survival in renal cell carcinoma (HR¼0.36, 95% CI¼0.15 to 0.87,P¼.006).
Discussion
Here we present several key aspects of a prognostically relevant immune response, determined from mRNA-seq data across a diverse set of human tumors. Patients with apparently benefi-cial tumor-immune infiltrates had high levels of immune signa-ture expression for several cell types, including cytotoxic and helper T-cells, B/plasma cells, and macrophages/monocytes. Among these highly infiltrated tumors, a subset contained a highly expressed population of BCRs with lower sequence diver-sity. Squamous and basal-like COCA subtypes showed in-creased immune gene signature expression and prognostic significance. The fact that these subtypes were defined compre-hensively by global gene expression, protein levels, DNA copy number, miRNA, and DNA methylation suggests that subtype-defining features may be responsible for the shared immuno-genic phenotype.
Most investigations into the role of TILs in human tumors have focused on T-cells. Multiple studies have shown T-cell TILs to be associated with response to immune checkpoint inhi-bition and survival (23,47–49). This work adds to the growing body of literature identifying T-cell TILs as a positive prognostic feature. Less work has been done evaluating the role of B-cells in solid tumors, though CD20 expression has been associated with improved survival in breast and ovarian cancer (10,50). Here we demonstrate that in all tumor types analyzed B-cell gene expression, including expression of BCR gene segments, was highly correlated with expression of T-cell genes. The strong correlation of immune signature expression across dis-tinct immune cell types illustrates that the tumor-immune in-filtrate is diverse but somewhat predicable and consistent, with a supportive role for B-cell TILs in the antitumor immune re-sponse. The addition of B-cell clonal diversity analysis repre-sents a novel aspect of tumor-immune research and highlights the importance of B-cell TILs in diverse solid tumor types.
Our analysis of adaptive immune receptor repertoire diver-sity is limited by evaluation of BCR repertoires alone. We fo-cused on the BCR for one major technical reason. The diversity
estimate used here depends on the degree of sequence variation within the immunoglobulin-variable loci generated by somatic hypermutation. Because the TCR does not undergo somatic hypermutation, we are not able to measure TCR diversity using this approach. Our study is also limited by use of gene expres-sion data to infer characteristics of the tumor-immune micro-environment without companion cellular assays, which were not obtainable from TCGA samples. Although the immune gene signatures reported here have been published and well-validated to correspond to specific cellular populations (12,35), we were unable to evaluate abundances of more complex im-mune cell phenotypes that may be important in tumor immu-nobiology and accessable via multiparameter IHC or flow cytometry. Nonetheless, our results are important in illustrating the power of immune gene signature and BCR repertoire analy-sis applied to a large and diverse RNA-seq dataset. It is unclear whether immunohistochemistry-based methods of interrogat-ing the tumor-immune microenvironment, such as the Immunoscore (11), will outperform genomics methods for pro-ductive biomarker development.
For most of the tumor types tested, immune infiltrates were associated with improved survival; however, there were three tumor types that were exceptions: colorectal adenocarcinoma, clear cell renal cell carcinoma, and GBM. There are many stud-ies indicating a beneficial role for TILs in human colorectal can-cer (51–53). The failure to detect these associations in TCGA data may have to do with the lack of adequate follow-up, low event rate, and low number of patients with mismatch repair gene mutations (54). In renal cell carcinoma, high expression of B-cell signatures and decreased BCR diversity (consistent with an antigen-driven response) predicted poor survival. Previous work has suggested that this tumor type may contain abundant Figure 6.Multivariable Cox proportional hazard modeling results for B-cell re-ceptor (BCR) gene segment diversity vs overall survival. Eachcolumnindicates one tumor tissue type. CoxPH survival models were fit with BCR variable gene segment expression alone as an explanatory variable (Expression model) and in-cluding both expression and diversity as explanatory variables (Expression & Diversity model).Dark gray barsshow change in LRv2statistic between the Expression model and the null model, andlight gray barsshow the change in LR v2statistic between the Expression model and the Expression & Diversity model (ie, a measure of the extent of increased information included in the latter model). Tumor types in which the Expression & Diversity model provided a sta-tistically significantly better fit than the Expression model alone (P<.05 by LRT) are indicated by*. All statistical tests were two-sided.
regulatory B-cells (Breg), which may explain this finding. Immune infiltration appeared to predict worse outcomes in GBM as well. As in our data, infiltrating macrophages and/or microglia often represent a large proportion of immune trates (55,56). The dominance of TAMs within the immune infil-trate of GBM is consistent with a negative clinical impact.
In summary, for most solid tumor types, expression of im-mune gene signatures predicted a more favorable outcome. Analysis of potential clonal restriction suggests that in some tu-mors with heavy immune infiltration, B-cell clonal restriction adds prognostic information. This may be because of tumor an-tigen–driven expansion of specific B-cell clones. Not all tumor types show these common features, with counterexamples be-ing GBM and clear cell renal cell carcinoma, where high immune infiltration predicted a worse outcome. Thus, measures of im-mune cell phenotypes, BCR (and potentially TCR) diversity, and tissue type or subtype are needed to correctly interpret, and likely act upon, these characteristics of the tumor microenvi-ronment. High levels of pretreatment CD8þ
TILs have correlated with response to immune checkpoint inhibition in melanoma and bladder cancer (23,47). It will be important to test whether quantification of immune infiltrates using mRNA-seq predicts clinical response to these and other immunotherapeutic strate-gies going forward.
Funding
This study was supported by funds from the following sources: U24-CA143848-06 (The Cancer Genome Atlas), the National Cancer Institute Breast Specialized Programs of Research Excellence program (P50-CA58223-09A1), RO1-CA195740-01, the Breast Cancer Research Foundation, UNC University Cancer Research Fund, UNC Oncology Clinical Translational Research Training Program (5K12CA120780), and William Guy Forbeck Research Foundation.
Notes
The funders had no role in study design, the data collection or analysis, the decision to publish, or the preparation of the man-uscript. We would like to thank the Perou and Vincent labs for helpful suggestions.
References
1. Balch CM, Riley LB, Bae YJ, et al. Patterns of human tumor-infiltrating lym-phocytes in 120 human cancers.Arch Surg.1990;125(2):200–205.
2. Lee S, Margolin K. Tumor-infiltrating lymphocytes in melanoma.Curr Oncol Rep.2012;14(5):468–474.
3. Kandalaft LE, Motz GT, Duraiswamy J, et al. Tumor immune surveillance and ovarian cancer: lessons on immune mediated tumor rejection or tolerance. Cancer Metastasis Rev.2011;30(1):141–151.
4. Anagnostou VK, Brahmer JR. Cancer Immunotherapy: A Future Paradigm Shift in the Treatment of Non-Small Cell Lung Cancer.Clin Cancer Res.2015; 21(5):976–984.
5. Finke JH, Rayman PA, Ko JS, et al. Modification of the tumor microenviron-ment as a novel target of renal cell carcinoma therapeutics.Cancer J.2013; 19(4):353–364.
6. Liakou CI, Narayanan S, Ng Tang D, et al. Focus on TILs: Prognostic signifi-cance of tumor infiltrating lymphocytes in human bladder signifi-cancer.Cancer Immun.2007;7:10.
7. Schoenfeld JD. Immunity in head and neck cancer.Cancer Immunol Res.2015; 3(1):12–17.
8. Lee AH, Gillett CE, Ryder K, et al. Different patterns of inflammation and prognosis in invasive carcinoma of the breast.Histopathology. 2006;48(6): 692–701.
9. Yee C, Thompson JA, Byrd D, et al. Adoptive T cell therapy using antigen-specific CD8þT cell clones for the treatment of patients with metastatic
melanoma: in vivo persistence, migration, and antitumor effect of trans-ferred T cells.Proc Natl Acad Sci U S A.2002;99(25):16168–16173.
10. Milne K, Kobel M, Kalloger SE, et al. Systematic analysis of immune infiltrates in high-grade serous ovarian cancer reveals CD20, FoxP3 and TIA-1 as posi-tive prognostic factors.PLoS One.2009;4(7):e6412.
11. Galon J, Pages F, Marincola FM, et al. Cancer classification using the Immunoscore: a worldwide task force.J Transl Med.2012;10:205.
12. Bindea G, Mlecnik B, Tosolini M, et al. Spatiotemporal dynamics of intratu-moral immune cells reveal the immune landscape in human cancer. Immunity.2013;39(4):782–795.
13. Schreiber RD, Old LJ, Smyth MJ. Cancer immunoediting: integrating immu-nity’s roles in cancer suppression and promotion.Science.2011;331(6024): 1565–1570.
14. Gobert M, Treilleux I, Bendriss-Vermare N, et al. Regulatory T cells recruited through CCL22/CCR4 are selectively activated in lymphoid infiltrates sur-rounding primary breast tumors and lead to an adverse clinical outcome. Cancer Res.2009;69(5):2000–2009.
15. Biswas SK, Allavena P, Mantovani A. Tumor-associated macrophages: func-tional diversity, clinical significance, and open questions. Semin Immunopathol.2013;35(5):585–600.
16. Ostrand-Rosenberg S, Sinha P. Myeloid-derived suppressor cells: linking in-flammation and cancer.J Immunol.2009;182(8):4499–4506.
17. Hoadley KA, Yau C, Wolf DM, et al. Multiplatform analysis of 12 cancer types reveals molecular classification within and across tissues of origin.Cell.2014; 158(4):929–944.
18. Brennan CW, Verhaak RG, McKenna A, et al. The somatic genomic landscape of glioblastoma.Cell.2013;155(2):462–477.
19. Hodi FS, Butler M, Oble DA, et al. Immunologic and clinical effects of antibody blockade of cytotoxic T lymphocyte-associated antigen 4 in previously vacci-nated cancer patients.Proc Natl Acad Sci U S A.2008;105(8):3005–3010. 20. Herbst RS, Soria JC, Kowanetz M, et al. Predictive correlates of response to the
anti-PD-L1 antibody MPDL3280A in cancer patients.Nature.2014;515(7528): 563–567.
21. Topalian SL, Hodi FS, Brahmer JR, et al. Safety, activity, and immune corre-lates of anti-PD-1 antibody in cancer.N Engl J Med.2012;366(26):2443–2454. 22. Phan GQ, Yang JC, Sherry RM, et al. Cancer regression and autoimmunity
in-duced by cytotoxic T lymphocyte-associated antigen 4 blockade in patients with metastatic melanoma.Proc Natl Acad Sci U S A.2003;100(14):8372–8377. 23. Powles T, Eder JP, Fine GD, et al. MPDL3280A (anti-PD-L1) treatment leads to
clinical activity in metastatic bladder cancer.Nature.2014;515(7528):558–562. 24. Kluger H, Sznol M, Callahan M, et al. Survival, Response Duration, and
Activity by Braf Mutation (Mt) Status in a Phase 1 Trial of Nivolumab (Anti-Pd-1, Bms-936558, Ono-4538) and Ipilimumab (Ipi) Concurrent Therapy in Advanced Melanoma (Mel).Ann Oncol. 2014;25.
25. Robert L, Tsoi J, Wang X, et al. CTLA4 blockade broadens the peripheral T-cell receptor repertoire.Clin Cancer Res.2014;20(9):2424–2432.
26. Cancer Genome Atlas Network. Electronic address imo, Cancer Genome Atlas N. Genomic Classification of Cutaneous Melanoma.Cell.2015;161(7): 1681–1696.
27. Cancer Genome Atlas Research N. Comprehensive genomic characterization of squamous cell lung cancers.Nature.2012;489(7417):519–525.
28. Damrauer JS, Hoadley KA, Chism DD, et al. Intrinsic subtypes of high-grade bladder cancer reflect the hallmarks of breast cancer biology.Proc Natl Acad Sci U S A.2014;111(8):3110–3115.
29. Cancer Genome Atlas N. Comprehensive molecular portraits of human breast tumours.Nature.2012;490(7418):61–70.
30. Cancer Genome Atlas N. Comprehensive molecular characterization of hu-man colon and rectal cancer.Nature.2012;487(7407):330–337.
31. Cancer Genome Atlas N. Comprehensive genomic characterization of head and neck squamous cell carcinomas.Nature.2015;517(7536):576–582. 32. Brooks SA, Brannon AR, Parker JS, et al. ClearCode34: A prognostic risk
pre-dictor for localized clear cell renal cell carcinoma.Eur Urol.2014;66(1):77–84. 33. Cancer Genome Atlas Research N. Comprehensive molecular profiling of
lung adenocarcinoma.Nature.2014;511(7511):543–550.
34. Ojala KA, Kilpinen SK, Kallioniemi OP. Classification of unknown primary tu-mors with a driven method based on a large microarray reference data-base.Genome Med.2011;3(9):63.
35. Iglesia MD, Vincent BG, Parker JS, et al. Prognostic B-cell signatures using mRNA-seq in patients with subtype-specific breast and ovarian cancer.Clin Cancer Res.2014;20(14):3818–3829.
36. Fan C, Prat A, Parker JS, et al. Building prognostic models for breast cancer pa-tients using clinical variables and hundreds of gene expression signatures. BMC Med Genomics.2011;4:3.
37. Palmer C, Diehn M, Alizadeh AA, et al. Cell-type specific gene expression pro-files of leukocytes in human peripheral blood.BMC Genomics.2006;7:115. 38. Schmidt M, Bohm D, von Torne C, et al. The humoral immune system has a
key prognostic impact in node-negative breast cancer.Cancer Res.2008; 68(13):5405–5413.
39. Rody A, Karn T, Liedtke C, et al. A clinically relevant gene signature in triple negative and basal-like breast cancer.Breast Cancer Res.2011;13(5):R97. 40. Rody A, Holtrich U, Pusztai L, et al. T-cell metagene predicts a favorable
prog-nosis in estrogen receptor-negative and HER2-positive breast cancers.Breast Cancer Res.2009;11(2):R15.
ARTI
41. Beck AH, Espinosa I, Edris B, et al. The macrophage colony-stimulating factor 1 response signature in breast carcinoma.Clin Cancer Res.2009;15(3):778–787. 42. Team RDC. R: A Language and Environment for Statistical Computing. In;
2011.
43. Therneau T. A Package for Survival Analysis in S. In; 2012.
44. Hansen MH, Nielsen H, Ditzel HJ. The tumor-infiltrating B cell response in medullary breast cancer is oligoclonal and directed against the autoantigen actin exposed on the surface of apoptotic cancer cells.Proc Natl Acad Sci U S A. 2001;98(22):12659–12664.
45. Coronella JA, Spier C, Welch M, et al. Antigen-driven oligoclonal expansion of tumor-infiltrating B cells in infiltrating ductal carcinoma of the breast.J Immunol.2002;169(4):1829–1836.
46. Sainz-Perez A, Lim A, Lemercier B, et al. The T-cell receptor repertoire of tumor-infiltrating regulatory T lymphocytes is skewed toward public se-quences.Cancer Res.2012;72(14):3557–3569.
47. Buchbinder EI, McDermott DF. Cytotoxic T-Lymphocyte Antigen-4 Blockade in Melanoma.Clin Ther.2015;37(4):755–763.
48. Massari F, Santoni M, Ciccarese C, et al. PD-1 blockade therapy in renal cell carcinoma: current studies and future promises.Cancer Treat Rev.2015;41(2): 114–121.
49. Mahmoud SM, Paish EC, Powe DG, et al. Tumor-infiltrating CD8þ lympho-cytes predict clinical outcome in breast cancer.J Clin Oncol.2011;29(15): 1949–1955.
50. Mahmoud SM, Lee AH, Paish EC, et al. The prognostic significance of B lym-phocytes in invasive carcinoma of the breast.Breast Cancer Res Treat.2012; 132(2):545–553.
51. Tosolini M, Kirilovsky A, Mlecnik B, et al. Clinical impact of different classes of infiltrating T cytotoxic and helper cells (Th1, th2, treg, th17) in patients with colorectal cancer.Cancer Res.2011;71(4):1263–1271.
52. Dalerba P, Maccalli C, Casati C, et al. Immunology and immunotherapy of co-lorectal cancer.Crit Rev Oncol Hematol.2003;46(1):33–57.
53. Pages F, Berger A, Camus M, et al. Effector memory T cells, early metastasis, and survival in colorectal cancer.N Engl J Med.2005;353(25):2654–2666. 54. Le DT, Uram JN, Wang H, et al. PD-1 Blockade in Tumors with
Mismatch-Repair Deficiency.N Engl J Med.2015;372(26):2509–2520.
55. Hitchcock ER, Morris CS. Mononuclear cell infiltration in central portions of human astrocytomas.J Neurosurg.1988;68(3):432–437.
56. Morantz RA, Wood GW, Foster M, et al. Macrophages in experimental and hu-man brain tumors. Part 1: Studies of the macrophage content of experimental rat brain tumors of varying immunogenicity.J Neurosurg.1979;50(3):298–304.