POLICY-RELEVANT CHARACTERISTICS OF DEPRESSIVE AND ANXIETY DISORDERS IN PROSTATE CANCER SURVIVORS
Daniel Odey Erim
A dissertation submitted to the faculty at the University of North Carolina at Chapel Hill in partial fulfillment of the requirements for the degree of Doctor of Philosophy in the Department of
Health Policy and Management in the Gillings School of Global Public Health.
Chapel Hill 2018
iii
ABSTRACTDaniel Odey Erim: Policy-relevant characteristics of depressive and anxiety disorders in prostate cancer survivors
(Under the direction of George Pink and Sally Stearns)
The overarching goal of this study was to generate evidence that informs depression- and anxiety-care recommendations in American Cancer Society’s Prostate Cancer Survivorship Guidelines. This is important because major depression and clinically significant prostate cancer related anxiety (PCRA) may affect up to 1 million prostate cancer survivors, and little is known about who these survivors are, who gets appropriate care, or how PCRA’s affects health-related quality of life. These gaps in the literature have huge implications on the cancer survivorship experience, patient safety, and our ability to plan and implement meaningful interventions.
The goal of the first study was to describe patterns and predictors of depression and clinical diagnosis of depression. I analyzed secondary data and made the following findings: the prevalence of depression declines from 38% in the year of cancer diagnosis to about 20% 7 years later; risk factors for depression include being black, unemployed, young, having a history of depression, treatment decisional regret, a low annual income, and lack of exercise, the average rate of clinical diagnosis of depression was 44%, and the unmet need for depression care increases from 2 in 5 cases after cancer diagnosis to 3in 5 cases 7 years later. Survivors with undiagnosed depression were more likely to be black, less educated, employed, elderly, living with a cancer diagnosis fore more than three years, and few annual visits to primary care clinics.
iv
v
Now to Him who is able to do immeasurably more than all we ask or imagine, according to his power that is at work within us, to Him be glory in the church and in Christ Jesus throughout all generations,
vi
ACKNOWLEDGEMENTS
Great success is rarely achieved alone!
I would like to acknowledge everyone who has directly and/or indirectly contributed to this dissertation, and who has supported me during my journey through the PhD program in the Department of Health Policy and Management. I would also like to acknowledge members of my dissertation committee: Drs. Sally Stearns, George Pink, Marisa Domino, Antonia Bennet, Bradley Gaynes and Ron Chen. Thank you for taking time out of your extraordinarily busy schedules to focus on me. Thank you for the lessons, the guidance, the corrections, the affirmations, the pushes and prods, the ideas, the support and the leadership. I am truly grateful for your help.
I am also grateful to my wife, Theodora. You have been my rock throughout this process. Your love, your steadfastness, your unshakable faith in me, and your conviction in my vision energizes and emboldens me. Thank you for everything. I love you. And to my children Eliana and Ethan – Eliana started the journey with me, and Ethan joined after my comprehensive exams. Thank you for all those times you allowed me focus on my work, and for the typos you may or may not have inserted in them. I am grateful for all the support I received from my mother (Dr. [Mrs.]. Patience Erim), my sisters (Yvonne Ekpuk, Irvy Etta and Lorraine Onoyom), my father-in-law (His Royal Highness Utsu A.A. Nawa), and by brothers-in-law. I am also grateful for support from my faculty mentors at Harvard (Drs. Stephen Resch and Jane Kim).
vii
viii
TABLE OF CONTENTS
LIST OF TABLES --- xv
LIST OF FIGURES --- xvii
LIST OF ABBREVIATIONS --- xviii
CHAPTER 1: INTRODUCTION --- 1
1.1. Specific Aims --- 1
1.2. Significance --- 2
1.3. Innovation --- 5
1.4. Guide to Dissertation --- 6
REFERENCES --- 7
CHAPTER 2: STUDY DESIGN AND ANALYTIC METHODS --- 11
2.1. Introduction --- 11
2.2. Conceptual Models for Aims 1 & 2 --- 11
2.3. Data Source for Aims 1 & 2: --- 13
2.4. Analyses overview for Aims 1 & 2 --- 13
2.5. Identifying the occurrence of depression (sub-aim 1) --- 13
2.6. Identifying clinical diagnoses of depression (sub-Aim 1b & Aim 2) --- 14
2.7. Identifying depression treatment (Aim 2) --- 14
ix
2.9. Sub-Aim 1b: factors associated with depression diagnosis --- 16
2.10. Aim 2: sociodemographic factors associated with depression treatment --- 17
2.11. The PCaP/HCaP-NC dataset: Missing observations and impact on analytic methods --- 17
Dropouts from the PCaP/HCaP-NC study --- 17
Assessing factors associated with dropout from PCaP/HCaP–NC --- 18
Approach to dealing with missing data for Aims 1 & 2 --- 18
2.12. Overview of Aim 3 (a different health condition and a different dataset) --- 19
2.13. Conceptual model for Aim 3 --- 19
2.14. Data source for Aim 3: --- 19
2.15. Analyses overview for Aim 3 --- 20
2.16. Key measures in Aim 3 --- 20
Memorial Anxiety Scale for Prostate Cancer (MAX-PC) --- 20
SF-12 --- 20
SF-6D --- 21
2.17. Identifying the occurrence of depression for Aim 3 --- 21
2.18. Identifying the occurrence of clinically significant PCRA for Aim 3 --- 22
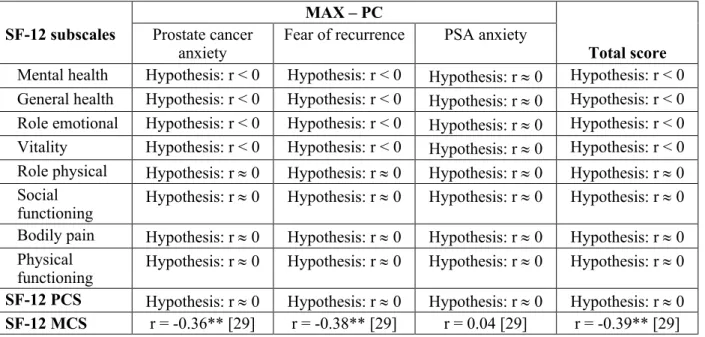
2.19. Sub-Aim 3a: correlations between MAX-PC and SF-12 scores --- 22
2.20. Sub-Aim 3b: to measure the association between PCRA and depression. --- 22
2.21. Sub-aim 3c: an algorithm that predicts SF-6D utilities from MAX-PC scores. --- 23
2.22. Potential limitations: --- 25
x
CHAPTER 3: SOCIODEMOGRAPHIC FACTORS ASSOCIATED WITH THE
OCCURRENCE AND DIAGNOSIS OF DEPRESSION IN PROSTATE CANCER SURVIVORS --- 40
INTRODUCTION --- 40
METHODS --- 41
Conceptual frameworks --- 41
Assessing factors associated with depression --- 41
Assessing factors associated with depression diagnosis --- 41
Data --- 42
Measures --- 42
Identifying depression --- 42
Identifying self-reported clinical diagnoses of depression. --- 43
Key explanatory variables --- 43
Control covariates of interest --- 43
Statistical Analyses --- 44
Assessing factors associated with depression --- 44
Assessing factors associated with self-reported clinical diagnosis of depression --- 45
Dealing with missing data --- 46
RESULTS --- 46
The prevalence of probable depression (based on SF-12 MCS) --- 46
Factors associated with probable depression (based on SF-12 MCS) --- 47
Sociodemographic characteristics: --- 47
xi
Health status factors: --- 47
Lifestyle factors: --- 48
The rate of depression diagnoses --- 48
Factors associated with self-reported clinical diagnosis of depression --- 48
Sociodemographic factors: --- 48
Clinical factors: --- 48
Health status factors: --- 49
Sensitivity analyses and model diagnostics --- 49
DISCUSSION --- 50
Strengths and limitations --- 52
CONCLUSION --- 53
REFERENCES --- 64
CHAPTER 4: RATES AND PREDICTORS OF DEPRESSION TREATMENT IN PROSTATE CANCER SURVIVORS --- 71
INTRODUCTION --- 71
METHODS --- 72
Conceptual framework --- 72
The data --- 72
Measures --- 73
Identifying self-reported clinical diagnosis of depression --- 73
Identifying self-reported treatment of depression --- 73
xii
Control covariates of interest --- 73
Statistical analyses --- 74
Assessing enrollment characteristics associated with self-reports of ever receiving a clinical diagnosis of depression. --- 74
Assessing factors associated with self-reported depression treatment conditional on self-reported clinical diagnosis of depression --- 74
Dealing with missing data --- 75
RESULTS --- 75
Rates of depression treatment --- 76
Baseline predictors of ever receiving a clinical diagnosis of depression --- 76
Factors associated with depression treatment conditional on clinical diagnosis of depression --- 76
Sociodemographic factors: --- 76
Clinical factors: --- 76
Health status factors: --- 77
Sensitivity analyses --- 77
DISCUSSION --- 77
Strengths and weaknesses --- 79
CONCLUSION --- 79
REFERENCES --- 88
CHAPTER 5: RELATIONSHIPS BETWEEN PROSTATE CANCER–RELATED ANXIETY AND HEALTH–RELATED QUALITY OF LIFE IN PROSTATE CANCER SURVIVORS --- 91
INTRODUCTION --- 91
xiii
The Data --- 91
Measures --- 92
Memorial Anxiety Scale for Prostate Cancer (MAX-PC) --- 92
SF-12 --- 92
SF-6D --- 92
Statistical Analyses --- 93
Correlations between MAX-PC and SF-12 --- 93
The association between PCRA and major depression --- 93
The MAX–PC to SF–6D crosswalk --- 94
RESULTS --- 95
Participants’ characteristics --- 95
Missing data --- 95
Correlations between MAX–PC and SF-12 --- 95
The association between PCRA and probable depression --- 96
The MAX-PC to SF-6D crosswalk --- 96
DISCUSSION --- 97
CONCLUSION --- 100
REFERENCES --- 110
CHAPTER 6. SUMMARY OF FINDINGS AND IMPLICATIONS FOR POLICY, PRACTICE, AND RESEARCH --- 113
Summary of findings --- 113
Implications from the first study --- 115
Implications from the second study --- 117
xiv
New information from combining findings across studies --- 119
Combining findings from Aims 1 & 2 --- 119
Combining findings from Aims 1 & 3 --- 120
REFERENCES --- 125
APPENDIX 1: SUPPLEMENTAL TEXT FOR CHAPTER 2 (EXCEPT SECTION 2.11) --- 128
REFERENCES --- 133
APPENDIX 2: SUPPLEMENTAL TEXT FOR CHAPTER 2 SECTION 2.11 --- 136
APPENDIX 3: SUPPLEMENTAL TEXT FOR CHAPTER 3 --- 149
APPENDIX 4: SUPPLEMENTAL TEXT FOR CHAPTER 4 --- 175
APPENDIX 5: SUPPLEMENTAL TEXT FOR CHAPTER 5 --- 180
Measures --- 180
Memorial Anxiety Scale for Prostate Cancer --- 180
SF-6D --- 180
Statistical analysis --- 180
Correlations between MAX-PC and SF-12 --- 180
The association between PCRA and depression --- 181
xv
LIST OF TABLES
Table 2.1: Suggested threshold SF-12 mental composite scores for identifying
individuals with presumed depression in population studies. ... 31
Table 2.2: Other variables for key hypotheses in Aims 1 and 2 ... 32
Table 2.3: Showing MAX-PC and SF-12 total and subscale scores to be evaluated, and the hypothesized correlations. ... 34
Table 2.4: Evidence on the validity of self-report in identifying a history of provider-diagnosed depression. ... 35
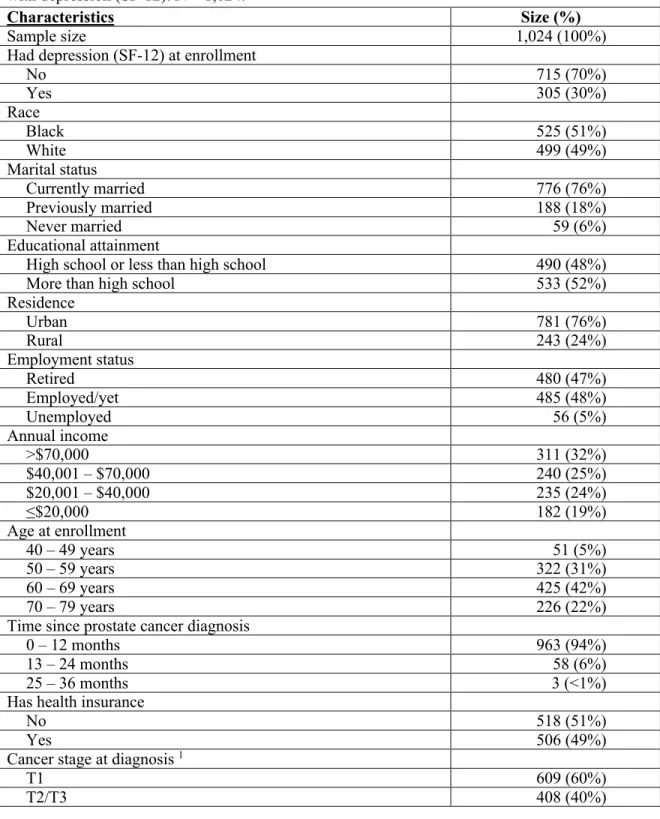
Table 3.1: Baseline characteristics of study participants that were assessed for factors associated with depression (SF-12). N = 1,024. ... 54
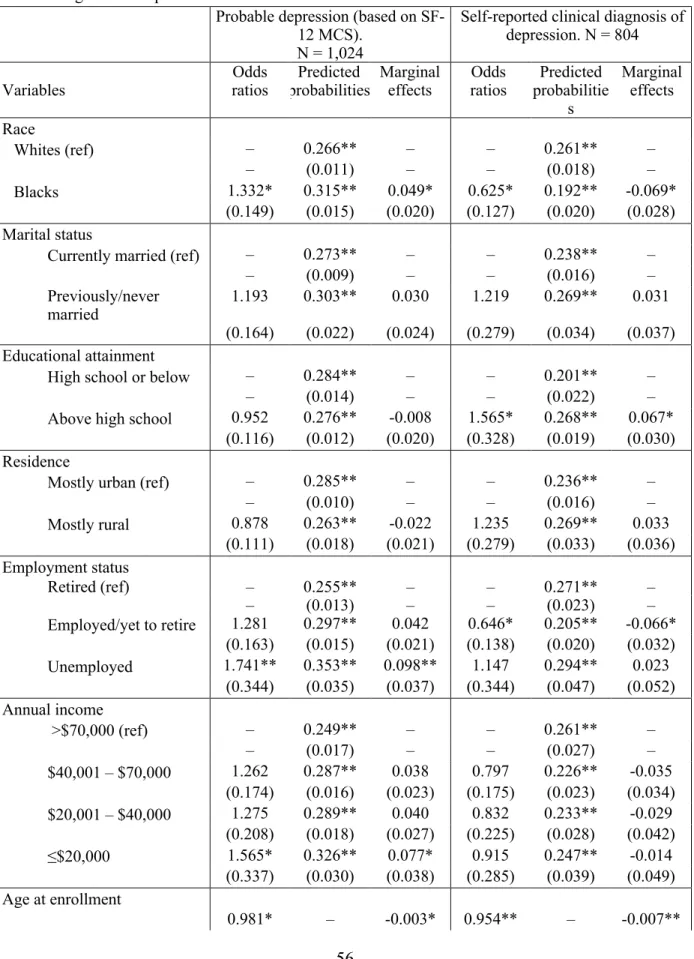
Table 3.2: Factors associated with probable depression (based on SF-12 MCS) and self-reported clinical diagnosis of depression ... 56
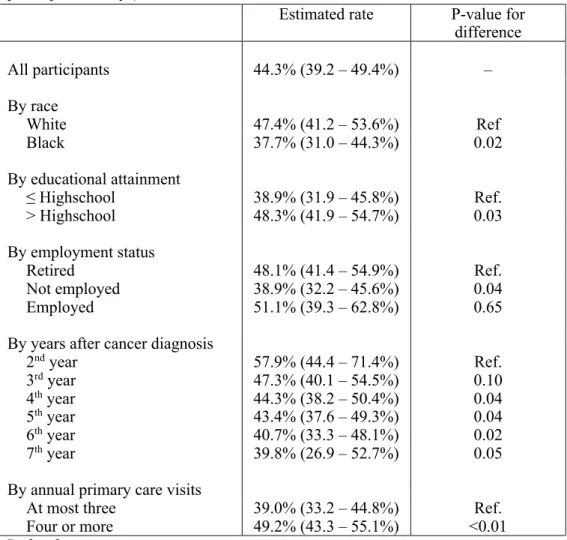
Table 3.3: Estimated rates of self-reported clinical diagnosis of depression among study participants with probable depression based on SF-12 MCS (N = 647 participant-surveys) ... 59
Table 3.4: A comparison of prostate cancer survivors during enrollment in PCaP and in SEER by race and age ... 60
Table 4.1: Baseline characteristics of study participants that were associated with self-reports of ever receiving a clinical diagnosis of depression (N = 1,031) ... 80
Table 4.2: Depression treatment rates conditional on depression diagnosis (N = 138 participant-surveys) ... 82
Table 4.3: Baseline predictors of ever receiving a clinical diagnosis of depression (N = 1,031) ... 83
Table 4.4: Factors associated with depression treatment conditional on depression diagnosis (N = 132) ... 85
Table 5.1: Baseline characteristics of all NC-ProCESS participants (N = 1,016) ... 101
Table 5.2: Correlation matrix showing linear relationships between SF-12 and MAX-PC subscales (N ≥ 988) ... 103
Table 5.3: Measures of association between current probable depression (based on SF-12 MCS and clinically significant PCRA (N = 935) ... 104
Table 5.4: Measures of prediction accuracy (N = 453) ... 106
Table 5.5: Characteristics of the crosswalk (N = 453) ... 107
xvi
Appendix Table 1.1: Studies reporting sociodemographic factors associated with depression recognition in various patient populations (studies on US cancer patients
are bold and italicized). ... 128 Appendix Box 1.1: Web links to PCaP/HCaP-NC questionnaires ... 131 Appendix Table 1.2: State of the evidence on variables associated with both PCRA
and HRQOL ... 132 Appendix Section 2.1: Basic descriptions of analytic variables in the dataset ... 136 Appendix Section 2.2: Bivariate assessments of associations between analytic variables
and loss to follow-up at any time ... 138 Appendix Section 2.3: Multivariate assessments of analytic variables associated with
study participation ... 147 Appendix Table 3.1: Descriptive statistics for participants assessed for factors associated
with a clinical diagnosis of depression (Table 4): N = 804 ... 149 Appendix Table 3.2: Regression output when assuming all participants had treatment
decisional regret at enrollment ... 151 Appendix Table 3.3: Regression output when treatment decisional regret was interacted
with prostate cancer treatment type ... 154 Appendix Table 3.4: Regression output when treatment decisional regret was interacted
with prostate cancer recurrence ... 157 Appendix Table 3.5: Regression output when depression severity was lagged by one
survey wave. ... 160 Appendix Table 3.6: Sensitivity analyses for sub-aim 1a around an alternative SF-12 MCS
threshold (i.e. ≤ 43), and alternative GEE correlation structures (i.e. exchangeable and
unstructured). N = 1,024 ... 162 Appendix Table 3.7: Factors associated with self-reported clinical diagnosis of depression
(using GEE models with exchangeable and unstructured correlation). N =804. ... 165 Appendix Section 3.1: Regression output showing Monte Carlo error estimates in the
regression model that assessed factors associated with depression (SF-12) ... 171 Appendix Section 3.2: Regression output showing Monte Carlo error estimates in the
regression model that assessed factors associated with diagnosis of depression. ... 173 Appendix Table 4.1: Baseline characteristics of participants assessed for factors
associated with depression treatment conditional on depression diagnosis (N = 132) ... 175 Appendix Table 4.2: Factors associated with self-reported depression treatment conditional
on receiving a clinical diagnosis of depression (using GEE models with exchangeable
xvii
LIST OF FIGURES
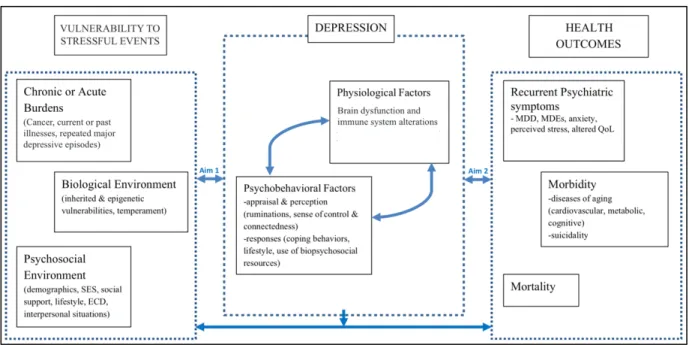
Figure 2.1: Kinser et al.’s conceptual framework of individual stress vulnerability,
depression, and health outcomes. ... 27
Figure 2.2: An adaptation of Klinkman’s competing demands in psychosocial care model. ... 28
Figure 2.3: Aim 3’s conceptual model. ... 29
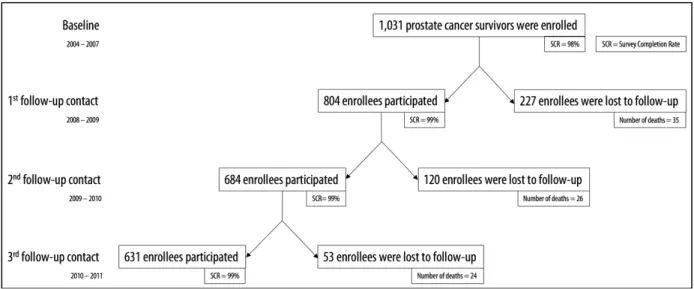
Figure 2.4: Schematic showing how study PCaP/HCaP-NC participation changed over time ... 30
Figure 3.1: Kinser et al.’s conceptual framework of individual stress vulnerability, depression, and health outcomes. ... 61
Figure 3.2: An adaptation of Klinkman’s competing demands in psychosocial care model. ... 62
Figure 3.3: A temporal trend in annual predicted prevalence of probable depression (based on SF-12 MCS) in study participants. ... 63
Figure 4.1: An adaptation of Klinkman’s competing demands in psychosocial care model ... 87
Figure 5.1: Observed and predicted SF-6D values and prediction errors ... 109
Figure 6.1: The depression treatment pathway in prostate cancer survivors ... 122
Figure 6.2: Policy alternatives for reducing the risk of depression and/or barriers to depression care in prostate cancer survivors. ... 123
Figure 6.3: An emerging construct showing plausible relationships between PCRA, depression and HRQOL ... 124
Appendix Figure 3.1: A temporal trend in annual predicted prevalence of depression by race of study participants ... 168
Appendix Figure 3.2: A temporal trend in annual predicted prevalence of depression by employment status of study participants ... 169
xviii
LIST OF ABBREVIATIONS
ARPSA Anxiety related to prostate specific antigen testing AUC Area under the curve
BDI Becks Depression Inventory
BP Bodily pain subdomain of SF–12 and SF–6D CESD Center for Epidemiologic Studies Depression scale CIDI Composite International Diagnostic Interview CSDD Cornell Scale for Depression in Dementia
DSM-5 Diagnostic and statistical manual of mental disorders, 5th edition. FR Fear of recurrence
GDS Geriatric Depression Scale GEE Generalized Estimating Equations GH General health subdomain of SF–12 GLM Generalized Linear Models
HADS Hospital Anxiety and Depression Scale
HCaP–NC Health Care Access and Prostate Cancer Treatment in North Carolina Study HDRS Hamilton Depression Rating Scale
HRQOL Health-related quality of life
ICER Incremental Cost Effectiveness Ratio LARS Least-angle regression
LASSO Least absolute shrinkage and selection operator LR+ Positive likelihood ratio
LR- Negative likelihood ratio MAE Mean absolute error
xix
MCS Mental Composite ScoreMDD Major depressive disorder MDI Major Depression Inventory MET/hr Metabolic Equivalent per hour
MH Mental health subdomain of SF–12 and SF–6D MSM Marginal Structural Model
NC ProCESS North Carolina Prostate Cancer Comparative Effectiveness & Survivorship Study OCM Oncology Care Model
PCA Prostate cancer anxiety
PCaP North Carolina-Louisiana Prostate Cancer Project PCS Prostate cancer survivors
PCRA Prostate cancer-related anxiety
PF Physical functioning subdomain of SF–12 and SF–6D PHQ 9 Patient Health Questionnaire 9
PHQ 2 Patient Health Questionnaire 2 PROMs Patient-reported outcome measures PSA Prostate Specific Antigen
QALY Quality-adjusted life year
QIC Quasilikelihood under the independent model Information Criterion
r Pearson’s rho
RE Role emotional subdomain of SF–12 and SF–6D RMSE Root mean squared error
RP Role physical subdomain of SF–12 and SF–6D SDS Zung Self-Rating Depression Scale
Sens Sensitivity
xx
SF–12 Short Form 12Spec Specificity
1
CHAPTER 1: INTRODUCTION
1.1. Specific Aims
Depression (i.e. major and persistent depressive disorders) and clinically-significant prostate cancer related anxiety (PCRA) are mental health conditions that commonly occur in prostate cancer survivors.[1-3] Both mental health conditions affect the cost and quality of prostate cancer survivorship and are cancer care priorities.[2-6] However, limited available evidence suggests that both mental health conditions are frequently undiagnosed (and untreated) in this patient population.[7] Contributory factors include patient-level factors (e.g. an unwillingness to report mental health symptoms),[8-11] provider-level factors (e.g. short consultation times and lack of awareness of PCRA),[8, 12-15] or practice-/health system-level factors (e.g. low depression screening rates [~15%] in primary care clinics).[14, 16] Prostate cancer survivors with untreated depression or PCRA face elevated risks of recurrence, greater use of healthcare resources, and low health related quality of life. [2, 3, 17-26]
There is a need to identify, implement and scale-up interventions/strategies that improve access to mental health care for prostate cancer survivors. To meet this need, we need more population-specific information about the characteristics of depression and PCRA.[27] Hence, the overarching goal of this study is to describe policy-relevant characteristics of depression and PCRA in prostate cancer survivors. The specific study aims are as follows:
Aim 1: to describe sociodemographic predictors of the occurrence and diagnosis of depression in prostate cancer survivors.
Hypotheses: Increasing age, being black, having less education, living in a rural area, being
unmarried, being unemployed and having a low income are positively associated with the
occurrence of depression, and negatively associated with clinical diagnosis of depression in
2
Aim 2: to describe sociodemographic predictors of depression treatment in prostate cancer survivors.
Hypotheses: Increasing age, being black, having less education, living in a rural area, being
unmarried, being unemployed and having a low income are negatively associated with
depression treatment.[7, 28-34]
Aim 3: to describe the relationship between PCRA and health-related quality of life.
Goals: a) to describe correlations between patient-reported PCRA measures and short form 12
(SF-12) scores; b) to measure the association between depression and PCRA; and c) to derive a
crosswalk that predicts SF-6D utilities from patient-reported PCRA measures.
For Aims 1 and 2, I will use panel data from a population-based sample of 1,031 prostate cancer
survivors who participated in the North Carolina-Louisiana Prostate Cancer Project (PCaP, 2004-2007, for baseline data) and up to three annual follow-up interviews in the Health Care Access and Prostate Cancer Treatment in North Carolina Study (HCaP-NC, 2008-2011). For Aim 3, I will use cross-sectional data from the 12th month of follow-up in the North Carolina Prostate Cancer Comparative Effectiveness
& Survivorship Study (NC ProCESS: N = 1,024).[38] 1.2. Significance
This study is significant because it will achieve the following:
3
2. Motivate more conversations about improving access to mental health care for prostate cancer survivors. Before cancer diagnosis, prostate cancer survivors experienced depression at the same rate as the general adult population (i.e. about 6%). After cancer diagnosis, the risk of depression increases up to four fold.[41] There are 3 million prostate cancer survivors in the US.[42] However, little is known about a) the number of depressed survivors; and b) the
sociodemographic profile of survivors who have undiagnosed depression or diagnosed but untreated depression. These gaps in the literature will be addressed in Aims 1b and 2a. Such information is expected to be important to policymakers and providers who are concerned with improving access to mental health care for prostate cancer survivors.
3. Inform and motivate future studies that explore disparities in access to mental health care among
prostate cancer survivors. Some studies have shown that there are sociodemographic differences and disparities in the diagnosis and treatment of depression in other patient populations.[7, 29, 31, 43] However, little is known about whether these disparities extend to prostate cancer survivors. Demonstrating sociodemographic differences in depression diagnosis and treatment in this patient population (sub-aim 1b and Aim 2) will inform and motivate future studies exploring mental health disparities among prostate cancer survivors.[44]
4
5. Facilitate economic evaluations of PCRA care strategies: clinical trials evaluating current or novel PCRA care strategies may have data on costs and patient-reported PCRA measures, but may lack data on utilities.[47, 48] Utilities are preference-based health-related quality of life measures used to calculate incremental cost-effectiveness ratios (ICERs) in cost-utility analyses. ICERs serve two principal functions: facilitating cost-effectiveness inferences; and comparing efficiencies of two or more healthcare interventions. Without utilities, it would be difficult to identify PCRA interventions that represent the best use of available resources.[39] The crosswalk from Aim 3 will facilitate conversion of patient-reported PCRA measures into SF-6D utilities for subsequent cost-utility analyses.[49-53]
6. Provide greater clarity on the association between PCRA and health related quality of life: To date, four studies have assessed the relationship between patient-reported PCRA and health-related quality of life measures in prostate cancer survivors. So far, reported findings are ambiguous – evidence from two studies suggests an inverse relationship, while evidence from two other studies suggests no relationship.[2, 54-56] Findings from Aim 3 will provide more clarity on this relationship by demonstrating correlations between patient-reported PCRA and HRQOL measures, and indicating which PCRA exerts the most effect on HRQOL.
7. Provide more clinical information about PCRA: PCRA is a feeling of worry specifically due to having a prostate cancer diagnosis.[2, 3, 57] It was first described by Roth et al. in 2003, and has been shown to be distinct from other types of anxiety.[3] PCRA is measured with the Memorial Anxiety Scale for Prostate Cancer (MAX-PC).[2, 3, 57] MAX-PC scores range from 0 – 54, and higher scores indicate more severe disease. PCRA’s severity varies from mild unease to disabling functional impairment that requires hospitalization.[2, 3, 57] However, not much is known about PCRA. For example, there is a lack of clarity about PCRA’s DSM-5 (Diagnostic and statistical manual of mental disorders, 5th edition) classification as it could fit into one of the following:
5
scores ≤ 27 tend to have low-to-moderate levels of anxiety: these survivors are encouraged to maintain a sense of control over their daily lives, and to rely on support provided by their social networks and the medical community.[58] Survivors with MAX–PC scores > 27 tend to have high levels of anxiety (clinically significant PCRA), and may require one or more mental health interventions.[2] Clinically-significant PCRA affects 1 in 10 prostate cancers survivors and commonly co-occurs with neuroticism and generalized anxiety disorder. [2, 3, 57, 59, 60] However, little is known about its co-occurrence with depression. This information is important because depression may alter PCRA treatment plans. Demonstrating a significantly higher risk of depression in patients with clinically-significant PCRA may motivate recommendations for depression screening in indicated patients.
1.3. Innovation
This study is innovative because:
1. It is the first study to examine factors associated with the occurrence and diagnosis of depression in prostate cancer survivors. In the past two decades, several researchers have described
sociodemographic factors associated with depression diagnoses in various patient population. These studies (20) are summarized in the Appendix. However, only two studies focused on US cancer survivors, and the researchers examined survivors with gynecological and colorectal cancer. Little is known about sociodemographic characteristics associated with the occurrence and diagnosis of depression in prostate cancer survivors, and this will be the first study to examine them.
2. The PCaP/HCaP-NC dataset includes a larger number of African Americans than many other prostate cancer datasets/registries.[61] Its population-based design and over-sampling of African Americans will allow evaluation of individuals in a demographic known to have limited access to care and often under-represented in clinic/hospital-based sample groups.
6
the patient outcomes most relevant to stakeholders (including patient reported outcomes, cancer control and survival).[38] These qualities make the dataset a prime resource.[38]
4. This study will be the first to achieve the following: to map a mental health patient-reported outcome measure to SF-6D; to explore the relationship between SF-12’s and MAX-PC’s subscales; and to describe the association between PCRA and depression.
1.4. Guide to Dissertation
7
REFERENCES1. Vilagut, G., et al., The mental component of the short-form 12 health survey (SF-12) as a measure of depressive disorders in the general population: results with three alternative scoring methods.
Value in Health, 2013. 16(4): p. 564-573.
2. Roth, A., et al., Assessing anxiety in men with prostate cancer: further data on the reliability and validity of the Memorial Anxiety Scale for Prostate Cancer (MAX–PC). Psychosomatics, 2006. 47(4): p. 340-347.
3. Roth, A.J., et al., The memorial anxiety scale for prostate cancer: validation of a new scale to measure anxiety in men with with prostate cancer. Cancer, 2003. 97(11): p. 2910-8.
4. Satin, J.R., W. Linden, and M.J. Phillips, Depression as a predictor of disease progression and mortality in cancer patients. Cancer, 2009. 115(22): p. 5349-5361.
5. Strong, V., et al., Management of depression for people with cancer (SMaRT oncology 1): a randomised trial. The Lancet, 2008. 372(9632): p. 40-48.
6. Latini, D.M., et al., The relationship between anxiety and time to treatment for patients with prostate cancer on surveillance. The Journal of urology, 2007. 178(3): p. 826-832.
7. Ell, K., et al., Depression, correlates of depression, and receipt of depression care among low-income women with breast or gynecologic cancer. J Clin Oncol, 2005. 23(13): p. 3052-60. 8. Mitchell, A.J., A. Vahabzadeh, and K. Magruder, Screening for distress and depression in cancer
settings: 10 lessons from 40 years of primary‐care research. Psycho‐Oncology, 2011. 20(6): p. 572-584.
9. Cochran, S.V. and F.E. Rabinowitz, Men and depression: Clinical and empirical perspectives. 1999: Elsevier.
10. Real, T., I don't want to talk about it: Overcoming the secret legacy of male depression. 1998: Simon and Schuster.
11. Addis, M.E. and J.R. Mahalik, Men, masculinity, and the contexts of help seeking. American psychologist, 2003. 58(1): p. 5.
12. Klabunde, C.N., et al., The role of primary care physicians in cancer care. Journal of general internal medicine, 2009. 24(9): p. 1029-1036.
13. Cepoiu, M., et al., Recognition of depression by non-psychiatric physicians—a systematic literature review and meta-analysis. Journal of general internal medicine, 2008. 23(1): p. 25-36.
14. Maimone, R.M. and A. Marhatta, The Rate of Depression Screening at a Federally Qualified Community Health Center. Health Services Research and Managerial Epidemiology, 2015. 2: p. 2333392815613057.
8
16. Greenberg, D.B. Impediments in the Management of Depression and Suggestions for Solutions. in
NIH State-of-the-Science Conference on Symptom Management in Cancer: Pain, Depression, and Fatigue. 2002.
17. Blier, P., et al., Preventing recurrent depression: long-term treatment for major depressive disorder. The Journal of clinical psychiatry, 2007. 68(3): p. e06-e06.
18. Kilpatrick, D.G., et al., Violence and risk of PTSD, major depression, substance abuse/dependence, and comorbidity: results from the National Survey of Adolescents. Journal of consulting and clinical psychology, 2003. 71(4): p. 692.
19. Grant, B.F., Comorbidity between DSM-IV drug use disorders and major depression: results of a national survey of adults. Journal of substance abuse, 1995. 7(4): p. 481-497.
20. Saravay, S.M., Psychiatric comorbidity and length of stay in the general hospital: a critical review of outcome studies. Psychosomatics, 1994. 35(3): p. 233-252.
21. Hosaka, T., et al., Comorbidity of depression among physically ill patients and its effect on the length of hospital stay. Psychiatry and clinical neurosciences, 1999. 53(4): p. 491-495.
22. Luppa, M., et al., Healthcare costs associated with recognized and unrecognized depression in old age. International Psychogeriatrics, 2008. 20(06): p. 1219-1229.
23. Greenberg, P.E., et al., The economic burden of adults with major depressive disorder in the United States (2005 and 2010). The Journal of clinical psychiatry, 2015. 76(2): p. 155-162.
24. Ruo, B., et al., Depressive symptoms and health-related quality of life: the Heart and Soul Study.
Jama, 2003. 290(2): p. 215-221.
25. Klaassen, Z., et al., Decreasing suicide risk among patients with prostate cancer: Implications for depression, erectile dysfunction, and suicidal ideation screening. Urol Oncol, 2018. 36(2): p. 60-66.
26. Llorente, M.D., et al., Prostate cancer: a significant risk factor for late-life suicide. The American Journal of Geriatric Psychiatry, 2005. 13(3): p. 195-201.
27. McDonald, M.V., et al. Nurses' recognition of depression in their patients with cancer. in Oncology nursing forum. 1999.
28. Hudson, D.L., et al., Differences in the clinical recognition of depression in diabetes patients: The Diabetes Study of Northern California (DISTANCE). The American journal of managed care, 2013. 19(5): p. 344.
29. Zhang, A.Y. and G.S. Cooper, Recognition of depression and anxiety among elderly colorectal cancer patients. Nursing research and practice, 2010. 2010.
30. Rifel, J., et al., Impact of demographic factors on recognition of persons with depression and anxiety in primary care in Slovenia. BMC psychiatry, 2008. 8(1): p. 96.
9
32. Amin, A.A., et al., The prevalence of unrecognized depression in patients with acute coronary syndrome. American heart journal, 2006. 152(5): p. 928-934.
33. Gallo, J.J., et al., Patient ethnicity and the identification and active management of depression in late life. Archives of internal medicine, 2005. 165(17): p. 1962-1968.
34. Kessler, R.C., et al., Prevalence, correlates, and course of minor depression and major depression in the National Comorbidity Survey. Journal of affective disorders, 1997. 45(1): p. 19-30.
35. Alwhaibi, M., et al., Depression treatment among elderly Medicare beneficiaries with incident cases of cancer and newly diagnosed depression. Psychiatric Services, 2017. 68(5): p. 482-489. 36. Findley, P.A., C. Shen, and U. Sambamoorthi, Depression treatment patterns among elderly with
cancer. Depression research and treatment, 2012. 2012.
37. Rane, P.B., U. Sambamoorthi, and S. Madhavan, Depression treatment in individuals with cancer: a comparative analysis with cardio-metabolic conditions. Health psychology research, 2013. 1(1). 38. Chen, R.C., et al., Design of the North Carolina Prostate Cancer Comparative Effectiveness and
Survivorship Study (NC ProCESS). 2015.
39. Neumann, P.J. and G.D. Sanders, Cost-effectiveness analysis 2.0. N Engl J Med, 2017. 376(3): p. 203-205.
40. Goldie, S.J., J.D. Goldhaber-Fiebert, and G.P. Garnett, Public health policy for cervical cancer prevention: the role of decision science, economic evaluation, and mathematical modeling.
Vaccine, 2006. 24: p. S155-S163.
41. Watts, S., et al., Depression and anxiety in prostate cancer: a systematic review and meta-analysis of prevalence rates. BMJ open, 2014. 4(3): p. e003901.
42. Key Statistics for Prostate Cancer by the American Cancer Society. Available at https://www.cancer.org/cancer/prostate-cancer/about/key-statistics.html. .
43. Alegría, M., et al., Disparity in depression treatment among racial and ethnic minority populations in the United States. Psychiatric services, 2008. 59(11): p. 1264-1272.
44. McGuire, T.G. and J. Miranda, New evidence regarding racial and ethnic disparities in mental health: Policy implications. Health Affairs, 2008. 27(2): p. 393-403.
45. Bilimoria, K.Y., et al., Wait times for cancer surgery in the United States: trends and predictors of delays. Annals of surgery, 2011. 253(4): p. 779-785.
46. Oncology care model by the Centers for Medicare Medicaid Services. Baltimore, MD, Centers for Medicare and Medicaid Services, 2016.
47. Carreon, L.Y., et al., Predicting SF-6D utility scores from the neck disability index and numeric rating scales for neck and arm pain. Spine, 2011. 36(6): p. 490.
10
49. Brazier, J.E. and J. Roberts, The estimation of a preference-based measure of health from the SF-12. Medical care, 2004. 42(9): p. 851-859.
50. Kharroubi, S.A., et al., Modelling SF-6D health state preference data using a nonparametric Bayesian method. Journal of health economics, 2007. 26(3): p. 597-612.
51. McCabe, C., et al., Using rank data to estimate health state utility models. Journal of health economics, 2006. 25(3): p. 418-431.
52. van Stel, H.F. and E. Buskens, Comparison of the SF-6D and the EQ-5D in patients with coronary heart disease. Health and Quality of Life Outcomes, 2006. 4(1): p. 20.
53. Hanmer, J., Predicting an 6D preference-based score using MCS and PCS scores from the SF-12 or SF-36. Value in Health, 2009. 12(6): p. 958-966.
54. van den Bergh, R.C., et al., Prostate cancer-specific anxiety in Dutch patients on active surveillance: validation of the memorial anxiety scale for prostate cancer. Quality of Life Research, 2009. 18(8): p. 1061-1066.
55. Victorson, D.E., et al., Factors Affecting Quality of Life at Different Intervals After Treatment of Localized Prostate Cancer: Unique Influence of Treatment Decision Making Satisfaction, Personality and Sexual Functioning. J Urol, 2016. 196(5): p. 1422-1428.
56. Pearce, S.M., et al., A Longitudinal Study of Predictors of Sexual Dysfunction in Men on Active Surveillance for Prostate Cancer. Sex Med, 2015. 3(3): p. 156-64.
57. Nelson, C.J., et al., Assessing anxiety in Black men with prostate cancer: further data on the reliability and validity of the Memorial Anxiety Scale for Prostate Cancer (MAX-PC). Support Care Cancer, 2016. 24(7): p. 2905-11.
58. Mader, E.M., et al., Qualitative insights into how men with low-risk prostate cancer choosing active surveillance negotiate stress and uncertainty. BMC urology, 2017. 17(1): p. 35.
59. van den Bergh, R.C., et al., Do anxiety and distress increase during active surveillance for low risk prostate cancer? The Journal of urology, 2010. 183(5): p. 1786-1791.
60. van den Bergh, R.C., et al., Anxiety and distress during active surveillance for early prostate cancer. Cancer, 2009. 115(17): p. 3868-3878.
11
CHAPTER 2: STUDY DESIGN AND ANALYTIC METHODS
2.1. Introduction
This chapter provides details about the study design and analytic methods used in this
dissertation. The overarching goal of this study is to describe policy-relevant characteristics of depression and prostate cancer-related anxiety (PCRA) in prostate cancer survivors. In Aims 1 & 2, I assessed sociodemographic predictors of the occurrence, diagnosis and treatment of depression in prostate cancer survivors. I carried out this assessment by conducting several retrospective analyses of longitudinal data that was collected from North Carolinian prostate cancer survivors over a 7-year period (2004 – 2011). In Aim 3, I assessed the relationship between patient-reported measures of PCRA and health-related quality of life (HRQOL). I carried out this latter assessment by conducting several retrospective analyses on cross-sectional data from another group of North Carolinian prostate cancer survivors over a two-year period (2012 – 2013).
2.2. Conceptual Models for Aims 1 & 2
12
of the psychosocial environment that plays a key role in one’s vulnerability to stressful events. In sub-aim 1a, I assessed sociodemographic factors associated with depression in prostate cancer survivors (see psychosocial environment: Figure 2.1). The underlying hypotheses were that increasing age, being black, having less education, living in a rural area, being unmarried, being unemployed/retired and having a low income are positively associated with depression.[2, 3] These hypotheses are motivated by findings in other patient populations.[2] I used data from a randomly-selected population-based sample of prostate cancer survivors, and controlled for some components of the psychosocial environment (e.g. social support and lifestyle) as well as chronic or acute burdens (e.g. comorbidities and treatment decisional regret).
In sub-aim 1b, I used Klinkman’s competing demands in psychosocial care model (Figure 2.2).[4] The author suggests that patient and clinician attributes affects who gets depression diagnosis. Patient attributes include sociodemographic factors (e.g. age and race), clinical factors (e.g. severity of depression) and health status factors (e.g. health insurance coverage). Clinician attributes include knowledge/expertise, beliefs/attitudes, type of patient encounter, practice policies, and
alternative/competing demands. The underlying hypotheses were that increasing age, being black, having less education, living in a rural area, being unmarried, being unemployed/retired and having a low income were negatively associated with depression diagnosis.[2] As currently available evidence suggests that clinician factors do not predict who gets depression diagnosis (or treatment), clinician-factors were not assessed.[5]
13
2.3. Data Source for Aims 1 & 2:I used data for 1,031 North Carolinian men diagnosed with prostate cancer from the North Carolina-Louisiana Prostate Cancer Project (PCaP). PCaP is a multidisciplinary study of social, individual, and tumor-level causes of racial differences in prostate cancer aggressiveness.[6] Participants were a population-based sample of incident prostate cancer cases from North Carolina and Louisiana that were diagnosed on or after July 1, 2004. Participants were identified using state tumor registries. North Carolinian participants were contacted between September 2004 and December 2007, to obtain
questionnaire data, biological specimens, and permission to obtain medical records. Only black and white survivors were enrolled in the study, and blacks were oversampled (0.44:1). North Carolinian participants had up to three annual follow-up interviews in the Health Care Access and Prostate Cancer Treatment in North Carolina Study (HCaP-NC, 2008-2011). Interview questionnaires were completed by regular mail or by phone interview for the first contact (between Sept. 2008 – Aug. 2009), second contact (Sept. 2009 – Aug. 2010) and third contact (Sept. 2010 – Aug. 2011). Louisiana participants were not included because collection of follow-up data was affected by hurricane Katrina.
2.4. Analyses overview for Aims 1 & 2
I assessed sociodemographic predictors of the occurrence, diagnosis and treatment of depression by analyzing PCaP/HCaP-NC data with generalized estimating equations (GEE) models. I used GEE models because the outcomes of interest are correlated.[7]
2.5. Identifying the occurrence of depression (sub-aim 1)
14
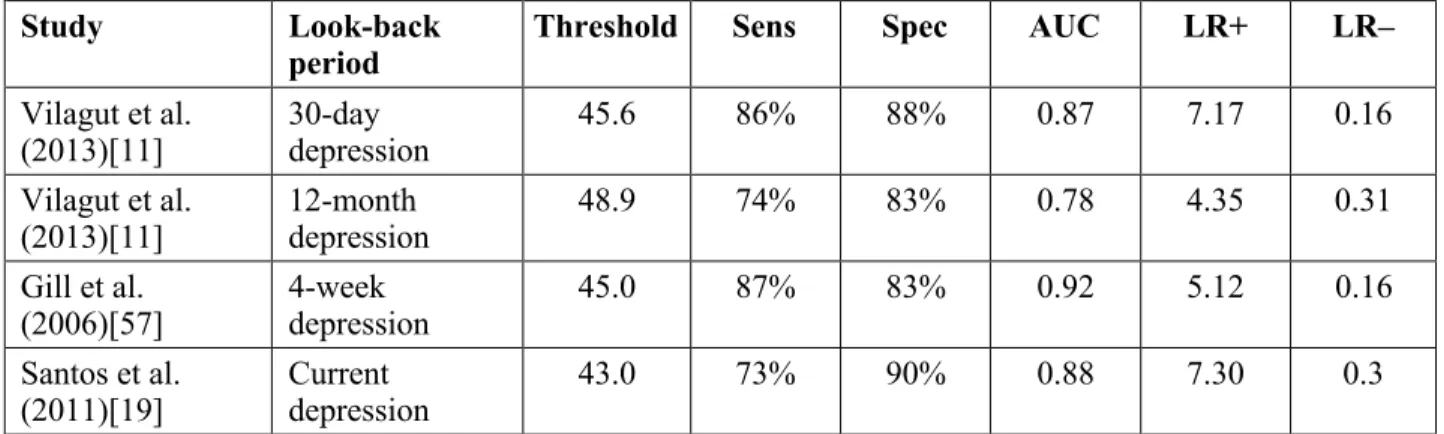
into mental aspects of health-related quality of life). This suggestion is motivated by the widespread use of the SF-12 instrument in population research, the high negative correlation between SF-12 MCS and severity of major depression, and SF-12 items that refer to symptoms related to diagnostic criteria for depression.[8-11] Some suggested SF–12 MCS threshold scores for identifying depression are presented in Table 2.1. In sub–aim 1a, I used a threshold score of 48.9 (proposed by Vilagut et al. [2013][11]) because of its 1-year look back period (see Table 2.1): this look back period is well aligned with the HCaP–NC follow-up cycles. [12] With this threshold score, I created a binary indicator of probable depression based on SF-12 MCS (i.e. depression_SF_12it]) that indicates whether a participant was depressed within 12 months prior to survey contact.
2.6. Identifying clinical diagnoses of depression (sub-Aim 1b & Aim 2)
At enrollment, PCaP/HCaP NC participants had an opportunity to self-report prior clinical diagnoses of depression. During follow-up survey interviews, participants were asked the following question: “Has a doctor or health professional ever told you that you have or had depression or anxiety?” I used participants’ responses to create 1) a time-varying binary indicator of prior clinical diagnosis of depression prior to enrollment or in prior survey waves (i.e. Dx_Dep_Everit), and 2) a time-invariant
binary indicator of having ever received a clinical diagnosis of depression prior to enrollment or during the study (Dx_Dep_Everi).
2.7. Identifying depression treatment (Aim 2)
During enrollment, participants self-reported (and sometimes demonstrated) antidepressant use within the prior two weeks.[6] During follow-up, participants were asked if they were receiving antidepressants, or if they had had psychotherapy since the prior survey contact (the reason for psychotherapy was not specified). I used participants’ responses to create two binary outcome variable that indicates receipt of depression treatment prior to survey contact (i.e. Rx_depit).
2.8. Sub-Aim 1a: factors associated with the occurrence of depression
15
colleagues conceptual model [Figure 2.1]), and included age at enrollment, race (black or white), educational attainment (up to high school or beyond high school), rural or urban residence (using the 2010 US Census classification),[13] current marital status (currently married vs. previously/never married), current employment status (employed vs. not employed [i.e. retired or unemployed]) and current annual income (>$70,000, $40,001 – $70,000, $20,000 – $40,000 or <$20,000). Control covariates included clinical factors (e.g. prostate cancer stage at diagnosis [T1 vs. T2/T3: more details below],[14] a history of depression [prior to enrollment as well as between enrollment and the
penultimate survey wave]),[11] health status factors (e.g. time [in years] since prostate cancer diagnosis, Charlson comorbidity index (0 – 1 vs ≥ 2),[15] availability of social/emotional support and treatment decisional regret),[16] and lifestyle factors (e.g. current tobacco use, current alcohol use and adherence to physical activity recommendations [i.e. at least 600 metabolic equivalent-minute per week).[17] More details are provided in Table 2.2.
I evaluated the association between the dependent and explanatory variables using a GEEmodel with a binomial family, a logit link, and an independent auto correlation structure (had the least Quasi-likelihood under the independent model Information Criterion). The model is specified in the function below:
depression_SF_12it = f(SocDemi, SocDemit, depression_B4_PCaPi, depression_IN_PCaPit-1, Yearsit,
Stagei, HSVit)…(Sub-Aim 1a)
16
represents health status variables which include Charlson comorbidity index, smoking status, drinking status, adherence to exercise recommendations, availability of social/emotional support and treatment decisional regret. I generated predicted probabilities (using the method of recycled predictions) that characterize the average prevalence of depression during the study.
2.9. Sub-Aim 1b: factors associated with depression diagnosis
In this analysis, the outcome variable was Dx_Dep_Everit. Key explanatory variables were age at enrollment, race, educational attainment, residence, marital status, employment
status and income. Control covariates were clinical and health status factors. Clinical factors included cancer stage at diagnosis and indication of depression severity in the prior 12 months using SF-12 MCS (i.e. < 32.8 for moderate or severe depression, between 32.9 – 43 for mild depression, between 43 – 48.9 for plausible subthreshold depression, and > 48.9 for no depression).[11, 18, 19]. Health status factors included time since prostate cancer diagnosis, and indicators of Charlson comorbidity indices, health insurance coverage (insured vs. uninsured), and annual visits to primary care clinics (≤ 3 vs 3 or more per year). More details are provided in Table 2.2. I evaluated the association between the dependent and explanatory variables using a GEE model. The model is specified in the function below:
Dx_Dep_Everit = f(SocDemi,SocDemit, Severityit, Yearsit, Stagei, HSVit) … (Sub-Aim 1b)
17
2.10. Aim 2: sociodemographic factors associated with depression treatment
My approach was to a) identify baseline sociodemographic characteristics that predicted reportedly ever receiving a clinical diagnosis of depression, and b) identify sociodemographic
characteristics that were associated with depression treatment conditional on receiving a clinical diagnosis of depression.To identify baseline predictors of clinical diagnosis of depression, I used a logistic
regression model to assess the relationship between reportedly having ever received a clinical diagnosis of depression (a binary time-invariant variable) and participants baseline characteristics. The outcome variable was Dx_Dep_Everi. Explanatory variables included sociodemographic, clinical and health status characteristics listed above (sub-aim 1b). The model is specified below:
Dx_Dep_Everi = f(SocDemi, Severityi, Yearsi, Stagei, HSVi) … (Aim 2, stage 1)
Model notations have been previously described. To identify sociodemographic predictors of depression treatment conditional on depression diagnosis, I limited the data to a subsample of participants that reportedly received a clinical diagnosis of depression during follow-up. I then modelled probable depression based on SF-12 MCS treatment (Rx_depit) as a function of sociodemographic, clinical and health status characteristics using a GEE model and the panel dataset. The model is specified below:
Rx_depit = f(SocDemi,SocDemit, Severityit, Yearsit, Stagei, HSVit) … (Aim 2, stage 2)
Model notations have been previously described. I used observations from the first follow-up period that participants reported a prior clinical diagnosis of depression. I also used the model to estimate the rate of probable depression based on SF-12 MCS treatment in the sample.
2.11. The PCaP/HCaP-NC dataset: Missing observations and impact on analytic methods
Dropouts from the PCaP/HCaP-NC study
18
22% of participants at baseline] were lost by the first follow-up contact, 120 [or 15% of those that participated in the first follow-up survey] were lost by the second follow-up contact, and 53 [or 8% of those that participated in the second follow-up survey] were lost by the third follow-up contact). Some participants who were lost to follow-up died (85 total). For those who participated in each study wave, the survey completion rates (with respect to analytic variables) were over 95% on average. Variables most affected by item non-response in all waves include current tobacco use (49%), income (31%) and SF-12 MCS (14% [the denominator for the percentages in parentheses is the total number of missing
observations specifically due to item non-response]).
Assessing factors associated with dropout from PCaP/HCaP–NC
Factors associated with dropouts from the study were assessed in two ways. First, I conducted Little’s missing completely at random (MCAR) test on the analytic variables in Aims 1 & 2, and I obtained a p-value < 0.001.[22] This p-value suggests that the mechanism of missingness is not MCAR. [22] Second, I used logistic regression to assess the relationship between participation in a study wave or not (the dependent variable) and analytic variables in Aims 1 and 2 (right hand side variables). Results are presented in the Appendix. Controlling for other variables in the model, none of the right-hand side variables predicted study participation. This finding supports the assumption that the mechanism of missingness is missing at random conditional on observed variables.
Approach to dealing with missing data for Aims 1 & 2
I chose to use multiple imputation (specifically multiple imputation by chained equations – MICE) to deal with survey non-response in Aim 1. The intuition behind MICE is that it uses each variable with missing observation as the outcome variable in a regression model that has some or all other
19
decisional regret) and multinomial logit (employment status) regression models. I created 50 imputed datasets (to minimize Monte Carlo sampling error) and conducted the analyses using Stata® 13.[25-27] I examined robustness by comparing imputed models to listwise deleted models.
2.12. Overview of Aim 3 (a different health condition and a different dataset)
The next section (Aim 3) focuses on prostate cancer related anxiety (PCRA) and uses a different dataset (NC ProCESS). The goal of Aim 3 is to evaluate the relationship between prostate cancer-related anxiety and health-related quality of life in prostate cancer survivors. This goal was pursued in three ways: by estimating correlations between patient-reported measures of PCRA and HRQOL; by measuring the association between PCRA and depression; and by creating a crosswalk that predicts SF-6D utilities from MAX–PC scores.
2.13. Conceptual model for Aim 3
The conceptual framework is presented in Figure 2.3. The arrow between MAX-PC and SF-6D represents a negative relationship between both variables.[28-30] The conceptual framework also shows plausible moderators (including age and marital status) and confounders (mainly clinical characteristics) identified in the literature (see Appendix for more details).
2.14. Data source for Aim 3:
20
2.15. Analyses overview for Aim 3In sub-aim 3a, I estimated correlations between MAX–PC and SF–12 composite scores using data from NC ProCESS. In sub-aim 3b, I measured the association between PCRA and depression using modified Poisson (Poisson regression with a robust error variance) and logistic regression models. Lastly, in sub-aim 3c, I used NC ProCESS data to create a crosswalk that predicts SF-6D utilities from MAX-PC scores and other individual-level characteristics of study participants.
2.16. Key measures in Aim 3
Memorial Anxiety Scale for Prostate Cancer (MAX-PC)
MAX–PC is an 18 item questionnaire specifically for PCRA.[28, 32] MAX–PC has three subscales for indicated PCRA subdomains: prostate cancer anxiety, anxiety due to prostate specific antigen level (or PSA anxiety), and fear of recurrence (FR). Each MAX-PC item has four possible responses on a Likert scale, and all responses are scored on an ordinal scale: from 0 – 3, where higher scores indicate worse health.[28, 32] Note that MAX-PC items 15-18 have responses in the reverse (higher score indicates better health), so I reversed the scoring for these items to be consistent with the rest of the instrument. Total MAX-PC scores range from 0 – 54, and survivors with scores over 27 have clinically significant PCRA. [28, 32, 33]
SF-12
12 is a validated 12-item self-reported questionnaire that measures generic HRQOL.[34] SF-12 is a shortened version of SF-36, and it has 8 subscales –general health (GH), bodily pain (BP), mental health (MH), physical functioning (PF), social functioning (SF), role physical (RP), role emotional (RE)
21
SF-6D
SF-6D is a preference-based scoring system that is frequently used to convert SF-36 and SF-12 scores into a single summary score that preserves the descriptive richness and sensitivity to change of the original instruments.[37-39] SF-6D scores are generic index measures of health that describe 18,000 health states, and come with a set of preference weights obtained from a sample of the general US population using standard gamble.[37-39] The scores vary from 0 – 1 and can be used as utilities to generate quality adjusted life-years estimates (QALYs) in cost-utility analysis.[35, 37-40] A proprietary algorithm (developed by researchers at the University of Sheffield’s Health Economics and Decision Science group) is available online and commonly used to convert SF-12 to SF-6D.[41-45] The algorithm works by applying a set of preference weights to SF-12 responses. In generating the preference weights, the authors asked a sample of the general US population to value a selection of health states using standard gamble.[41-45] A regression model was then applied to the valuation data and used to predict SF-6D’s 18,000 health states, and to generate the aforementioned preference weights. [41-45] I obtained the algorithm with a non-commercial use license from the authors. I used this algorithm to convert SF-12 survey responses obtained during the 12th of follow-up into SF-6D utilities.
2.17. Identifying the occurrence of depression for Aim 3
Just like in sub-aim 1a, I used an SF 12–MCS threshold score to identify NC ProCESS
participants that were depressed during survey contact. Santos et al. [2011] studied SF-12 MCS in adults were recently diagnosed with depression, and suggested a threshold score of 43 (sensitivity = 73% and specificity = 90%: see Table 2.1) for identify those experiencing depression in population studies. [19] I used this threshold score to create a binary indicator of depression during survey contact.
It is worth mentioning that this threshold, and the SF-12 MCS threshold in Aim 1a (i.e. 48.9) are doing the same thing (i.e. identifying adults with probable depression in a population study). The
22
experiencing a relapse, and those who have recovered. The lower threshold score (i.e. 43) identifies adults who are probably currently experiencing depression (mild, moderate or severe). It is 73% sensitive and 90% specific for depression. It does not identify adults who are in remission, or who have recovered, or who are about to have a relapse. I chose the lower threshold score because I needed to measure the associations between contemporaneous indicators of clinically-significant PCRA and probable depression (based on SF-12 MCS).
2.18. Identifying the occurrence of clinically significant PCRA for Aim 3
Authors of the scale suggest that MAX-PC total scores above 27 indicate clinically-significant PCRA, and that affected patients should get urgent mental health care. I used this suggested threshold score to create a binary indicator of clinically significant PCRA (set to 1 if MAX-PC > 27; 0 otherwise). 2.19. Sub-Aim 3a: correlations between MAX-PC and SF-12 scores
Hypotheses: these are summarized in Table 2.3. I expected the fear of recurrence subdomain to drive the most changes in SF-12 composite scores because it has been shown to have the strongest correlation with SF-12 MCS relative to other PCRA subdomains. [29] Similarly, I expected the PSA anxiety subdomain to drive the least changes in SF-12 composite scores (see Table 2.3).[29]
Analyses: I evaluated the correlations between MAX–PC's and SF–12's subscale scores by calculating their respective Pearson's correlation coefficient (rho). The strength of correlation coefficients (rho) were described as follows: excellent (0.81– 1.0); very good (0.61 – 0.80); good (0.41 – 0.60); fair (0.21 – 0.40); and poor (≤ 0.2).[46] Correlations that are at least good support convergent validity, while those that are fair or worse support discriminant validity.[46, 47]
2.20. Sub-Aim 3b: to measure the association between PCRA and depression.
Hypothesis: clinically-significant PCRA is significantly associated with depression.
23
weighed logistic regression model (to generate odds ratios) and a propensity score weighed modified Poisson regression model (to generate relative risks). These propensity scores represent the propensity for clinically significant PCRA and were predicted from a logit regression model that had the binary indicator of clinically significant PCRA as the dependent variable, and clinical/sociodemographic variables
presented in Figure 2.3 as right-hand side variables. These variables were identified after an extensive review of the literature (the results of which are summarized in the Appendix).
2.21. Sub-aim 3c: an algorithm that predicts SF-6D utilities from MAX-PC scores.
I split data from the 12th month of follow-up into two random halves. One half served as the
estimation dataset (for generating the algorithm), while the other half served as the validation dataset (for testing the algorithm). I then applied a linear regression model on the estimation dataset. The linear model was based on the conceptual framework in Figure 2.3 and on other findings in the literature (see
Appendix). The model had SF-6D as the dependent variable and MAX-PC subdomain scores as key explanatory variables (they are expected to have greater predictive accuracy than MAX–PC total scores).[48-50] The fully specified linear model is specified below:
SF-6Di = MAX-PCi + SocDemi + ClinVari ………. (Aim 3a)
24
a. The manual approach involves conducting bivariate screenings between SF-6D and each right-hand side variable. The objective is to present a final model that contains only significant predictors (including those that are collinear).
b. Automated approaches used include the following:
I. Least absolute shrinkage and selection operator (LASSO): this is a regularization procedure that shrinks regression coefficients toward zero, and in its basic form is equivalent to maximum penalized likelihood estimation with a penalty function that is proportional to the sum of the absolute values of the regression coefficients.[51, 52] II. Least-angle regression (LARS): this starts by picking the right-hand side variable most
correlated with SF-6D but adding it to the model only to the extent that it has greater correlation than the others. Least squares are then minimized until another left-hand side variable is as correlated.[51, 53]
III. Forward selection: this begins with no variables selected (the null model), and then adds the most significant yet-to-be included variable. Variables with p-value > 0.5 were not be included.[51]
IV. Backward selection: this seems to be the most commonly used technique in the medical literature.[48-50, 54] This method begins with all right-hand side variables (with and without variable interactions) in the model, then iteratively excludes the least significant variable. Variables with p-value ≤ 0.1 are retained in the model.[51]
V. Stepwise selection: alternates between forward and backward selection until a stable set of variables is attained.[51]
25
Each of the outlined model selection techniques yielded a final model. I assessed the prediction accuracy of all final models using the following data:
• the mean absolute error (MAE), [48-50, 54] • the root mean squared error (RMSE), [48-50, 54] • R-squared and adjusted r-squared, [48-50, 54]
• the percentage of predictions within ±5% and ±10% of estimated SF-6D values, [48-50, 54] • A plot of “observed” SF-6D values against predicted SF-6D and the residuals of these predictions
(this displayed the pattern of errors across the SF-6D scale).[49, 50]
• The mean and range of predicted SF-6D scores were be compared with the mean and range of “observed” SF-6D scores.[48-50, 54] This provided insight into the extent to which the model may be affected by poor fit at the extremes of the distribution, systematic error patterns, and compression of range.[50, 56]
The best-fitting parsimonious model (or crosswalk) had the smallest MAE and RMSE.[48-50, 54] I then tested the crosswalk’s performance on the validation dataset and assessed its prediction accuracy using the steps outlined above.
2.22. Potential limitations:
1. Using SF-12 MCS to identify participants with depression in the prior 12 months exploits a high correlation between SF-12 MCS measured at a single point in time and receiving a clinical diagnosis of depression within the 12 months preceding measurement of SF-12 MCS. As such, SF-12 MCS is not diagnostic (hence the term “probable depression”).
26
expected to be uncorrelated with any variable in the model - resulting in larger standard errors (or type 2 error) rather than biased estimates.
3. No PCaP/HCaP-NC participant had end-stage prostate cancer at enrollment. Hence, study findings may not extend to this group of patients.
27
Figure 2.1: Kinser et al.’s conceptual framework of individual stress vulnerability, depression, and health outcomes.
28
29
Figure 2.3: Aim 3’s conceptual model.30
Figure 2.4: Schematic showing how study PCaP/HCaP-NC participation changed over time
31
Table 2.1: Suggested threshold SF-12 mental composite scores for identifying individuals with presumed depression in population studies.
Study Look-back
period
Threshold Sens Spec AUC LR+ LR–
Vilagut et al.
(2013)[11] 30-day depression 45.6 86% 88% 0.87 7.17 0.16
Vilagut et al. (2013)[11]
12-month depression
48.9 74% 83% 0.78 4.35 0.31
Gill et al. (2006)[57]
4-week depression
45.0 87% 83% 0.92 5.12 0.16
Santos et al.
(2011)[19] Current depression 43.0 73% 90% 0.88 7.30 0.3
32
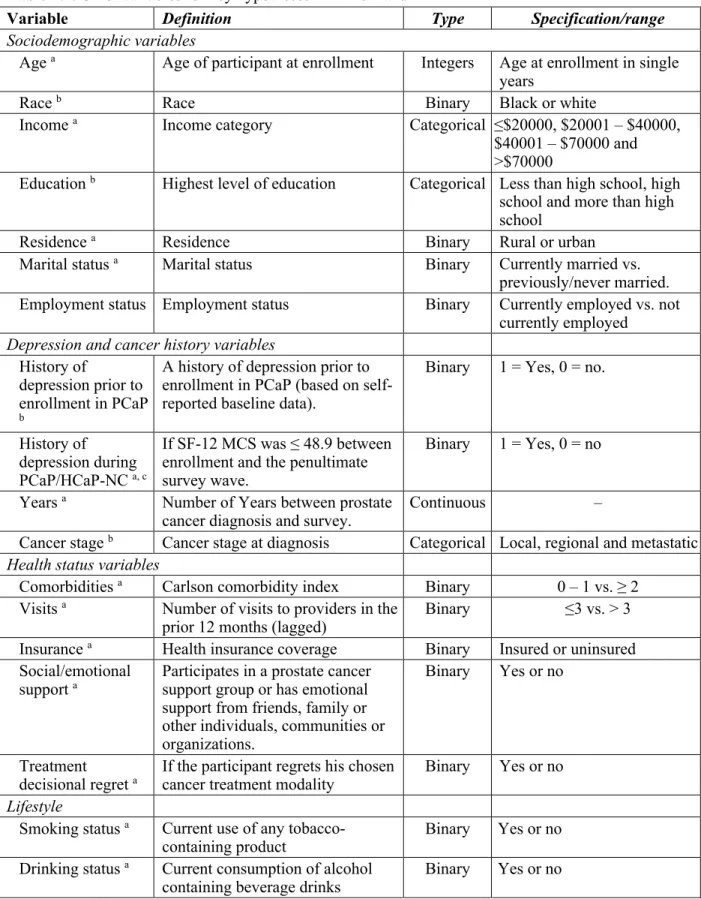
Table 2.2: Other variables for key hypotheses in Aims 1 and 2
Variable Definition Type Specification/range
Sociodemographic variables
Age a Age of participant at enrollment Integers Age at enrollment in single years
Race b Race Binary Black or white
Income a Income category Categorical ≤$20000, $20001 – $40000,
$40001 – $70000 and >$70000
Education b Highest level of education Categorical Less than high school, high school and more than high school
Residence a Residence Binary Rural or urban
Marital status a Marital status Binary Currently married vs. previously/never married. Employment status Employment status Binary Currently employed vs. not
currently employed
Depression and cancer history variables
History of
depression prior to enrollment in PCaP b
A history of depression prior to enrollment in PCaP (based on self-reported baseline data).
Binary 1 = Yes, 0 = no.
History of depression during PCaP/HCaP-NC a, c
If SF-12 MCS was ≤ 48.9 between enrollment and the penultimate survey wave.
Binary 1 = Yes, 0 = no
Years a Number of Years between prostate
cancer diagnosis and survey. Continuous –
Cancer stage b Cancer stage at diagnosis Categorical Local, regional and metastatic
Health status variables
Comorbidities a Carlson comorbidity index Binary 0 – 1 vs. ≥ 2 Visits a Number of visits to providers in the
prior 12 months (lagged) Binary ≤3 vs. > 3 Insurance a Health insurance coverage Binary Insured or uninsured Social/emotional
support a Participates in a prostate cancer support group or has emotional support from friends, family or other individuals, communities or organizations.
Binary Yes or no
Treatment
decisional regret a If the participant regrets his chosen cancer treatment modality Binary Yes or no
Lifestyle
Smoking status a Current use of any
tobacco-containing product Binary Yes or no
Drinking status a Current consumption of alcohol
33
Adherence toexercise
recommendations a
In Metabolic Equivalent Tasks per