Juri Baishya, Suraj Sharma IJSRE Volume 05 Issue 06 June 2017 Page 6526 Volume||5||Issue||06||June-2017||Pages-6526-6532||ISSN(e):2321-7545 Website: http://ijsae.in Index Copernicus Value- 56.65 DOI: http://dx.doi.org/10.18535/ijsre/v5i06.05
Analysis of Physico-Chemicals Properties of Soil under Different Land Use System with
Special Reference to Agro Ecosystem in Dimoria Development Block of Assam, India.
Authors
Juri Baishya1, Suraj Sharma*2 1
Department of Eco-Restoration, Dimoria College, Khetri (under Department of Life Science, Dibrugarh University, Assam, India.
2
Department of Ecology and Environmental Science, Assam University, Silchar, Assam, India.
*
Corresponding author: [email protected]
ABSTRACT
Some physico-chemical parameters were selected as indicator of soil quality and were investigated in the present study under the selected different land use system in Dimoria Development Block under Kamrup District of Assam. Through the present study soil under different agro ecosystem have investigated. Orange orchard, tea plantation and rubber plantation are three different plantation sites, two shifting cultivated lend and a control site were selected for the study. 0-15 cm and 15-30 cm are two depths, used for soil sampling. Moisture, water holding capacity, bulk density, porosity, micro and macro nutrients were selected as soil quality indicators. The result of pH value is ranging from 4.64 to 5.98 at the depth of 0-15 cm and 4.27 -5.30 at the depth of 15-30 cm. It indicates the acidic condition of soil. Study has evaluated the soil parameters with different depth. In most cases bulk density was high in lower subsoil in comparison with surface soil. Chemical parameters were found decreasing with increasing of soil depth. Micronutrients Mn, Cu, Fe and Zn were highly present at the both depth under all selected plot, Mn=13.50-16.84>3.0(ppm), Cu=1.12-4.55>0.6(ppm), Fe=10.42-20.65>5.6(ppm), Zn=1.13-3.64>1.0(ppm). Correlation has done among micro and macro nutrients and only Zn accept significant correlation with potassium.
Keywords: Physico-chemical parameters, Soil quality, Soil quality indicator, soil sampling, Organic carbon.
INTRODUCTION
India is a large country having various soil types with its diverse range of climatic, geographic and topographic condition. Indian soil has dived into eight major types by the All India Soil Survey Committee, set up by ICAR (Indian Council of Agricultural research).They are alluvial soil, black soil, red soil, laterite and lateritic soil, forest and mountain soil, arid and desert soil, saline and alkaline soil, peaty and marshy soil. Bhattacharya et al. described 11 major groups of soil in their study [1]. Assam is the state of humid tropical climate in India covered with Barak and Brahmaputra valley. Soils of Assam are acidic and most of the plantation crops, native horticulture fruit crops are known for their sustenance in acid soil [2]. The Brahmaputra valley is covered with alluvium soil which has been defined as unconsolidated sediment [1]. The soil of south bank of Brahmaputra is rich in organic carbon [2]. Depending on the quality, soil of Assam is suitable for agriculture.
Juri Baishya, Suraj Sharma IJSRE Volume 05 Issue 06 June 2017 Page 6527
supporting agriculture and forestry [4]. Traditional faith and culture of indigenous people are greatly concern with agricultural practice [5]. It is the dominance land use category in Assam. According to ENVIS Center more than 64% of its total land is under agriculture. Plantation and shifting cultivation are two famous land use system, practiced in Assam. Various land use systems leads to depletion of soil health with decline of soil nutrient. Cultivation is responsible for the considerable loss of soil organic carbon [5].In the present study, two types of soil quality indicators have selected such as Physical parameters and chemical parameters.
Study area
Dimoria Development Block, the area of study is located on the south bank of Brahmaputra River and on south east of Kamrup metro district of Assam. The area is bounded by Morigaon district on the north east, Guwahati city on the west and Meghalaya on the south. The study site lies within latitude 2600ʹ N- 26014ʹ0″N and longitude 91051′0″E-92010′0″E. Annual temperatures 270 C and annual rainfall is 200 cm [4], with tropical monsoon climate.
Selected sampling plot
The present study was done under six different land use system especially under agro ecosystem in Dimoria development block. Two shifting cultivated land, one is from Kiling Khomar village and another from Bhodaikuchi village, three plantation system such as orange orchard, tea and rubber plantation and a control site were selected for the study.
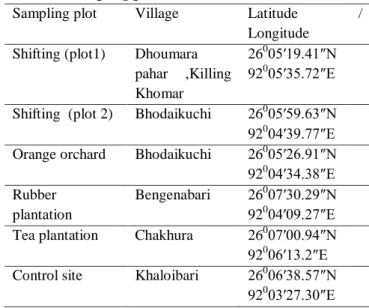
Table 1: Sampling plot with their location
Sampling plot Village Latitude /
Longitude Shifting (plot1) Dhoumara
pahar ,Killing Khomar
26005′19.41″N 92005′35.72″E
Shifting (plot 2) Bhodaikuchi 26005′59.63″N 92004′39.77″E Orange orchard Bhodaikuchi 26005′26.91″N 92004′34.38″E Rubber
plantation
Bengenabari 26007′30.29″N 92004′09.27″E Tea plantation Chakhura 26007′00.94″N 92006′13.2″E Control site Khaloibari 26006′38.57″N
92003′27.30″E
OBJECTIVES OF THE STUDY
To analysis and compare the physico-chemical parameters of soil within the selected land use patterns. To determine the correlation between the chemical parameters of soil using spss statistical software.
METHODOLOGY Sampling procedure
Juri Baishya, Suraj Sharma IJSRE Volume 05 Issue 06 June 2017 Page 6528 Selected soil quality indicators and its methodology for study
Physical parameters Chemical parameters
Texture PH
Water holding
capacity(WHC)
Organic carbon(O)
Soil Moisture
Content(SMC)
Available nitrogen(N)
Bulk Density(BD) Available phosphorus(P)
Porosity Available potassium(K)
Available of Mn, Cu, Fe, Zn.
METHODS
WHC was determined by oven dry method using brass box [9], SMC was determined by oven dry method using 10 gm of fresh soil [10].soil samples were kept in oven for 24 hours at 600C temperature. Bulk density was analyzed by core method using metallic cylinder [4], Porosity was also done with core sampling method. PH was analyzed by electrometric PH meter using 1:2.5 ratios of soil and water [11]. Using colorimetric method organic carbon was estimated [8] and available nitrogen was estimated using mridaparikshak kit of soil analysis. Available P was determined by Bray and Kurtz method [12] and available K was determined by flame photometer [13]. Available Mn, Cu, Fe and Zn were determined by atomic absorption spectrophotometer [11].
RESULTS
Soil qualities are showing at the given table 1 and 2. In more cases moisture was found almost similar with the control area except in the SC1 (table 2). Expose of soil without canopy is the cause of greater evaporation in that area. At the surface level Tea garden have highest value (74) of WHC and low value (.91) of BD. On the other hand SC2 have lowest value (1.84) of WHC and highest value (1.17) 0f BD. It express that compact soil has less capacity of water holding. Micronutrients are highly available at all the sites in comparison with normal value (Mn>3.0, Cu>0.6, Fe>5.6 and Zn>1.0)[14].
Table 2. Physical properties of soil under different land use system with two depths (0-15 cm. and 15-30 cm.)
Soil Properti es Dept h (cm) Plots
SC 1 SC 2 RP OO TP C1
Texture 0-15 CL CL CL CL CL CL
15-30 CL CL CL CL CL CL
Moisture %
0-15 13.1 2 17.7 8 29.1 4 17.6 4 17.4 2 17.23
15-30 11.2 3 10.9 8 23.6 1 13.3 7
6.6 5.3
WHC %
0-15 62.3 1
1.84 10.4 1 73.2 5 74.0 0 66.96
15-30 57.5 2
29.1 5
84.9 2
79.5 58.4 70.07
BD (gm/cm3)
0-15 0.94 1.17 1.03 0.95 0.91 0.88 15-30 1.06 1.30 1.66 0.97 0.96 0.92
Porosity %
0-15 63.9 8
55 60.3
8
63.4 6
65 66.15
15-30 59.2 3
50 36.1
5 62.6 9 63.0 8 64.61
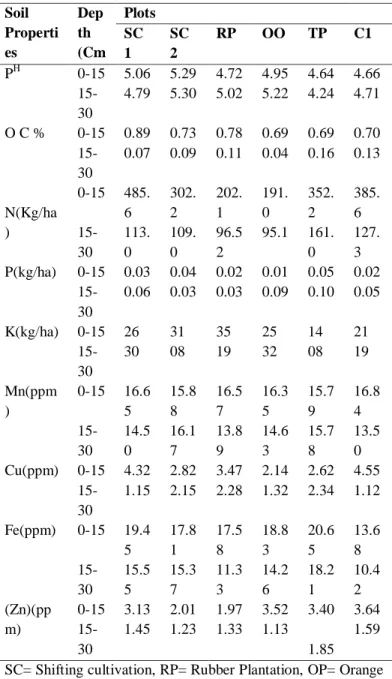
Juri Baishya, Suraj Sharma IJSRE Volume 05 Issue 06 June 2017 Page 6529 Table 3: Chemical properties of soil under different land
use system with two depths (0-15 cm. and 15-30 cm.) Soil Properti es Dep th (Cm Plots SC 1 SC 2
RP OO TP C1
PH 0-15 5.06 5.29 4.72 4.95 4.64 4.66
15-30
4.79 5.30 5.02 5.22 4.24 4.71
O C % 0-15 0.89 0.73 0.78 0.69 0.69 0.70
15-30
0.07 0.09 0.11 0.04 0.16 0.13
N(Kg/ha )
0-15 485. 6 302. 2 202. 1 191. 0 352. 2 385. 6 15-30 113. 0 109. 0 96.5 2
95.1 161. 0
127. 3 P(kg/ha) 0-15 0.03 0.04 0.02 0.01 0.05 0.02
15-30
0.06 0.03 0.03 0.09 0.10 0.05
K(kg/ha) 0-15 26 31 35 25 14 21
15-30
30 08 19 32 08 19
Mn(ppm )
0-15 16.6 5 15.8 8 16.5 7 16.3 5 15.7 9 16.8 4 15-30 14.5 0 16.1 7 13.8 9 14.6 3 15.7 8 13.5 0 Cu(ppm) 0-15 4.32 2.82 3.47 2.14 2.62 4.55
15-30
1.15 2.15 2.28 1.32 2.34 1.12
Fe(ppm) 0-15 19.4
5 17.8 1 17.5 8 18.8 3 20.6 5 13.6 8 15-30 15.5 5 15.3 7 11.3 3 14.2 6 18.2 1 10.4 2 (Zn)(pp m)
0-15 3.13 2.01 1.97 3.52 3.40 3.64
15-30
1.45 1.23 1.33 1.13 1.85
1.59
SC= Shifting cultivation, RP= Rubber Plantation, OP= Orange Orchard, TP= Tea Plantation, C1= Control Site
Table 4: Correlation among the selected chemical soil properties (0-15cm)
C N P K Mn Cu Fe Zn
PH .331 .070 .092 .474 -.265 -.187 -.200 -.422
C .511 -.006 .411 .401 .545 .215 -.274
N .430 -.416 .192 .674 -.009 .346
P -.398 -.732 -.129 .465 -.160
K .246 .064 -.178 -.818*
Mn .757 -.619 .226
Cu -.576 .099
Fe -.051
Juri Baishya, Suraj Sharma IJSRE Volume 05 Issue 06 June 2017 Page 6530 DISCUSSION
Physical Properties
Soil texture is one of the important soil indicators which regulate the other soil parameters. Soil texture found clay loam in the present study. Textures were same in all selected area. These findings are slightly dissimilar with the findings of Sharma, 2015[4] at Dimoria developmental block. Soil moisture is the amount of water in soil. Moisture content in the present study ranges between 13.12% and 19.14% in surface layer of soil and in subsoil layer it ranging between 5.3% and 13.61%. Moisture value in surface layer found higher than subsoil layer. WHC ranges 1.84% -74% in surface soil and 29.15% - 84.92% in the subsoil in the present investigation. Bulk density increases respectively with soil depth (table: 2). Increasing compaction of lower horizon with time is the cause of greater bulk density. This is also reported by Bhuyan et al., 2013[15] and Bhuyan et al., 2014[15]. Porosity found in surface soil 55%-66.15% and 36.15% - 64.61% in subsoil. Almost similar results were found in the work conducted by Bhuyan et al., (2014) [5], in Eastern Himalayan Region. Porosity is inversely changes with bulk density and it was greater in surface soil in comparison with subsoil layer. Similar findings were reported by Baruah et al., 2013[17] and Tripathi et al., 2009[10].
Chemical Properties
PH is one of the soil indicators which value represents the soil nature of an area. In this study, pH ranges within 4.64-5.29 at 0-15 cm. depth and 4.24-5.30 at 15-30cm. depth. This result indicates strongly acidic nature of soil under Dimoria [18]. Gogoi et al., 2016[12], Jayanthi et al., 2015[19], Sharma [4], 2015 and Athokpam et al., 2013[11] were agreed to this findings. But the report on soil pH of Sharma, 2015[4] and Athokpam et al., 2013[11] showed the soil of their study area were strongly acidic to moderately acidic. Organic carbon (C) and available nitrogen (N) are the essential nutrients, value of which indicates the decomposition rate of detritus on soil surface. Results of C and N ranges within 0.69%- 0.89% and 191kg/ha – 485.6 kg/ha in surface layer and 0.04% -0.16% and95.1kg/ha -161kg/ha in subsoil respectively. These data indicate the greater amount of C and N is present in surface layer of soil than subsurface soil. C is positively correlated with soil moisture. It increases with moisture. This is also reported by Das and Bindi, 2014[13]. Resultant organic C is slightly similar to the report presented by Bhuyan et al., 2013[15] and N value found higher in present study than Das and Bindi, 2014[13]. C and N are positively correlated with each other and with pH. Both C and N found higher in shifting cultivated plot 1. Available P and K values are 0.01-0.05 kg/ha and 14-35 kg/ha at the depth of 0-15 cm. and 0.03-0.10kg/ha and 8-32 kg/ha at the depth of 15-30cm. respectively. Available P found higher in subsurface layer of soil. This was agreed to result of Bhuyan et al., 2013[15] and disagreed to the result of Gogoi et al., 2016[12]. Tea garden has high amount of P. C is negatively correlated with P (-.006) and positively correlated with K (.411) (table: 4).
Available Mn, Cu, Fe and Zn are the micronutrients which essential for plant growth. All land use system has almost similar Mn value with the normal range (control site). In the present investigation, Mn, Cu, Fe and Zn are ranging within 15.79-16.84 ppm, 2.14-4.55 ppm, 13.68-20.65 ppm and 1.13-3.64 ppm in the surface layer and 13.50-16.57 ppm, 1.12-2.82ppm, 10.42-18.21ppm and 1.13-185ppm in subsoil respectively. Highest value of iron (Fe) present in Tea garden. All micronutrients showed the decrease trend with soil depth.
Juri Baishya, Suraj Sharma IJSRE Volume 05 Issue 06 June 2017 Page 6531 CONCLUSION
Selected physical and chemical indicators showed the nutrient level of soil and interconnection with each other. WHC and porosity was higher in shifting cultivated land 1 and in orange orchard. It helps in the growth of crop roots as well as crops. Value of pH indicates acidic nature of soil. Acidic soil is good for plant growth. C and N were high in surface soil because of more detritus were available in surface soil. In the Shifting cultivated land, C and N value found higher because the residue of rice and other crops were left in the field. Phosphorus found very less in the all land use system. Applying proper dose of N, P, K specially phosphorus, soil of the area can make more fertile and can produce food and crops sustainably. In the shifting cultivation, for minimizing the soil erosion, leaching of soil nutrients with rain water, proper bund and mulching processes can be apply.
For further analyzing, monitoring and management of soil nutrients, C, N, P, K as well as micronutrients can be applied.
Acknowledgement
I am much grateful to the Director and stuff of the Soil Survey Laboratory, Agriculture Department, Ulubari for help in the chemical analysis of soil and also thankful to Dimoria College for giving me the opportunity to this investigation. Also I am grateful to Mr. Arup Kumar Bharali, Laboratory demonstrator, Department of Eco-Restoration, Dimoria College, Khetri for his unconditional help during my analysis. And I am in debt to Mr. John Sangma, Bearer, Department of Botany, Dimoria College Khetri for his assistance during my field visit.
REFERENCES
1. Bhattacharya, T., Pal, D.F., Mandal ,C., Chandran, P., Ray,S.K., Sarkar,D., Velmourougane,K., Srivastav,A., Sidhu,G.S., Singh,R.S., Nagar,A.P., Nimkhedkar, S. S., 2013, “Soil of India: historical perspective, classification and recent advances”, Current Science,104(10):1308-1323.
2. Sen, T.K., Dubey, P.N., Nayak, D.C., Baruah, U., Bhattacharya, T., Majhi, A.K. and Velayuthum, M., 2003, “Soil resource information for agricultural planning and development of Assam”, Agropedology, 13:50-59.
3. Raut, P.P. and Ekbote, P.D., 2012, “Physico-chemical analysis of soil collected from Babhulgaon Region, Dist. Yuvatmal(M. S.)”, International Journal of Basic and Applied Research,112-116. 4. Sharma, C., 2015, “Physico-chemical properties of soil with special reference to organic carbon
stock under Different Land Use System in Dimoria Tribal Belt of Assam”, Journal of Agriculture and veterinary Science, 8(3):32-36.
5. Bhuyan, S. I., Tripathi, O.P. and Khan, M. L., 2014, “Soil characteristics, dynamics of microbial biomass: a study of hill agro-ecosystem, Eastern Himalayan, India”, International Journal of Current Science 12: 97-86.
6. Wagh, G. S., Chavhan, D.M. and Sayyed, M. R. G., 2013, “Physico-chemical analysis of soil from Eastern part of Pune city”, Universal Journal of Environmental Research and technology, 3(1):93-99. 7. Gosian, B. G., 2016, “Some physico-chemical properties of Oak and Pine FYM based crop field soils: A study from mountain watershed, Kumaun Himalaya”, International Journal of Applied Research, 2(7):713-718.
8. Devi, H. R. and Dkhar, M. S., 2014, “Comparative study on soil fungal Diversity of Mawphlang Sacred Grove and Disturbed forest North East India”, International Journal of Science, Research and Technology,2(5):64-72.
Juri Baishya, Suraj Sharma IJSRE Volume 05 Issue 06 June 2017 Page 6532
10.Tripathi, O. P., Pandey, H. N. and Tripath, R. S., 2009, “Litter production, decomposition and physico-chemical properties of soil in three developed agro forestry systems of Maghalaya, Northeast India”, African Journal of Plant Science,3(8):160-167.
11.Athokpam, H., Wani, H. S., Kamei, D., Athokpam, H. S., Nongmaithem, J., Kumar, D., Singh, Y. K., Naorem, B. S., Devi, T. R. and Devi, L., 2013, “Soil macro and micro nutrient status of Senapati district, Manipur, (India)”, African Journal of Agricultural Research,8(39):4932-4936.
12.Gogoi, S., Mishra, G. and Deka, A. K., 2016, “Soil nutrients dynamics in Tea agro forestry ecosystem of Golaghat district of Assam, India”, Agricultural Science and Digest 36(3):185-190. 13.Das, B. and Bindi, 2014, “Physical and chemical analysis of soil collected from Jaismand”,
Universal Journal of Environmental Research and Technology,4(5):260-164.
14.[14]Pratim, Brajendra, Thakur, N. S. A. and Ramesh, T.,Soil Testing and Analysis, Pitampura,New Delhi, 2007:74.
15.Bhuyan, S. I., Tripathi, O.P. and Khan, M. L., 2013, “Soil nutrients status in prominent agro ecosystems of East Siang district, Arunachal Pradesh”, International Journal of Environmental Science, 3(6):1957-1968.
16.Bhuyan, S. I., Tripathi, O.P. and Khan, M., 2014, “Soil N-mineralization dynamics under four major lands uses pattern in Easter Himalaya”, Journal of Tropical Agriculture, 52(2):162-168.
17.Baruah, B. K., Das, B., Medhi, C. and Misra, A. K. , 2013, “Fertility status of soil in the Tea garden Belts of Golaghat district, Assam”, India, Journal of Chemistry, article ID 983297,6 pages.
18.Soil survey division staff, Soil Survey Manual, Jodhpur: Scientific publishers, 2004:192.