AUTOMATING EHR-BASED REPORTS TO UNDERSTAND PATIENT TRANSFERS FROM THE EMERGENCY DEPARTMENT TO FACILITIES OUTSIDE OF A
HEALTHCARE SYSTEM
Elaine Neal James
A projected submitted to the faculty of the University of North Carolina at Chapel Hill in partial fulfillment of the requirements for the degree of Doctor of Nursing Practice in the School of
Nursing (Health Care Systems-Informatics).
Chapel Hill 2019
ABSTRACT
Elaine Neal James: Automating EHR-Based Reports to Understand Patient Transfers from the Emergency Department to Facilities Outside of a Healthcare System
(Under the direction of Saif Khairat)
The electronic health record (EHR) is used in emergency departments to document patient care. Data elements in the EHR can be structured or unstructured. Before the implementation of this project, the reason a patient was transferred from the emergency department (ED) to a facility outside of the WakeMed healthcare system was recorded in an unstructured progress note. Time-consuming manual chart reviews were required to identify why patients were being transferred. The WakeMed executive team sought to understand the reasons for these transfers, to address concerns of patient satisfaction, patient safety, increased healthcare costs, and loss of revenues.
The purpose of this quality improvement project was to capture the primary reasons patients are being transferred to facilities outside of the WakeMed system using a structured data field, known as a SmartList, while avoiding increased workflow burden on the ED provider. The data from SmartList was used to update a daily ED transfer report and improve the quality of the report by providing more thorough information about why patients are transferred. This project had a mix of goals (electronic data capture, improved data quality) and challenges (large volume of patients makes it cumbersome to do manual chart reviews).
The Data-Information-Knowledge-Wisdom (DIKW) framework was the overall
ACKNOWLEDGMENTS
I want to acknowledge and thank each of my committee members for their time, support, valuable feedback, and expertise in guiding this project. This project would not have been successful without each of you. To my chair and advisor, Dr. Saif Khairat, thank you for your encouragement and for helping me see the bigger picture. To Dr. Debbie Travers, thank you for helping me get the project off the ground. To Dr. Branson Page, thank you for being
instrumental in getting the project implemented.
Additionally, I would like to acknowledge and thank Chantal Howard and Vincent Miliano from WakeMed for your time and assistance with this project. Without you, it would not have been possible.
I want to acknowledge and thank the executive team members from WakeMed for taking the time to provide feedback.
I want to acknowledge and thank, the providers from Wake Emergency Physicians, PA, for the excellent care you provide to the patients at WakeMed, willingness to accept changes in the way things are completed, and taking the time to provide feedback regarding those changes.
TABLE OF CONTENTS
LIST OF TABLES ... ix
LIST OF FIGURES ... x
LIST OF ABBREVIATIONS ... xi
CHAPTER 1: INTRODUCTION ... 1
Problem Statement ... 3
Purpose ... 5
Review of Literature... 6
Theoretical Framework ... 10
CHAPTER 2: METHODS ... 13
Setting and Participants ... 13
Phase 1: Pre-implementation ... 13
Phase 2: Implementation ... 16
Phase 3: Post-Implementation ... 17
Study Outcomes ... 19
Statistical Analysis ... 20
CHAPTER 3: RESULTS ... 21
Emergency Department Patient Demographics ... 21
Reason for Transfer ... 26
Manual Chart Review Time/Completion Compliance ... 28
CHAPTER 4: DISCUSSION ... 36
CHAPTER 5: LIMITATIONS AND FUTURE WORK ... 38
CHAPTER 6: CONCLUSIONS ... 39
APPENDIX A: ORIGINAL TRANSFER REPORT FORMAT ... 41
APPENDIX B: PRISMA DIAGRAM ... 42
APPENDIX C: INSTITUTIONAL REVIEW BOARD REVIEWS ... 43
APPENDIX D: PROJECT DATA COLLECTION TOOL TEMPLATE ... 47
APPENDIX E: ED PROVIDER TRAINING POWERPOINT ... 48
APPENDIX F: UPDATED DAILY ED TRANSFER REPORT ... 53
LIST OF TABLES
Table 1 - Classification of Ease of Data Extraction from Emergency
Department (ED) Charts ... 4
Table 2 - WakeMed Emergency Department (ED) Statistics for 2017 ... 5
Table 3 - Emergency Department (ED) Patient Demographics ... 22
Table 4 - Emergency Department (ED) Payor ... 23
Table 5 - Emergency Department (ED) Chief Complaints and Primary ED Diagnosis ... 24
Table 6 - Emergency Department (ED) Throughput Times ... 25
Table 7 - ED Throughput Calculation Definitions ... 26
Table 8 - Pre-Implementation Primary Reason for Transfer ... 27
Table 9 - Post-Implementation Primary Reason for Transfer ... 28
Table 10 - Manual Chart Review Times ... 29
Table 11 - System Usability Scale (SUS) Interpretation ... 34
LIST OF FIGURES
Figure 1 - System usability scale questionnaire ... 19 Figure 2 - Percent of compliance for documentation of the primary
LIST OF ABBREVIATIONS
APP Advanced Practice Provider
ARRA American Recovery and Reinvestment Act CDC Centers for Disease Control
CINAHL Cumulative Index to Nursing and Allied Health Literature DIKW Data, Information, Knowledge, Wisdom
DNP Doctor of Nursing Practice
ED Emergency Department
EDs Emergency Departments EHR Electronic Health Record ESI Emergency Severity Index
GT Greater Than
ICD-10 International Classification of Diseases, Tenth Revision
Iowa Model Iowa Model of Evidence-Based Practice to Promote Quality Care IRB Institutional Review Board
HITECH Health Information Technology for Economic and Clinical Health Act IT Information Technology
LOS Length of Stay
LT Less Than
MD Medical Doctor
NI Nursing Informatics
ONC The Office of the National Coordinator for Health Information Technology Office of the Secretary
PA Physician Assistant POC Epic Test System PRD Epic Live System
PRISMA Preferred Reporting Items for Systematic Reviews and Meta-Analyses SUS System Usability Scale
CHAPTER 1: INTRODUCTION
On February 17, 2009, the Health Information Technology for Economic and Clinical Health (HITECH) Act, part of the American Recovery and Reinvestment Act of 2009 (ARRA), was signed into law by President Barack Obama (Rouse, 2018; The Office of the National Coordinator for Health Information Technology Office of the Secretary [ONC], 2016). This bill was created to stimulate the adoption of electronic health records (EHR) and use of information technology (IT) throughout the health system in the United States (Rouse, 2018; ONC, 2016). Before 2009, information was captured on paper in most hospitals, doctors' offices, and other health facilities; then this information was shared primarily by using fax machines (ONC, 2016). Additional challenges of paper-based health records included the need for time-consuming retrospective medical chart reviews to gather data regarding specific treatments/interventions that informed improvements in health outcomes; sharing information with public health officials; and complexity in measuring health outcomes at the practice, community, state, or national level (ONC, 2016). According to ONC (2016), in 2008, only 17% of physicians and nine percent of hospitals had at least a basic EHR. In comparison in 2015, 96% of hospitals and 78% of physician offices use certified (meets requirements adopted by the Department of Health and Human Services) EHR technology (ONC, 2016).
penalized for not meeting the standards by a specific time (Rouse, 2010). In response to the financial incentives, improvements in patient care delivery have been recognized with the adoption of the EHR. Benefits include the ability to share data such as lab or imaging results, more efficient storage/retrieval of patient information, less redundancy in effort, standardization of services/patient care, access to patient data, and decision support for healthcare professionals (Rouse, 2017). Also, with the implementation of the EHR, there is an increase in access to clinical data that can be used for quality improvement, population health management, and clinical research (Hanauer, Mei, Law, Khanna, & Zheng, 2015).
Data elements from the EHR can be divided into two categories: structured and unstructured data (Wells, Chagin, Nowacki, & Kattan, 2013). Structured or discrete data are made up of quantitative numeric values (e.g., temperature, pulse) and of pre-defined categories (e.g., diagnosis codes from International Classification of Diseases, Tenth Revision, (ICD-10)) (Wells et al., 2013). Structured data are stored in databases where the data can be easily
retrieved for statistical analysis (Wells et al., 2013). Unstructured/narrative/textual data are located in the free text areas of the patient chart such as the progress notes (Wells et al., 2013). Unstructured data are less easily retrieved, but are a source of information for care delivery, decision support, research, and enhancement of structured data (Amorosano, 2012; Wells et al., 2013).
transfer” from this clinical note: “79 yo with 35% TBSA burns sustained in a house fire. Also, inhalation injury. Accepted by UNC Burn Center.” Wells et al. (2013) argue that to maximize the potential of the EHR for research and patient care activities, structured data should be captured whenever possible. Disadvantages of using structured data fields have been reported, such as the field may be cumbersome, lack the flexibility, lack expressivity for the user, or may not match the current workflow, therefore causing an increased burden on the user (Gardner et al., 2014; Rosenbloom et al., 2011).
Problem Statement
Table 1
Classification of Ease of Data Extraction from Emergency Department (ED) Charts
Classification Description Example
Easy Data element stored as a
structured and accessible database field.
Age at time visit stored as an integer, ED diagnosis stored ICD-10 code, chief complaint stored as a discrete field selected from a list of values. Moderate Data element that requires the
use of more than one structured database field to calculate.
ED throughput times such as “Door to Doc” which uses the calculation the time the patient arrives at the ED until the doctor/ED provider sees them; ED length of stay which is the arrival time until ED departure time.
Complex Data element stored as free-text or needs human interpretation to be abstract.
Reason for transfer to an outside facility stored in progress notes as free text. Source: Adapted from (Capurro, van Eaton, Black, &Tarczy-Hornoch, 2014, p. 3)
According to the Centers for Disease Control and Prevention (CDC) (2017), in 2014, there were 141.4 million emergency department visits for patients of all ages. Of these visits, 1.9% resulted in a transfer to a different (psychiatric or other) hospital (CDC, 2017). In a study by Li et al. (2016), manual chart reviews revealed reasons for interfacility ED transfers included the need for a specialist not available at the current hospital, patient/family request, inpatient admission, or intensive care admission.
Table 2
WakeMed Emergency Department (ED) Statistics for 2017
Location Number of
ED Beds
Number of ED Visits
Patients Transferred to Facilities Outside of WakeMed
n %
Apex 12 19,638 169 0.9
Brier Creek 12 20,991 123 0.6
Cary 35 45,177 578 1.3
Garner 12 32,661 319 1.0
North 19 43,203 447 1.0
Raleigh Adult ED 69 86,817 766 0.9
Raleigh Children’s ED 24 41,613 263 0.6
Totals 183 291,100 2,665 0.9
Source: (E. Wilson, personal communication, March 27, 2018; James, 2017)
Before the current project, the executive team of the project site received a daily report which included the number of transfers from the emergency departments to outside facilities from the previous day. The report consisted of extracted information from structured data fields for patient name, age, chief complaint, ED diagnosis, the location the patient is being transferred to, and the authorizing provider. The daily transfer report was not completely meeting the information needs of the executive team because it did not include the reason for the transfers. Since the transfer reason was not available in a structured data field, a manual review of the patient’s progress notes in the EHR was required to gather these additional data. It was not possible to add the reason for the transfer to the report because the location of the information in the progress note varied from patient to patient, and WakeMed currently does not have an NLP tool available to pull these data from an unstructured data field and place it on the report. (See Appendix A).
Purpose
field, known as a SmartList, while avoiding increased workflow burden on the ED provider. This structured data field conformed to a pre-defined list of options for reason for transfer from the ED to an outside facility. The data from SmartList were used to update the daily ED transfer report to improve the quality of the report by providing more thorough information about why the patient was being transferred. The hypothesis was that the addition of the SmartList in the EHR to document the transfer reason would make it possible to achieve electronic data retrieval and reduce the need for manual chart reviews, while not increasing the burden of work on the ED provider.
Review of Literature
A literature review was completed using the Preferred Reporting Items for Systematic Reviews and Meta-Analyses (PRISMA) (Moher, Liberati, Tetzlaff, Altman, & Group, 2009). See Appendix B for the PRISMA 2009 Flow Diagram that summarizes the process used. Studies were identified by using two databases: PubMed and the Cumulative Index to Nursing and Allied Health Literature (CINAHL). With assistance from the Health Sciences Nursing librarians, a teaching assistant, and project chairperson relevant search terms were chosen to complete the review of the literature. The search terms included: (“discrete data” OR “structured data”) AND ("electronic health record"), “natural language processing” AND "data capture", “(structured data” OR “unstructured data”) AND (“quality reporting), "secondary use of patient data", "automated chart review", “clinical data capture”, and "manual chart review" AND "automated chart review". No inclusion or exclusion criteria were used.
text (n= 29) were reviewed. After applying the exclusion criteria, 17 articles were used to conduct the review of literature.
Manual Versus Electronic Chart Review
The use of manual chart reviews has been labeled as the “gold standard” in quality
improvement projects and research to collect data (Bailey et al., 2016; Gardner et al., 2014; Hu et al., 2016; Martin et al., 2017; Wu et al., 2013). There are drawbacks to the method of manual chart reviews. Disadvantages identified are: time-consuming, labor intensive, inefficient, expensive, and some reviews lack inter-rater reliability (Bailey et al., 2016; Hazlehurst, McBurnie, Mularski, Puro, & Chauvie, 2012; Hu et al., 2016; Martin et al., 2017; Urech et al., 2015; Wu et al., 2013). As Wu et al. (2013) explained, manual chart review works well when collecting data from a small patient sample but more challenging for a larger patient sample. For example, their experience of collecting data for 900 children with asthma took six months to complete (Wu et al., 2013). In most cases, however, manual chart reviews do provide high-quality data (Hu et al., 2016).
In contrast, electronic chart reviews use information collected from structured data fields in the EHR; then the information can be stored in a data warehouse or database for automated processing. The use of automated data has been shown to have a near perfect match to manual chart reviews and a high correlation of results between the two, but there may be some
Structured Data and Unstructured Data in the EHR
Studies have shown there are discrepancies between the data gathered electronically from structured fields in the EHR and a manual chart review. In many cases, the discrepancy is due to information being documented in unstructured areas of the chart such as free text notes or
scanned documents (Gardner et al., 2014; Urech et al., 2015). This information is not available for electronic retrieval but extracted during a manual chart review (Gardner et al., 2014; Urech et al., 2015). To improve the quality of documentation, a site implemented a decision support system protocol which required structured data fields to prompt the user to enter critical data that is missing from the documentation. (Haberman, Rotas, Perlman, & Feldman, 2007).
Two disadvantages of using structured data fields have been reported. First, the field may be cumbersome, lack the flexibility, or expressivity for the user (Rosenbloom et al., 2011). The provider may not be able to express their thoughts in a manner to preserve the complexity and nuances of each patient (Rosenbloom et al., 2011). Secondly, the field may not match the current workflow, therefore causing an increased burden on the user (Gardner et al., 2014). Use of Templates
Templates are entry tools composed of pre-defined data elements and are used to document patient care (Gimbel, Olsen, Williams, & Stephens, 2012; Neri et al., 2014). The SmartList used for this project is a form of a template with structured data of pre-defined reasons for transfers outside of the healthcare system. Templates have been shown to increase
implemented as a way to guide the documentation to increase the quality and completeness of notes in the patient’s record (Goebel et al., 2014; Neri et al., 2014).
Use of Natural Language Processing for Data Extraction
There is evidence in the literature that NLP systems can be effective at extracting useful information from unstructured clinical notes in support of clinical care, research and quality initiatives. NLP was used to collect quality and safety data from nursing narrative notes, such as pain management needs and chemotherapy side effects (Hyun, Johnson, & Bakken, 2009). Using NLP, Kaufman et al. (2016) found a statistically significant reduction in time required for documentation, improved usability and maintained its quality. The use of NLP text-mining allowed the user to confirm unplanned care in 53% of the clinic progress notes and 21% in telephone encounters (Tamang et al., 2015). Biron et al. (2014) found practitioners were able to use NLP to search unstructured data within medical documents and locate information to
facilitate care for their patients. In the past, the practitioners may not have had any access or knowledge of the information because it was in an unstructured field such as free text progress notes (Biron et al., 2014). Wu et al. (2013) developed and validated the use of an NLP system for extracting predetermined criteria of asthma in pediatric patients. The use of unstructured text was found to be more accurate for locating criteria than traditional approaches such as diagnosis codes (Wu et al., 2013).
performance are needed (Hanauer et al., 2015). Other limitations include specialized expertise needed to develop and train NLP systems, as well as the time-consuming system set up. Conclusion from Review of Literature
Several methods have been presented regarding how to achieve clinical data extraction from the EHR to improve the project site’s reporting without performing manual chart reviews. These methods include electronic chart reviews, structured data fields, use of templates and the use of NLP. Factors influencing which methods to use are the sample size; the ability to place templates in the system to guide the documentation; data location in structured or unstructured fields; and the ability to implement NLP. Based on the synthesis of the literature, a clear best form of data extraction has not been identified.
The evidence does support the use of electronic data extraction to obtain data that are comparable to the “gold standard” of a manual chart review. For this quality improvement project, there was a large sample size, but the site did not have NLP tools available. The site did have the ability to place pre-defined elements for the reason of transfer categories into a
structured field on a template in the EHR, for ED providers to use in their electronic documentation. Therefore, this was the method chosen to be implemented for this project. Theoretical Framework
The American Nurses Association (American Nurses Association [ANA], 2015) defines nursing informatics (NI) as:
The specialty that integrates nursing science with multiple information and analytical sciences to identify, define, manage, and communicate data, information, knowledge and wisdom in nursing practice. NI supports nurses, consumers, patients, the
McGonigle and Mastrian (2018) define nursing informatics (NI) as “the synthesis of nursing science, information science, computer science, and cognitive science for the purpose of managing and enhancing healthcare data, information, knowledge, and wisdom to improve patient care and the nursing profession” (p. 100).
In both definitions, key elements are data, information, knowledge, and wisdom. The Data-Information-Knowledge-Wisdom (DIKW) framework was the overall theoretical framework used to guide this project.
DIKW Framework
Data is the smallest component of the framework and is a raw fact that lacks meaning in isolation (Matney, Brewster, Sward, Cloyes, & Staggers, 2011; McGonigle & Mastrian, 2018). For example, for a patient seen in the ED, a piece of data collected is “he has a history of cancer” and is “currently undergoing chemotherapy.”
Information is data plus meaning (Matney et al., 2011). By combining different data points, information is formulated into a meaningful situation; it answers questions such as “who,” “what,” “when,” and “where” (Topaz, 2013). For our patient in the ED with a history of cancer, we record that he has a temperature of 102.5 degrees Fahrenheit, and a productive cough. Combining all these factors provides context to the situation.
assume the patient still has pneumonia, and with his recent chemotherapy, his immune system has likely weakened.
Wisdom is managing and solving human problems using knowledge appropriately (Topaz, 2013). Wisdom implies a form of ethics, or knowing why certain things/procedures should or should not be implemented. (Topaz, 2013). By putting together all the pieces of our example patient’s symptoms and history, we recognize that he is a high acuity patient and will need specific orders to facilitate his care in the ED.
The components of the DIKW framework are interrelated, and there is a constant flux between them (Topaz, 2013). Data are used to generate information and knowledge, and the new knowledge combined with wisdom might trigger an assessment of new data elements (Topaz, 2013).
Application of the Theory to the Project
CHAPTER 2: METHODS
The goal of this Doctor of Nursing (DNP) quality improvement project was to capture the reasons why patients are being transferred to facilities outside of the WakeMed system, while using a SmartList to avoid increased workflow burden on the ED provider. The secondary goal was to use the data from SmartList to update a daily ED transfer report to improve the quality of the data on the report by providing more thorough information about why the patient was being transferred. The Iowa Model of Evidence-Based Practice to Promote Quality Care (Iowa Model) was used to provide step-by-step guidance to take the identified problem, match it with an
intervention based on research, and make an organizational change to practice (Brown, 2014). The project had three distinct phases: pre-implementation, implementation and
post-implementation.
Setting and Participants
WakeMed Health and Hospitals are located in Wake County, North Carolina. The healthcare systems consist of three full-service hospitals, three freestanding emergency
departments, primary care practices, and specialty care practices (WakeMed Hospitals, 2018). There are seven full-service, Emergency Departments which are open 24 hours a day, seven days a week (WakeMed Hospitals, 2018). The Emergency Departments provide care for patients of all ages; one of the seven is dedicated to caring for children under the age of 18 years old.
Phase 1: Pre-Implementation
knowledge-situation was the need for process improvement data to understand the reasons why patients are transferred outside of the healthcare system. Without placing an extra burden on the ED
providers, we needed to collect data efficiently each day so that it could be used for reports and future analysis. Before implementation, the reason for transfer was subjective based on the interpretation of the chart reviewer.
The next step was to understand the significance of this topic to the organization (Melnyk & Fineout-Overholt, 2015). Having organizational buy-in and support from senior leadership was critical (Brown, 2014; Melnyk & Fineout-Overholt, 2015). Members of the executive team recognized that transfers out of the ED was a priority for the organization. An executive
requested the initial report of transfers, so they were aware of the number of transfers out of the seven EDs. If an executive requested more information regarding the patient situation than was on the report, a manual chart review was completed by the Chief Medical Officer or ED medical director for the site, which could be a costly use of resources. Reports had also been requested to identify if patients were being transferred because the resources are not available in this
healthcare system (i.e., a specific surgery specialty). Key Stakeholders
current user of the EHR); a systems analyst for ASAP (Epic EHR ED module) team in
Information Systems at WakeMed; and one of the business intelligence analyst for reporting in Information Systems at WakeMed (who was also the project leader).
Evaluation of Literature/Feasibility
The next steps of the Iowa Model applied to this project were to assemble relevant research/literature and then critique and synthesize the findings for evaluation in practice
(Brown, 2014). There was sufficient research available. There was evidence that the use of data extraction from a large number of records could be achieved by a variety of methods. Therefore, the use of a structured data field for reporting the reason the patients are transferred out of the healthcare system was achievable. A feasibility evaluation was conducted on the methods for extracting the data. Assessments included the following: ease of measurability of the data, integration within the provider workflow, affordability regarding time and cost to implement and sustain, ability to obtain the desired information, the interpretation of results, and the value added to the institution. Based on all these factors, the decision was made to create a SmartList
template for a structured data field, which was added to the disposition screen in Epic EHR for the ED providers to document the reason for the transfer.
Institutional Review Board Approval
Phase 2: Implementation
The next step was to pilot the change in practice using multiple steps for implementation and evaluation (Melnyk & Fineout-Overholt, 2015). The first task was to complete manual chart reviews for patients transferred to other facilities in July 2017 and January 2018 to identify the reason for the transfer. These months were chosen based on the seasonal influence of visits to the ED. Every other patient's record was reviewed by the project leader. A total of 249 charts were examined. The amount of time to complete the manual chart review was recorded. Additional demographic, clinical and ED throughput data were collected by using Clarity reporting tools through Epic. One of the clinical data elements collected was the Emergency Severity Index (ESI) or acuity level. The ESI is used by the emergency department to categorize patients based on acuity and resource needs into five groups (Gilboy, Tanabe, Travers, &
Rosenau, 2011). Patients with an ESI 1 are considered most urgent to ESI 5 being less urgent (Gilboy, Tanabe, Travers, & Rosenau, 2011). (See Appendix D for data collection template).
Once the data were collected from the chart reviews, the list of reasons for transfer was reviewed with the stakeholders who agreed on a final list. The system analyst developed the SmartList and added it to the Epic test system. Documentation using the SmartList in the Epic test system (referred to as POC) was verified by the system analyst, ED champion, and project leader to make sure it functioned as expected by documenting on individual test patients in POC. This intervention could not be implemented in a pilot ED setting as recommended in the Iowa Model; therefore, performance was evaluated in the test system because once changes are made in the live Epic system (referred to as PRD), they are systemwide.
systemwide (Melnyk & Fineout-Overholt, 2015). Before implementing the change, the ED champion emailed the ED providers a PowerPoint presentation created by the project leader. (See Appendix E).
The SmartList was placed in PRD on December 19, 2018, at 0800. On December 21, 2018, the updated Daily ED Transfer Report was placed in PRD with data from the SmartList, and an explanation was provided to the WakeMed executive team. (See Appendix F). Phase 3: Post-Implementation
Once the SmartList and updated Daily ED Transfer Report were implemented, monitoring and evaluation continued. The data collection tool used in Phase 2 was used to gather patient information. (Appendix D). Patient data were collected from December 19, 2018, at 0800 until March 2, 2019, at 2359, for a total of 557 patients. If the primary reason for the transfer was not documented using the SmartList, a manual chart review was completed to obtain the reason.
Eight weeks after implementation, an email was sent to the WakeMed executive team members, who had been receiving the updated Daily ED Transfer Report, requesting their feedback on the report. The email included these questions: 1) What was your assessment of the previous format for providing the information needed? 2) What is your assessment of the current (new) format for providing the information needed? 3) Is there any additional information that needs to be added to the daily report to make the report more meaningful?
Please complete the survey as it relates to the new Reason for Transfer field added to the Transfer to (Non WakeMed Facility) disposition screen. Thank you in advance.
Select your appropriate role:
Attending Physician Fellow Nurse Practitioner Physician Assistant Resident 1. I expect this field to be used frequently.
Strongly Disagree Disagree Neutral Agree Strongly Agree 2. I found the field unnecessarily complex.
Strongly Disagree Disagree Neutral Agree Strongly Agree 3. I thought the field was easy to use.
Strongly Disagree Disagree Neutral Agree Strongly Agree
4. I think that I would need the support of a technical person to be able to use the new field for documenting reason for transfer in Epic.
Strongly Disagree Disagree Neutral Agree Strongly Agree 5. I found this field to be well designed.
Strongly Disagree Disagree Neutral Agree Strongly Agree 6. I thought there was too much inconsistency in this field.
Strongly Disagree Disagree Neutral Agree Strongly Agree 7. I would imagine most people would learn to use this field very quickly. Strongly Disagree Disagree Neutral Agree Strongly Agree 8. I found the field very cumbersome to use.
Strongly Disagree Disagree Neutral Agree Strongly Agree 9. I felt very confident using the field.
Strongly Disagree Disagree Neutral Agree Strongly Agree 10.I needed to learn a lot of things before I could get going with this field. Strongly Disagree Disagree Neutral Agree Strongly Agree
11.Are there any additional reasons for transfer to non WakeMed facilities that should be added to the list?
Free text box provided
Figure 1. System usability scale questionnaire. Source: Adapted from System Usability Scale (Brooke, 1986)
Study Outcomes
regarding the patients being transferred, and the amount of time required for manual chart reviews to abstract the reason for transfer before/after implementation of the project. Statistical Analysis
We used descriptive statistics to analyze data regarding pre- and post-implementation patient demographics and variables related to the ED visit, the amount of time required for manual chart reviews, and percent of compliance for documentation of the new transfer field. The tests included mean, median, minimum, maximum, standard deviation, frequencies, and percentages. IBM SPSS Statistic software program was used to calculate the descriptive
statistics for the ED patients. R project for statistical computing was used to determine statistical significance between pre and post implementation of patient demographics.
CHAPTER 3: RESULTS
Emergency Department Patient Demographics
To understand the population of patients being transferred out of the WakeMed system, demographics related to age, age range, gender, and acuity were collected. (Table 3). The pre- and post-implementation cohorts were overall very similar, and there was one statistically significant difference in the patient demographics, which was patient age. There was a difference of 5.01 years in the mean age of the patients.
Table 3
Emergency Department (ED) Patient Demographics
Demographic Pre-Implementation (n=249)
Post-Implementation (n=557)
P value Patient Age (years)
Mean 44.32 39.31 0.01*
Minimum 0 0
Maximum 104 105
n % n %
Age Range (years)
LT 18 44 17.7 126 22.6 0.10
18-30 43 17.3 110 19.7 0.40
31-40 33 13.3 70 12.6 0.79
41-50 23 9.2 58 10.4 0.60
51-60 34 13.7 81 14.5 0.74
61-70 25 10.0 45 8.1 0.38
71-80 34 13.7 49 8.8 0.05
GT 80 13 5.2 18 3.2 0.21
Gender
Female 133 53.4 298 53.5 0.98
Male 116 46.6 259 46.5 0.98
Acuity
ESI 1 9 3.6 11 2.0 0.22
ESI 2 141 56.6 324 58.2 0.66
ESI 3 91 36.5 198 35.5 0.80
ESI 4 7 2.8 21 3.8 0.47
ESI 5 1 0.4 2 0.4 0.93
*P significant at <0.05
The top primary payors, the entity responsible for reimbursement of the ED visit, were Medicare and Medicaid. (Table 4). The majority of the top five chief complaints were
International Classification of Diseases, Tenth Revision codes (ICD-10) were behavioral health related as well. (Table 5).
Table 4
Emergency Department (ED) Payor
Pre-Implementation (n=249)
Post-Implementation (n=557)
n % n %
Top 5 Payors
Medicare 57 22.9 Medicaid 108 19.4
Medicaid 37 14.9 Medicare 105 18.9
Blue Cross Blue Shield 29 11.6 Blue Cross Blue Shield 78 14.0
Self-Pay 23 9.2 Self-Pay 40 7.2
Cigna Managed Care 17 6.8 United Healthcare Managed Care
Table 5
Emergency Department (ED) Chief Complaints and Primary ED Diagnosis
Pre-Implementation (n=249)
Post-Implementation (n=557)
n % n %
Top 5 Chief Complaints
Suicidal Thoughts 18 7.2 Suicidal Thoughts 63 11.3
Chest Pain, Non-Traumatic
17 6.8 Holly Hill - In Pt 44 7.9
Abdominal Pain 15 6.0 Abdominal Pain 34 6.1
Holly Hill - In Pt 12 4.8 Chest Pain, Non-Traumatic
31 5.6
Evaluation 8 3.2 Evaluation 22 3.9
Evaluation, Adult 8 3.2 Mental Health Evaluation 22 3.9
Mental Health Evaluation 8 3.2 Suicide Attempt 22 3.9
Shortness of Breath 8 3.2
Suicide Attempt 8 3.2
Top 5 Primary ED Diagnosis with ICD-10 Code
Suicidal ideation [R45.851]
21 8.4 Suicidal Ideation [R45.851]
77 13.8
Chest pain, unspecified type [R07.9]
13 5.2 Chest Pain, Unspecified Type [R07.9]
20 3.6
Depression, unspecified depression type [F32.9]
7 2.8 Suicide Attempt [T14.91XA]
13 2.3
Intentional drug overdose, initial encounter
[T50.902A]
7 2.8 Psychosis, Unspecified Psychosis Type [F29]
11 2.0
Psychosis, unspecified psychosis type [F29]
5 2.0 Depression, Unspecified Depression Type [F32.9]
9 1.6
Table 6
Emergency Department (ED) Throughput Times (All Times Minutes)
Pre-Implementation (n=249)
Post-Implementation (n=557) Door to Triage
Median 10.00 9.00
Mean 12.96 11.53
Standard Deviation 12.71 25.62
Door to First Non-Waiting Room Bed
Median 5.00 5.00
Mean 13.69 12.03
Standard Deviation 23.18 45.85
Door to Provider
Median 18.00 18.00
Mean 42.89 31.64
Standard Deviation 66.18 45.85
Provider to First Disposition Selected
Median 185.00 134.50
Mean 252.95 159.13
Standard Deviation 376.37 109.49
Provider to Depart
Median 385.00 402.50
Mean 508.07 532.20
Standard Deviation 458.70 545.02
First Disposition Selected to Depart
Median 142.00 215.00
Mean 255.12 372.43
Standard Deviation 281.55 543.45
ED Length of Stay (LOS)
Median 418.00 435.00
Mean 550.96 562.92
Table 7
ED Throughput Calculation Definitions
1. Door to Triage: patient arrival to the ED until the start of triage process
2. Door to Room: patient arrival to the ED until the patient is placed in the first non-waiting room bed
3. Door to Provider: patient arrival to the ED until the first contact with an ED provider (physician, resident, physician assistant or nurse practitioner)
4. Provider to First Disposition: first contact with an ED provider until first disposition (where the patient will go after leaving the ED) is selected
5. Provider to Depart: first contact with an ED provider until the patient leaves the ED 6. First Disposition to Depart: first disposition selected until the patient leaves the ED 7. ED Length of Stay: patient arrival to the ED until the patient leaves the ED
Reason for Transfer
The primary top three reasons for transfer pre and post-implementation were behavioral health facility transfer, behavioral facility-return to facility as inpatient, and patient/family request transfer. (Table 8 and Table 9). It was noted with the reviews before and after
implementation that some of the patients were being transferred within the WakeMed system, yet the ED disposition of ”Transfer to Non-WakeMed facility” had been selected by the provider. A reminder was added to the survey email sent to the ED providers regarding selecting the
Table 8
Pre-Implementation Primary Reason for Transfer (n=249)
Reason n %
Behavioral Health Facility transfer 76 30.5
Behavioral Health Facility – return to facility as inpatient 34 13.7
Patient/Family request transfer 27 10.8
Cardiologist at transfer facility 19 7.6
Transfer to WM Facility 15 6.0
Prior surgery/care at transfer facility 13 5.2
Hematology/Oncology care needed 11 4.4
Current primary MD affiliated with transfer facility 9 3.6
UNC Burn Center transfer 9 3.6
Neuro interventionalist/Neurosurgery care needed 8 3.2
Recent hospital stay/care at transfer facility 6 2.4
Insurance requirement 5 2.0
Other-see documentation in notes for reason 4 1.6
Unable to determine with chart review 3 1.2
Ophthalmology care needed 3 1.2
Recommendation from WakeMed MD to transfer due to level of care needed
3 1.2
Dental surgery/service needed 2 0.8
Table 9
Post-Implementation Primary Reason for Transfer (n=557)
Reason n %
Behavioral Health Facility transfer 207 37.2
Behavioral Health Facility – return to facility as inpatient 77 13.8
Patient/Family request transfer 67 12.0
Prior surgery/care at transfer facility 36 6.5
Other-see documentation in notes for reason 33 5.9
Cardiologist at transfer facility 17 3.1
Current primary MD affiliated with transfer facility 17 3.1 Recommendation from WakeMed MD to transfer due to level of care
needed
17 3.1
UNC Burn Center transfer 17 3.1
Hematology/Oncology care needed 15 2.7
Insurance requirement 15 2.7
Transfer to WM Facility 11 2.0
Recent hospital stay/care at transfer facility 8 1.4
Neuro interventionalist/Neurosurgery care needed 6 1.1
Ophthalmology care needed 5 0.9
Admitted rather than transferred 3 0.5
Dental surgery/service needed 3 0.5
Rheumatology care needed 2 0.4
Manual Chart Review Time/Completion Compliance
At the start of this project, 249 charts were manually reviewed to retrieve the reason for the transfer. Reviews are the only true way to gather this information without making
Table 10
Manual Chart Review Times
Pre-Implementation (n=249)
Post-Implementation (n=65)
Mean seconds 75.02 70.11
Minimum seconds 15 22
Maximum seconds 248 345
Sum seconds 18679 4557
Total Hours 5.19 1.27
Figure 2. Percent of compliance for documentation of the primary reason for transfer all emergency departments combined.
System Usability Scale
Eight weeks after implementation, an email was sent to all ED providers by the ED champion with a link to complete a Qualtrics survey which contained a questionnaire regarding the provider's perception of the new field usability. The email was sent to a total of 179 ED providers currently practicing in the WakeMed emergency departments; this included 92 attending physicians, four nurse practitioners (NP), 49 physician assistants (PA) and 34 residents. Initially, 25 surveys were completed. An email reminder was sent ten days later to encourage participation, and a total of 67 questionnaires were completed for this project (37.43% return rate). The survey was completed by 51 attending physicians, one NP, 14 PAs, and one
79.2 85.5 92.5 78.9 89.1 91.1 96.2 87.9 90.2 87.8 86.2 87.88 100 70.0 80.0 90.0 100.0
1 2 3 4 5 6 7 8 9 10 11
Per ce n t o f Co m p lian ce Week
the Medical Doctor (MD) group (n=52). The nurse practitioner and physician assistants were combined to form the Advanced Practice Provider (APP) group (n=15).
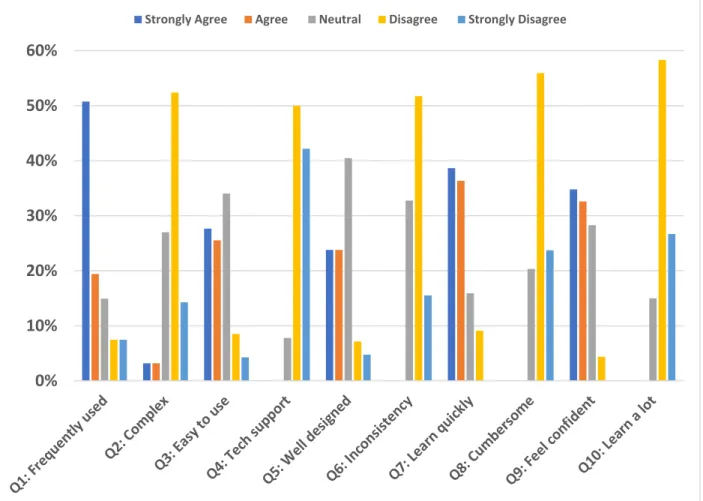
The system usability questionnaire contained ten questions with five-level Likert item responses ranging from strongly disagree to strongly agree. An additional free text question regarding suggestions for additional reasons was also on the questionnaire. Figure 3 displays all provider responses combined for each item.
Figure 3. System usability scale answers per question for all ED providers.
The SUS calculator was used to interpret the results of the system usability scale questionnaire. (Table 11). The scores for all providers, the MD group and APP group were analyzed. Two providers from the MD group were missing an answer to one question each (one
0% 10% 20% 30% 40% 50% 60%
for question 6 and one for question 10). The SUS calculator determines a substitute SUS score for these providers.
The mean SUS scores for all providers and the MD providers in this project were 71.8 and 73.0 respectively, which are higher than the average SUS of 68 in the industry. The APP group mean score was slightly lower than the US average at 67.8 (Sauro, 2011). Cronbach’s alpha was used to measure internal reliability; the goal was to have a value greater than 0.70, which is flagged as “Good” (Sauro, 2011). All three groups achieved this goal.
Two distinct factors have been identified in the SUS, usability and learnability (Sauro, 2011). Questions 4 and 10 are related to learnability, with the remaining questions related to usability (Sauro, 2011). As Sauro (2011) states the perception of usability (attitudes about efficiency, effectiveness, and overall construct about usability) can be more important than actual usability. Based on research by Lewis and Sauro (2009), there is a correlation between usability and learnability, as usability declines the value for learnability declines as well. The mean usability and learnability scores for this project demonstrated the same correlation. In previous studies, the value for learnability was greater than usability, which is reflected in the results for this project (Lewis & Sauro, 2009).
Conversion of the raw SUS scores to percentile ranks, tells us how usable the new
The confidence intervals around the SUS score tell us how much we can expect the population mean to differ from the sample mean (Sauro, 2011). For all providers, we can be 95.0% confident the population score is between 67.83 and 75.71, as well as 97.5% confident the population mean SUS score is above 67.83. For the MD group, we can be 95.0% confident the population score is between 68.17 and 77.73, and 97.5% confident the population mean SUS score is above 68.17. For APP group providers, we can be 95.0% confident the population score is between 61.13 and 74.53, as well as 97.5% confident the population mean SUS score is above 61.13.
Table 11
System Usability Scale (SUS) Interpretation
All Providers
MD Group APP Group SUS Scoring
Mean (Raw) SUS Score 71.8 73.0 67.8
Standard Deviation SUS Score 15.9 16.8 12.1
Number of Non-Blank SUS Score 65 50 15
Cronbach’s Alpha SUS Score 0.9 0.9 0.9
Internal Reliability SUS Score Good Good Good
Mean Usability Score 69.7 70.9 65.6
Mean Learnability Score 80.3 81.4 76.7
Converting Raw SUS Scale to Percentile Rank
Percentile Rank 62.5% 66.5% 49.4%
Adjective Good Good OK
Grade (Bangor) C C D
Grade (Sauro and Lewis) C+ B- C
Acceptability Acceptable Acceptable Marginal
SUS Benchmark All Products All Products All Products
Confidence Interval Around Raw SUS Data
Confidence Interval Low 67.8 68.2 61.1
Confidence High 75.7 77.7 74.5
Margin of Error 3.9 4.8 6.7
Comparing SUS Scores for MD Group (Sample 1; n=50) and APP Group (Sample 2; n=15)
Observed Difference (Sample 2-1) 5.12
Sample 1=Sample 2 (p-value) 0.20
Sample 1 > Sample 2 (p-value) 0.14
Sample 1 < Sample 2 (p-value) 0.86
Confidence Interval Around Difference Low -4.42
Confidence Interval Around Difference High 14.66
Feedback from the Executive Team
Table 12
Leadership Feedback Regarding New Report
Position Feedback
Physician Leader “In the first format, we struggled to determine payer status and its potential for impact on the choice to transfer and beyond that, we any clinical indications or even patient choice were unclear on the report. This then necessitated a time-consuming review in EPIC by the CMOs or Medical Directors of the ED to search for the reason for transfer. The new format provides that insurance status and the primary reason for transfer. It is a much more informative report and is time-saving. Of course, there are always nuances with a few cases which may necessitate a deeper dive into EPIC, but the number of times that now occurs has been markedly reduced.”
Physician Leader “In the original assessment there was notification the patient had been transferred but there was no indication as to why. We had to go to each record individually in Epic to analyze the reason for transfer. The current format gives us the answer as to why the patient was transferred and saves a tremendous amount of time and effort. At this time, I do not see that additional info is required.”
Nursing Leader “I honestly feel as though those reports are perfect. They look exactly like the ED logs which I am accustomed to looking at. Thanks again for all of your hard work.” Physician Leader “The report is very helpful and provides the information
CHAPTER 4: DISCUSSION
Adding a structured data field, known as a SmartList, for documenting the primary reason for the transfer made it possible to achieve electronic retrieval of these data so that more comprehensive information could be added to the updated Daily ED Transfer Report. Based on the feedback from the WakeMed executive team the quality of the daily transfer report
improved.
Having more comprehensive transfer information decreased the amount of time and effort needed to perform manual chart reviews. For example, if all the transfers to outside facilities reported for 2017 from WakeMed EDs, 2665 patients, required a manual chart review to obtain the transfer reason, this could take approximately 55.54 hours based on the mean of 75.02 seconds per chart. In contrast, based on the median completion rate of 87.88% for the reason of transfer being documented using the SmartList, only approximately 323 charts would need to be reviewed, which would be approximately 6.73 hours. Time saved would be 48.81 hours over one year.
The ability exists now to run reports for longer periods to categorize why patients are being transferred, which is especially useful when evaluating monthly, quarterly or yearly trends.
Based on the data collected, the surprising category was the number of patients
The addition of the SmartList to the workflow of the ED providers did not appear to have created an increased burden. This was evident in the results of the SUS questionnaire in which the mean scores for all providers combined showed acceptable usability. The ED providers’ perceptions regarding usability was an important factor in this project.
A recent change in insurance carrier negotiations regarding reimbursement, and in or out of network coverage for WakeMed, could have a more significant impact as the year progresses. This could be an important issue to follow with the updated Daily ED Transfer Report.
CHAPTER 5: LIMITATIONS AND FUTURE WORK
The first limitation of this project is the limited amount of time to collect patient data after implementation. The initial goal was to include 800-900 patients, but due to a delay in Institutional Review Board approval and deadlines, the actual number of patients was 557. On the updated Daily ED Transfer Report in the primary reason for the transfer field, extra words and partial words are displayed along with the reason. This is due to a limitation of how to “pull” the information from the Clarity database using Epic.
Ideally, a higher return rate of the SUS questionnaire from the ED providers was a goal. The ED champion sending a second email improved the number of responses. There was also a goal to have feedback from all the members of the executive team.
This project could be repeated in another healthcare system, but the system would need to initially investigate their primary reasons for transfer because more than likely will differ from WakeMed. There may be improved data tools available in other settings that could meet the reporting needs.
CHAPTER 6: CONCLUSIONS
The goal of this Doctor of Nursing (DNP) quality improvement project was to capture the primary reasons patients are being transferred to facilities outside of the WakeMed system using a structured data field with SmartList functionality in the EHR, while avoiding increased
workflow burden on the ED provider. This goal was achieved! The executive team reported the project had a positive impact on the quality of the reports and data available regarding patients transferred out of WakeMed EDs.
One reason this project was successful was involvement of key stakeholders. The Vice President of Nursing is a member of the executive team who receives the updated Daily ED Transfer Report and a valuable link to assist in obtaining feedback from the executive team. The Vice President of Clinical Operations for Wake Emergency Physicians is an ED attending
physician and current user of the EHR. He was a valuable link regarding distributing the education to the ED providers and asking/re-asking for completion of the SUS questionnaire. Having a strong working relationship with the systems analyst for ASAP facilitated
implementation of the new SmartList in a quick turnaround time once IRB approval was received.
The process chosen to implement was based on sustainability after the project was
Implications for future practice for WakeMed would be to continue to look for trends and services may be needed to keep patients from being transferred. Are there additional
negotiations with insurance carriers that need to take place?
APPENDIX B: PRISMA DIAGRAM
APPENDIX D: PROJECT DATA COLLECTION TOOL TEMPLATE
Patient Demographics (1) Participant ID
Number
Age at Time of Visit
Gender Acuity Arrival Mode Primary Payor ED Arrival Date/Time Participant 1 Participant … Participant 247
Patient Demographics (2) Participant ID Number ED Depart Date/Time Chief Complaint (1) Chief Complaint (2) ED Diagnosis (1) ED Diagnosis (2) ED Diagnosis (3) Participant 1 Participant … Participant 249
Patient Demographics (3) Participant ID Number ED Diagnosis (4) Receiving Facility Authorizing MD Reason for Transfer Chart Review Time Participant 1 Participant … Participant 249
ED Throughput Information Patient ID Number ED Arrival Time Triage Time First Non Waiting Room Bed Time First Doc/ Provider Time First Disposition Selection Time ED Departure Time Participant 1 Participant … Participant 249
REFERENCES
American Nurses Association (ANA). (2015). Nursing informatics: Scope and standards of practice (2nd Edition ed.). Silver Spring, Maryland: Nursebooks.org.
Amorosano, D. (2012). Unstructured data a common hurdle to achieving guidelines: Healthcare organizations are increasingly looking for solutions to transform paper-based processes into more efficient electronic workflows. Health Management Technology, 33(6), 28-29. Bailey, S. R., Heintzman, J. D., Marino, M., Hoopes, M. J., Hatch, B. A., Gold, R., Cowburn,
S.C., Nelson, C.A., Angier, H.E., DeVoe, J. E. (2016). Measuring preventive care delivery: Comparing rates across three data sources. American Journal of Preventive Medicine (AM J PREV MED), Nov2016.
doi:http://dx.doi.org.libproxy.lib.unc.edu/10.1016/j.amepre.2016.07.004
Biron, P., Metzger, M. H., Pezet, C., Sebban, C., Barthuet, E., & Durand, T. (2014). An information retrieval system for computerized patient records in the context of a daily hospital practice: The example of the Leon Berard Cancer Center (France). Applied Clinical Informatics, 5(1), 191-205. doi:10.4338/aci-2013-08-cr-0065. eCollection 2014. Brooke, J. (1986). System usability scale (SUS): A quick-and-dirty method of system evaluation
user information. Reading, UK: Digital Equipment Co Ltd.
Brown, C. G. (2014). The Iowa model of evidence-based practice to promote quality care: An illustrated example in oncology nursing. Clinical Journal of Oncology Nursing,18(2), 157-159. doi:10.1188/14.cjon.157-159
Capurro, D., Yetisgen, M., van Eaton, E., Black, R., & Tarczy-Hornoch, P. (2014). Availability of structured and unstructured clinical data for comparative effectiveness research and quality improvement: A multisite assessment. Generating Evidence & Methods to improve patient outcomes (EGEMS), 2(1), 1079. doi:10.13063/2327-9214.1079
Centers for Disease Control and Prevention (CDC). (2017, 5/3/2017). National Center for Health Statistics-Emergency Department Visits. Retrieved from
https://www.cdc.gov/nchs/fastats/emergency-department.htm
Eden, A., Grach, M., Goldik, Z., Shnaider, I., Lazarovici, H., Barnett-Griness, O., Perel, A., Pizov, R. (2006). The implementation of an anesthesia information management system.
European Journal of Anaesthesiology, 23(10), 882-889. doi:10.1017/s0265021506000834. Epub 2006 Jun 19.
Friedman, C., Rindflesch, T. C., & Corn, M. (2013). Natural language processing: state of the art and prospects for significant progress, a workshop sponsored by the National Library of Medicine. Journal of Biomedical Informatics, 46(5), 765-773.
Ganz, D. A., Almeida, S., Roth, C. P., Reuben, D. B., & Wenger, N. S. (2012). Can structured data fields accurately measure quality of care? The example of falls. Journal of
Rehabilitation Research and Development, 49(9), 1411-1420.
Gardner, W., Morton, S., Byron, S. C., Tinoco, A., Canan, B. D., Leonhart, K., Kong, V., & Scholle, S. H. (2014). Using computer-extracted data from electronic health records to measure the quality of adolescent well-care. Health Services Research (HEALTH SERV RES), Aug2014. doi:http://dx.doi.org.libproxy.lib.unc.edu/10.1111/1475-6773.12159 Gilboy, N., Tanabe, P., Travers, D., & Rosenau, A. (2011). Emergency severity index (ESI): A
triage tool for emergency department care, Version 4. Implementation handbook 2012 edition. Rockville, MD: Agency for Healthcare Research and Quality.
Gimbel, R. W., Olsen, C. H., Williams, P. M., & Stephens, M. B. (2012). Social marketing and student documentation of asthma care: A quasi-randomized controlled trial. Family Medicine, 44(2), 121-127.
Goebel, J. R., Ahluwalia, S. C., Chong, K., Shreve, S. T., Goldzweig, C. L., Austin, C., Asch, S. M., & Lorenz, K. A. (2014). Developing an informatics tool to advance supportive care: The veterans health care administration palliative care national clinical template. Journal of Palliative Medicine, 17(3), 266-273. doi:10.1089/jpm.2013.0288. Epub 2014 Feb 18. Haberman, S., Rotas, M., Perlman, K., & Feldman, J. G. (2007). Variations in compliance with
documentation using computerized obstetric records. Obstetrics Gynecology, 110(1), 141-145. doi:10.1097/01.AOG.0000269049.36759.fb
Hanauer, D. A., Mei, Q., Law, J., Khanna, R., & Zheng, K. (2015). Supporting information retrieval from electronic health records: A report of university of Michigan's nine-year experience in developing and using the electronic medical record search engine (EMERSE). Journal of Biomedical Informatics, 55, 290-300.
doi:10.1016/j.jbi.2015.05.003. Epub 2015 May 13.
Hazlehurst, B., McBurnie, M. A., Mularski, R. A., Puro, J. E., & Chauvie, S. L. (2012).
Automating Care Quality Measurement With Health Information Technology. American Journal of Managed Care (AM J MANAGE CARE), Jun2012.
Holly Hill Hospital. (n.d). Retrieved from https://hollyhillhospital.com/
Hripcsak, G., Friedman, C., Alderson, P. O., DuMouchel, W., Johnson, S. B., & Clayton, P. D. (1995). Unlocking clinical data from narrative reports: a study of natural language processing. Annals of Internal Medicine, 122(9), 681-688.
Hu, Z., Melton, G. B., Moeller, N. D., Arsoniadis, E. G., Wang, Y., Kwaan, M. R., Jensen, E.H., Simon, G. J. (2016). Accelerating chart review using automated methods on electronic health record data for postoperative complications. AMIA Annual Symposium
Hyun, S., Johnson, S. B., & Bakken, S. (2009). Exploring the ability of natural language processing to extract data from nursing narratives. CIN: Computers, Informatics, Nursing, 27(4), 215-225. doi:10.1097/NCN.0b013e3181a91b58
Institute for Healthcare Improvement (IHI). (2018). Science of improvement: Testing changes. Retrieved from
http://www.ihi.org/resources/Pages/HowtoImprove/ScienceofImprovementTestingChang es.aspx
James, E. (2017). Results Spreadsheet Jan 2017-Dec 2017 [Data file].
Kaufman, D. R., Sheehan, B., Stetson, P., Bhatt, A. R., Field, A. I., Patel, C., & Maisel, J. M. (2016). Natural language processing-enabled and conventional data capture methods for input to electronic health records: A comparative usability study. JMIR Medical
Informatics, 4(4), e35. doi:10.2196/medinform.5544
Lewis, J. R., & Sauro, J. (2009). The factor structure of the system usability scale. Presented at the International Conference (HCII 2009), San Diego, CA, USA.
Li, J., Pryor, S., Choi, B., Rees, C. A., Senthil, M. V., Tsarouhas, N., Myers, S.R., Monuleaux, M.C., Bachur, R. G. (2016). Profile of interfacility emergency department transfers: transferring medical providers and reasons for transfer. Pediatric Emergency Care. doi:10.1097/pec.0000000000000848
Martin, S., Wagner, J., Lupulescu-Mann, N., Ramsey, K., Cohen, A., Graven, P., Weiskopf, N.G., Dorr, D. A. (2017). Comparison of EHR-based diagnosis documentation locations to a gold standard for risk stratification in patients with multiple chronic conditions.
Applied Clinical Informatics, 8(3), 794-809. doi:10.4338/aci-2016-12-ra-0210
Matney, S., Brewster, P. J., Sward, K. A., Cloyes, K. G., & Staggers, N. (2011). Philosophical approaches to the nursing informatics data-information-knowledge-wisdom framework. Advances in Nursing Science, 34(1), 6-18. doi:10.1097/ANS.0b013e3182071813 McGonigle, D., Hunter, K., Sipes, C., & Hebda, T. (2014). Why nurses need to understand
nursing informatics. AORN Journal, 100(3), 324-327. doi:10.1016/j.aorn.2014.06.012 McGonigle, D., & Mastrian, K. (2018). Nursing informatics and the foundation of knowledge
(4th ed.). Burlington, MA: Jones and Bartlett Learning.
Melnyk, B., & Fineout-Overholt, E. (2015). Evidence-based practice in nursing & healthcare: A guide to best practice (3rd ed.). Philadelphia: Wolters Kluwer/Lippincott Williams & Wilkins.
Murphy, K. (2013, 2/4/2013). Value of structured data to interoperability, meaningful use. EHR Intelligence. Retrieved from http://ehrintelligence.com/2013/02/04/value-of-structured-data-to-interoperability-meaningful-use/
Neri, P. M., Volk, L. A., Samaha, S., Pollard, S. E., Williams, D. H., Fiskio, J. M., Burdick, E., Edwards, S.T., Ramelson, H., Schiff, G.D., Bates, D. W. (2014). Relationship between documentation method and quality of chronic disease visit notes. Applied Clinical Informatics, 5(2), 480-490. doi:10.4338/aci-2014-01-ra-0007. eCollection 2014. The Office of the National Coordinator for Health Information Technology Office of the
Secretary (ONC). (2016). 2016 report to congress on health IT progress: Examining the HITECH era and the future of health IT. Retrieved from
https://dashboard.healthit.gov/report-to-congress/2016-report-congress-examining-hitech-era-future-health-information-technology.php.
Ronquillo, C., Currie, L. M., & Rodney, P. (2016). The Evolution of
Data-Information-Knowledge-Wisdom in Nursing Informatics. Advances in Nursing Science, 39(1), E1-18. doi:10.1097/ans.0000000000000107
Rosenbloom, S. T., Denny, J. C., Xu, H., Lorenzi, N., Stead, W. W., & Johnson, K. B. (2011). Data from clinical notes: a perspective on the tension between structure and flexible documentation. Journal of the American Medical Informatics Association: JAMIA, 18(2), 181-186. doi:10.1136/jamia.2010.007237
Rouse, M. (2010). Meaningful Use. Retrieved from
http://searchhealthit.techtarget.com/definition/meaningful-use
Rouse, M. (2017, 11/28/2017). Electronic Health Record (EHR). Retrieved from http://searchhealthit.techtarget.com/definition/electronic-health-record-EHR
Rouse, M. (2018). HITECH (Health Information Technology for Economic and Clinical Health) Act of 2009. Retrieved from http://searchhealthit.techtarget.com/definition/HITECH-Act Sauro, J. (2011). A practical guide to the system usability scale: Background, benchmarks & best
practices. In. Retrieved from https://measuringu.com/product/suspack/
Tamang, S., Patel, M. I., Blayney, D. W., Kuznetsov, J., Finlayson, S. G., Vetteth, Y., & Shah, N. (2015). Detecting unplanned care from clinician notes in electronic health records.
Journal of Oncology Practice, 11(3), e313-319. doi:10.1200/JOP.2014.002741 Topaz, M. (2013). The hitchhiker's guide to nursing informatics theory: Using the
data-knowledge-information-wisdom framework to guide informatics research. Online Journal of Nursing Informatics (ONLINE J NURS INFORM), Fall2013.
program: Manual review versus data from structured fields in electronic health records.
Medical Care, 53(10), 901-907. doi:10.1097/MLR.0000000000000418 WakeMed Health and Hospitals (2018). WakeMed: About us. Retrieved from
https://www.wakemed.org/about-wakemed
Wells, B. J., Chagin, K. M., Nowacki, A. S., & Kattan, M. W. (2013). Strategies for handling missing data in electronic health record derived data. Generating Evidence & Methods to improve patient outcomes (EGEMS), 1(3), 1035. doi:10.13063/2327-9214.1035
Wu, S. T., Sohn, S., Ravikumar, K. E., Wagholikar, K., Jonnalagadda, S. R., Liu, H., & Juhn, Y. J. (2013). Automated chart review for asthma cohort identification using natural language processing: an exploratory study. Annals of Allergy, Asthma & Immunology (ANN
ALLERGY ASTHMA IMMUNOL), Nov2013.