Yanan Li. Multi-aspect Sentiment Analysis for Car Reviews by Modeling Aspects and Overall Ratings. A Master’s Paper for the M.S. in I.S degree. December, 2019. 60 pages. Advisor: Stephanie W. Haas
In this paper, I compare the impact of sentiment score of review text, overall rating and chunk parsing on aspect rating prediction. The best outcome is achieved when using chunk parsing to divide sentences describing more than one aspect into specific chunks, then take sentiment score of those chunks and sentences depicting one aspect as input, with addition of the overall rating.
Headings:
Natural language processing Rating prediction
MULTI-ASPECT SENTIMENT ANALYSIS FOR CAR REVIEWS BY MODELING ASPECTS AND OVERALL RATINGS
by Yanan Li
A Master’s paper submitted to the faculty of the School of Information and Library Science of the University of North Carolina at Chapel Hill
in partial fulfillment of the requirements for the degree of Master of Science in
Information Science.
Chapel Hill, North Carolina December 2019
Approved by
Table of Contents
1 INTRODUCTION ... 2
2 LITERATURE REVIEW ... 5
2.1 Multi-Aspect Sentiment Analysis ... 5
2.2 Aspect-Based Sentiment Classification ... 12
2.3 Document-Level Sentiment Classification ... 15
2.4 Document-level Multi-aspect Sentiment Classification ... 19
2.5 Summary of Literature Review ... 20
3 DATA ... 22
3.1 Data Set and Preprocessing ... 22
3.2 Observation ... 26
4 METHODS ... 33
4.1 Mapping Aspect to Sentence ... 33
4.2 Sentiment Analysis of Sentences ... 34
4.3 Aspect Rating Prediction with Text Feature ... 34
4.4 Aspect Rating Prediction with Overall Rating Feature and Text Feature ... 35
4.5 Aspect Rating Prediction with Chunk Parsing ... 36
5 RESULTS AND DISCUSSION ... 39
5.1 MSE with Various Overall Rating Weight (Without Chunk Parsing) ... 40
5.2 MSE with Various Overall Rating Weight (With Chunk Parsing) ... 42
5.3 Over-Prediction and Under-Prediction ... 44
5.4 Aspect-Based MSE Summarization ... 49
6 CONCLUSIONS ... 55
1 INTRODUCTION
Customers’ way of making purchase decisions has been continually influenced, as the popularity of online reviews has grown. A study1 about “how online reviews influence sales” conducted in 2017 by Spiegel Research Center in Northwestern University presents that nearly 95% people read online reviews before making a purchase. In addition to the apparent fact that reviews offer valuable information for potential
customers, they also are effective channels for businesses to understand customers’ needs better. According to the study, customers are more willing to buy a product when reviews are available, and reviews have a greater impact on purchase probability for higher-priced items than on cheaper ones. Cars are typical high-priced items and cars reviews from TrueCar2 are used in this paper for analyzing.
TrueCar is a digital automotive marketplace, which operates its own site and powers car-buying programs for over 500 companies. TrueCar has a network of over 14,000
Certified Dealers and currently, over one third of all new car buyers engage with the TrueCar network during their purchasing process. A TrueCar user can share his or her
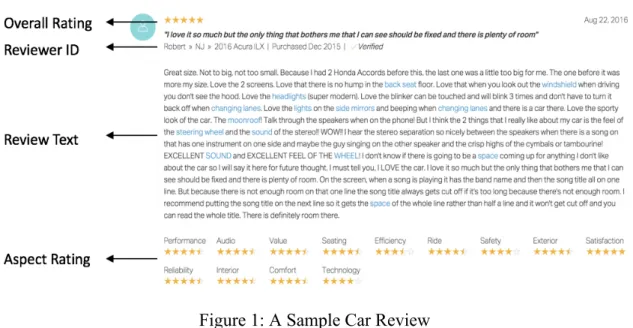
experience with a car by posting a review of the model, an overall rating and aspects ratings (car aspects, meaning the features of a car). Common car aspects include:
technology, reliability, efficiency, etc. Consider a typical car review, as shown in Figure 1. This review shows multiple aspects of the car, such as Audio, Interior and Technology. The reviewer gives an overall rating as well as an explicit rating on each aspect. Thus, a user would be able to easily know the reviewer’s opinion on each aspect.
Figure 1: A Sample Car Review
(Qu et al., 2010) proved that ratings are more informative than polarity expressed through review texts based on experiments on three target domains of Amazon reviews: books, movies (DVDs), and music (CDs), using a novel kind of “bag-of-opinions”
document, since different reviewers may give the same overall rating for very different reasons. For example, in a car review, one reviewer may like the audio feature of a vehicle, but another individual may have enjoyed the technology. Thus, the same overall rating could represent satisfaction (and dissatisfaction) on very different aspects. To help users tell the difference, it is necessary to understand a reviewer’s rating on each aspect. Not only could the analysis of these aspect ratings benefit mining interested aspects for users, but it could also help manufacturers improve specific features of their services and products. Therefore, such analysis can be very beneficial in predicting ratings, for
different aspects in a review. However, in some instances, there is a mismatch between the review and the rating (Shrestha & Nasoz, 2019). Therefore, analysis of review text is valuable to understand customers’ opinions.
2 LITERATURE REVIEW
2.1 Multi-Aspect Sentiment Analysis
Research Features Model Dataset (Size) Lu et al.,
(2011) text representation Support vector regression model Three datasets: two restaurant review datasets from OpenTable (73,495) and CitySearch.com (652)
respectively, one hotel review dataset from TripAdvisor (66,512)
McAuley et al., (2012)
text
representation Preference and Attribute Learning from Labeled
Groundtruth and Explicit Ratings (PALE LAGER)
Five datasets: two beer review datasets from BeerAdvocate (1,586,259) and Ratebeer (2,924,127) respectively, pubs review dataset from
BeerAdvocate (18,350) Toys & Games review from Amazon (373,974)
Audio Books review from Audible (10,989) Titov and McDonald (2008) text representation Multi-Aspect Sentiment model (MAS)
One dataset: hotel review dataset from TripAdvisor (10,000) Wang et al., (2010) text representation Latent Rating Regression (LRR) model
One dataset: hotels review dataset from TripAdvisor (108,891)
Wang et
al., (2011) text representation Latent Aspect Rating Analysis Model (LARAM)
Two datasets:
hotels review dataset from TripAdvisor (37,181) MP3 reviews from amazon (16,680) Diao et al., (2014) text representation Jointly modeling aspects, ratings and sentiments
(JMARS)
One dataset: movies review dataset from IMDB (348,415)
Pappas and Popescu-Belis, (2014)
text
representation APWeights: a multiple-instance regression model
Seven datasets: three beer review datasets from
BeerAdvocate and RateBeer one audiobooks review dataset
one Toys and Games review dataset
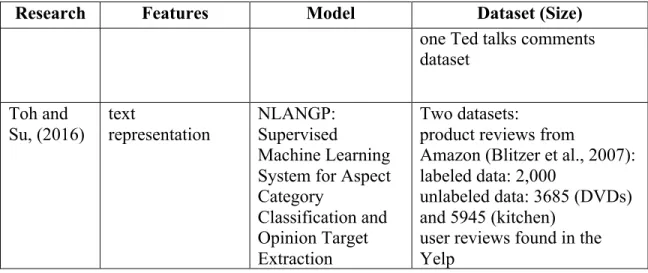
Research Features Model Dataset (Size) one Ted talks comments dataset Toh and Su, (2016) text representation NLANGP: Supervised Machine Learning System for Aspect Category
Classification and Opinion Target Extraction
Two datasets:
product reviews from
Amazon (Blitzer et al., 2007): labeled data: 2,000
unlabeled data: 3685 (DVDs) and 5945 (kitchen)
user reviews found in the Yelp
Table 1: Feature, model and datasets for Multi-Aspect Sentiment Analysis
Research Evaluation Metric Baseline Methods Lu et al.,
(2011) Accuracy Precision Recall F1 score LDA
Local LDA (Brody et al., 2010) MultiGrain Lda (Titov et al.2008) Segmented Topic Models (STM) (Du et al.2010)
McAuley et al., (2012)
Accuracy
Mean Squared Error (MSE) LDA SVM Titov and McDonald (2008) Precision Recall
Logistic Regression models
Wang et
al., (2010) Mean Squared Error (MSE) Correlation
Mean Average Precision (MAP)
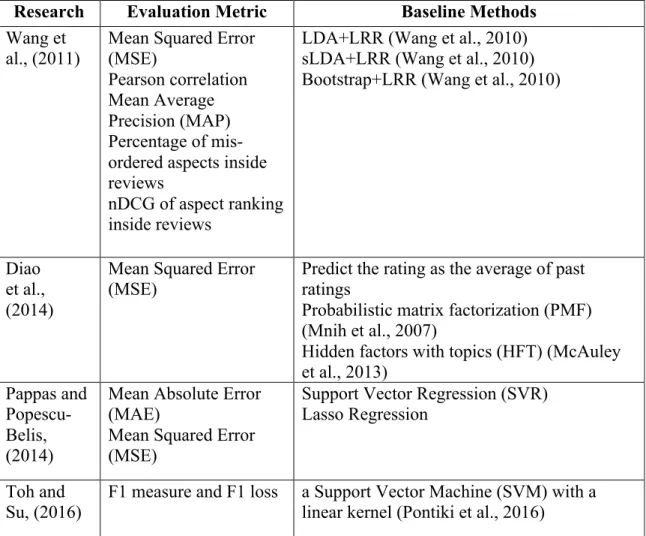
Research Evaluation Metric Baseline Methods Wang et
al., (2011) Mean Squared Error (MSE) Pearson correlation Mean Average Precision (MAP) Percentage of mis-ordered aspects inside reviews
nDCG of aspect ranking inside reviews
LDA+LRR (Wang et al., 2010) sLDA+LRR (Wang et al., 2010) Bootstrap+LRR (Wang et al., 2010)
Diao et al., (2014)
Mean Squared Error
(MSE) Predict the rating as the average of past ratings Probabilistic matrix factorization (PMF) (Mnih et al., 2007)
Hidden factors with topics (HFT) (McAuley et al., 2013)
Pappas and Popescu-Belis, (2014)
Mean Absolute Error (MAE)
Mean Squared Error (MSE)
Support Vector Regression (SVR) Lasso Regression
Toh and
Su, (2016) F1 measure and F1 loss a Support Vector Machine (SVM) with a linear kernel (Pontiki et al., 2016) Table 2: Evaluation metric and baseline methods for Multi-Aspect Sentiment Analysis
(Lu et al., 2011) assumed that aspects are fixed, and that it is sufficient to identify a single aspect for each sentence in a document. To identify aspects, they evaluated weakly
supervised topic models, then used minimal prior knowledge in the form of seed words to encourage a correspondence between topics and ratable aspects, and labeled each
PALE LAGER (McAuley et al., 2012) is a model that combine aspects, and ratings on aspects, as a function of the words that appear in each sentence of a review. Since each aspect uses different sentiment words, it is beneficial to learn sentiment models per aspect (Fahrni & Klenner, 2008). However, it is also necessary to explicitly model relationships between aspects. For example, based on the dataset from BeerAdvocate, the word
“skunky” was among the strongest 1-star predictors for all aspects, even though the word clearly refers only to smell. Unsurprisingly, a product that smells “skunky” is unlikely to be rated favorably in terms of its taste. Therefore, a dependency term representing correlation of aspects was added in final multi-class SVM objective (McAuley et al., 2012) to acknowledge the correlation between aspects. And this model is able to “disentangle” content and sentiment words: content words that are indicative of a particular aspect as well as the aspect-specific sentiment words that are indicative of a particular rating are automatically learned. For example, when a beer is described as having “stale hops, but a velvety body”, the model is supposed to learn that “body” refers to palate, and “stale” and “velvety” refer to negative and positive sentiments about those aspects.
(Titov and McDonald 2008) used topic-models to identify “topics” whose words are highly correlated with the aspects on which users vote. They applied their model to assign aspect labels to sentences in a review. Their MAS model consists of two parts. The first part is based on Multi-Grain Latent Dirichlet Allocation ((MG-LDA) (Titov and McDonald, 2008), which has been previously shown to build topics that are
representative of ratable aspects. The second part is a set of sentiment predictors per aspect that are designed to force specific topics in the model to be directly correlated with a particular aspect.
(Wang et al., 2010) introduced a two-stage approach to analyze opinions expressed about an entity in an online review at the level of topical aspects. In the first stage, they
employed a bootstrapping-based algorithm to identify the major aspects (guided by a few seed words describing the aspects) and segment reviews into aspects. In the second stage, a generative Latent Rating Regression (LRR) model was proposed which aims at
inferring aspect ratings and weights for each individual review based only on the review text and the associated overall rating. Wang et al., (2011) presented Latent Aspect Rating Analysis Model (LARAM), which extends LRR to perform both aspect segmentation and aspect rating prediction in a unified framework.
special effects, but only if the user is interested in them and if the movie has special effects worth discussing. The model is able to capture the sentiment in each aspect of a review, and predict partial scores under different aspects. In addition, the user interests and movie topics can also be inferred from the model. The model also provides a link between interest and relevance on a per-aspect basis and it allows to differentiate between positive and negative sentiments on a per-aspect basis.
(Pappas and Popescu-Belis 2014) treated each review text as a bag of sentences
(instances) and each sentence is modeled as a word vector. For learning from texts with known aspect ratings, the model performs multiple instance regression and assigns importance weights to each of the sentences or paragraphs of a text, uncovering their contribution to the aspect ratings.
In summary, methods in this section of multi-aspect sentiment analysis share the same assumptions about words and sentences, for example, using the word syntax to determine whether a word serves for aspect or sentiment, or relating a specific aspect to a sentence, such as identifying a single aspect for each sentence in a document.
2.2 Aspect-Based Sentiment Classification
Another related research area is aspect-based sentiment classification. Earlier studies treated aspect extraction and sentiment analysis as separate phases. They first extracted aspect expressions from sentences (Pontiki et al., 2014), and then determined sentiments. For instance, in the sentence “This camera is sleek and very affordable”, “sleek” and “affordable” are aspect expressions since the word “sleek” refers to the appearance of the camera and the word “affordable” to its price. Feature, model and datasets used by
researches of aspect-based sentiment classification are illustrated in Table 3. Evaluation metric and baseline methods are displayed in Table 4.
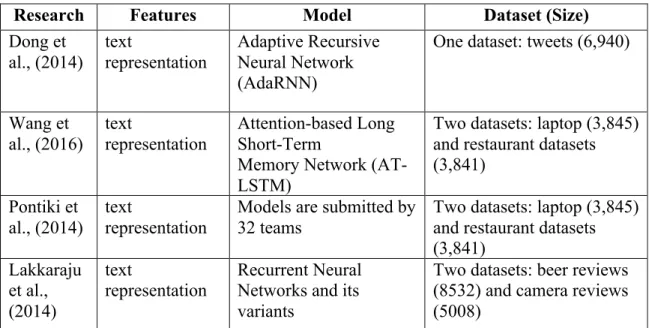
Research Features Model Dataset (Size)
Dong et al., (2014) text representation Adaptive Recursive Neural Network (AdaRNN)
One dataset: tweets (6,940)
Wang et al., (2016) text representation Attention-based Long Short-Term
Memory Network (AT-LSTM)
Two datasets: laptop (3,845) and restaurant datasets (3,841)
Pontiki et al., (2014)
text
representation
Models are submitted by 32 teams
Two datasets: laptop (3,845) and restaurant datasets (3,841)
Lakkaraju et al., (2014)
text
representation Recurrent Neural Networks and its variants
Two datasets: beer reviews (8532) and camera reviews (5008)
Research Evaluation Metric Baseline Methods Dong et al.,
(2014) Accuracy Macro-average F1-score
SVM-independent features SVM-dependent features
SVM-converted dependency tree RNN
Wang et
al., (2016) Accuracy LSTM Target-Dependent LSTM (TD-LSTM) and Target-Connection LSTM (TC-LSTM) (Tang et al., 2015a)
Pontiki et al., (2014)
F1 measure Majority
Lakkaraju et al., (2014)
Accuracy FACTS (FACeT and Sentiment extraction model) and CFACTS (Coherence based FACeT and Sentiment extraction model)
Multi-class Support Vector Machines Naive Bayes classifiers with tf-idf vectors of words as features
Table 4: Evaluation metric and baseline methods for Aspect-Based Sentiment Classification
(Lakkaraju et al., 2014) employed recurrent neural networks and its variants for the task of extraction of aspect sentiment pair. Their approach did not treat aspect extraction and sentiment analysis as separate phases or enforce explicit modeling assumptions on how these two phases should overlap and interact.
(Pontiki et al., 2014) conducted SemEval-2014 Task4 aiming to foster research in the field of aspect-based sentiment analysis, where the goal is to identify the aspects of given target entities and the sentiment expressed for each aspect. There are four subtasks in this research, including aspect term extraction (SB1), aspect term polarity (SB2), aspect category detection (SB3) and aspect category polarity (SB4). For SB1 and SB2,
review sentences, SB1 and SB2 ask to identify all aspect terms present in each sentence (e.g., “wine”, “waiter”, “appetizer”, “price”) and determine the polarity of each aspect term (positive, negative, conflict or neutral). For SB3 and SB4, a predefined set of aspect categories (e.g., PRICE, FOOD) are given, and the task is to identify the aspect
categories discussed in each sentence and determine the polarity. The result shows that analysis systems would perform better if set of aspect categories are predefined.
(Dong et al., 2014) focused on integrating target information with Recursive Neural Network (RNN) to leverage the ability of deep learning models. Target is the entity in a sentence, for example, the tweet “@ballmer: windows phone is better than ios!” has three targets (@ballmer, windows phone, and ios). The user expresses neutral, positive, and negative sentiments for them, respectively.
(Wang et al., 2016) proposed attention-based Long Short-Term memory for aspect-level sentiment classification. The models are able to attend different parts of a sentence when different aspects are concerned. For example, the sentiment polarity of “Staffs are not that friendly, but the taste covers all.” will be positive if the aspect is food but negative when considering the aspect service.
2.3 Document-Level Sentiment Classification
Another related research field is document-level sentiment classification (Tang et al., 2015b; Chen et al., 2016; Tang et al., 2016; Yang et al., 2016) because single aspect sentiment classification can be treated as an individual document classification task, which assumes that each document expresses a sentiment of each aspect in turn on a single product and targets. To illustrate, given a document with 3 aspects with 3 different ratings, this document will be represented 3 times in the dataset, once for each aspect. Feature, model and datasets used by researches of document-level sentiment
classification are illustrated in Table 5. Evaluation metric and baseline methods are displayed in Table 6.
Research Features Model Dataset (Size)
Tang et al., (2016)
text
representation
Deep memory network approach for aspect level sentiment classification
Two datasets: laptop (3,845) and restaurant datasets (3,841) Tang et al., (2015b) representations of individual preferences of users, overall qualities of products and review texts
User Product Neural Network (UPNN)
Three datasets derived from IMDB and Yelp Dataset Challenge IMDB (84,919) Yelp 2014 (231,163) Yelp 2013(78,966) Chen et al., (2016) representations of individual preferences of users, overall qualities of products and review texts
A hierarchical LSTM model
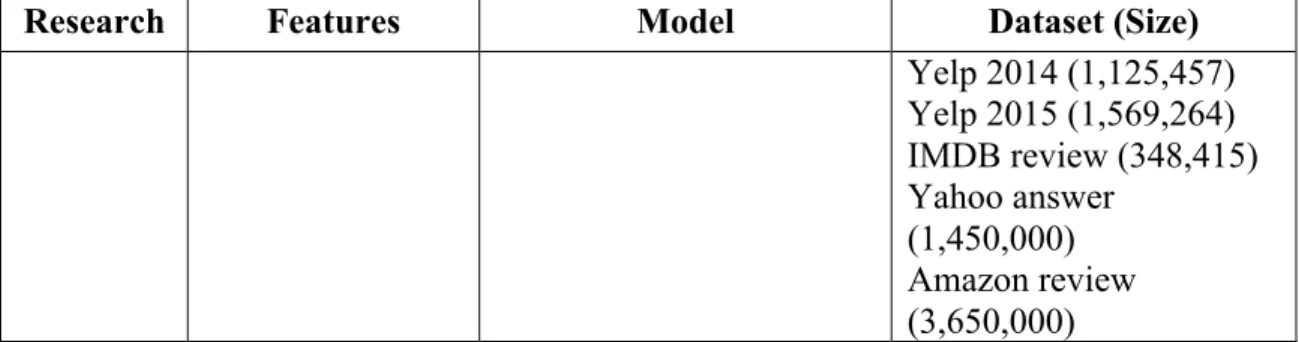
Three datasets derived from IMDB and Yelp Dataset Challenge IMDB (84,919) Yelp 2014 (231,163) Yelp 2013(78,966) Yang et al., (2016) text representation Hierarchical Attention Network (HAN)
Research Features Model Dataset (Size) Yelp 2014 (1,125,457) Yelp 2015 (1,569,264) IMDB review (348,415) Yahoo answer
(1,450,000) Amazon review (3,650,000)
Table 5: Feature, model and datasets for Document-Level Sentiment Classification
Research Evaluation Metric Baseline Methods Tang et al.,
(2016)
Accuracy Running speed
Majority is a basic baseline method, which assigns the majority sentiment label in training set to each instance in the test set.
feature-based SVM
LSTM and attention-based LSTM models (Tang et al.,2015a)
Tang et al., (2015b)
Accuracy MAE RMSE
Majority
Trigram (Fan et al., 2008)
TextFeature (Kiritchenko et al., 2014) AvgWordvec + SVM
sentiment-specific word embeddings (SSWE) + SVMg (Tang et al., 2014b)
Paragraph Vector (Le and Mikolov, 2014) Recursive Neural Tensor Network (RNTN) (Socher et al., 2013) + Recurrent Neural Network (RNN)
a state-of-the-art recommendation algorithm JMARS (Diao et al., 2014).
Chen et al., (2016)
Accuracy RMSE
Majority
Trigram (Fan et al., 2008)
TextFeature (Kiritchenko et al., 2014) AvgWordvec + SVM
sentiment-specific word embeddings (SSWE) + SVM(Tang et al., 2014b)
Paragraph Vector (Le and Mikolov, 2014) Recursive Neural Tensor Network (RNTN) (Socher et al., 2013) + Recurrent Neural Network (RNN)
Research Evaluation Metric Baseline Methods Yang et al.,
(2016) Accuracy A linear classifier based on multinomial logistic regression TextFeature (Kiritchenko et al., 2014)
AvgWordvec + SVM
sentiment-specific word embeddings (SSWE) + SVM (Tang et al., 2014b)
CNN-word (Kim, 2014) CNN-char (Zhang et al., 2015) LSTM
Conv-GRNN and LSTM-GRNN (Tang et al., 2015).
Table 6: Evaluation metric and baseline methods for Document-Level Sentiment Classification
(Tang et al., 2015b) and (Chen et al., 2016) considered the effect of individual
preferences of users and overall qualities of products toward the sentiment rating of a review. (Tang et al., 2015b) built a model dubbed UPNN. Users and products are encoded in continuous vector spaces. In continuous vector spaces, a numerical representation (e.g. the real numbers) of user preferences and product qualities is captured and these representations are further integrated with continuous text
representation in a unified neural framework for sentiment classification. And the output is the sentiment polarity label of a document. (Chen et al., 2016) built a hierarchical Long short-term memory (LSTM) model to generate sentence-level representation and
document-level representation jointly.
The studies in this section of document-level sentiment classification contain approaches which are based on neural networks in a hierarchical structure. However, they did not include multiple aspects.
2.4 Document-level Multi-aspect Sentiment Classification
An overview of multitask learning (Caruana, 1997) together with other researches (Collobert et al., 2011; Luong et al. 2016) shows that multitask learning can be used as straightforward approach for document-level multi-aspect sentiment classification. The following characterizations of multi-aspect learning is defined by (Caruana, 1997):
“Multitask Learning is an approach to inductive transfer that improves
generalization by using the domain information contained in the training signals of related tasks as an inductive bias. It does this by learning tasks in parallel while using a shared representation; what is learned for each task can help other tasks be learned better.”
is view?”. With these questions, they guess possible keywords for each aspect. After that, the person simply read the review, find those keywords, and examine comments.
2.5 Summary of Literature Review
To sum up, multi-aspect sentiment analysis uses the word syntax to determine whether a word serves for aspect or sentiment, or identifying a specific aspect for each sentence. Aspect-based sentiment classification extract aspect expressions from sentences, and then determine sentiments. Document-level sentiment classification assumes each document expresses a sentiment on a single product for each aspect, but it doesn’t include multi-aspects. With the introduction of multitask learning, there are researches focusing on mimicking human’s reaction when being asked to evaluate an aspect for a product.
3 DATA
In this section, I first introduce real-world dataset used in this paper and present some observations about the distribution of aspects rating and overall rating.
3.1 Data Set and Preprocessing
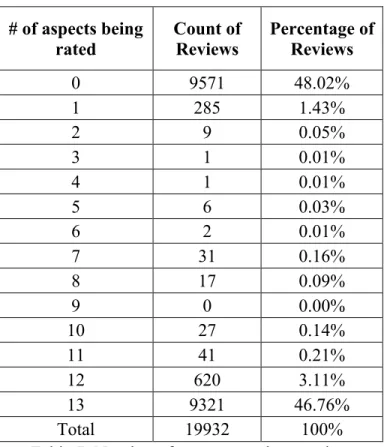
I crawled 19,932 car reviews from TrueCar. These include all the records in the website with an actual text comment. These review records contain 35 car brands in market, provided by reviewers between Jan, 2016 and Jun, 2019. The website review system allows reviewers to enter an overall rating, a review comment, and 13 aspect ratings in each review: Satisfaction, Value, Safety, Reliability, Efficiency, Ride, Seating, Exterior, Interior, Audio, Comfort, Technology and Performance. However, the users may not see
any reason to rate and describe all 13 aspects, and they may just include aspects that they care most about. The overall rating and Satisfaction rating are integers from 1 star to 5 stars, while ratings of other 12 aspect ratings include 1, 1.5, 2, 2.5, 3, 3.5, 4, 4.5, and 5 stars. These can serve as ground-truth for quantitative evaluation of aspect rating prediction.
I first perform simple pre-processing on this dataset:
in Table 7, the reviews without aspect ratings (48.02%) are almost half of all reviews. After this pre-processing stage, 10,361 reviews are left.
# of aspects being
rated Count of Reviews Percentage of Reviews
0 9571 48.02%
1 285 1.43%
2 9 0.05%
3 1 0.01%
4 1 0.01%
5 6 0.03%
6 2 0.01%
7 31 0.16%
8 17 0.09%
9 0 0.00%
10 27 0.14%
11 41 0.21%
12 620 3.11%
13 9321 46.76%
Total 19932 100%
Table 7: Number of aspects rated per review
Aspect Keywords
Technology
ac, acc, android, apple, Bluetooth, button, camera, cellphone, computer, connect, connection, connectivity, cruise, display, electronic,
entertainment, feature, gps, horsepower, infotainment, iphone, keyless, lane, map, nav, navi, navigation, phone, play, power, radio, remote, sensor, smartphone, software, tech, technologically, touch, touchscreen, voice
Audio aux, cd, loud, media, mp3, music, player, song, sound, speaker, stereo Performance accelerate, acceleration, auto, automate, automatic, awd, cylinder, diesel, drive, drivetrain, engine, engineer, exhaust, gasket, gear, gearbox,
gearshift, handle, haul, performance, steering, tow, transmission, wheel Exterior color, door, exterior, flat, gate, headlamp, headlight, lift, liftgate, paint, rear, style, tail, tailgate, tire, wheel, window, windshield, wiper
Seating backseat, heat, lumbar, memory, seat, seatbelt
Interior
beam, box, cargo, cigarette, compartment, console, cup, dash, dashboard, door, glove, glovebox, headrest, headroom, holder, interior, legroom, light, lighter, lock, mat, mirror, moonroof, pedal, pocket, roof, room, roomy, space, steering, storage, sun, sunglass, sunroof, taillight, trunk, unlock, view, visor, wheel
Efficiency battery, charge, consumption, efficient, fuel, gas, hybrid, mileage, tank Ride ride
Reliability noise, rattle, rattling, reliability, shake
Safety airbag, assistant, blind, brake, camera, departure, lane, quality, safe, safety, sensor, warning
Comfort
airflow, arm, armrest, backseat, climate, comfort, comfortable,
comfortably, conditioning, convenience, heat, headrest, lumbar, luxury, memory, seat, seatback, seatbelt, support, temperature, uncomfortable, vent
Value cheap, expensive, money, price, useful, value, wallet
Satisfaction
able, absorbed, admirable, admired, affable, affectionate, afraid, aggravated, agreeable, aggressive, alarmed, amazed, amazing, ambivalent, amused, angry, annoy, annoyed, anxious, apprehensive, ashamed, astonished, awful, awkward, bad, beautiful, best, cheesy, complain, decent, destroy, detriment, disappointed, dissatisfied, enjoy, excellent, fun, glad, good, great, handsome, happy, hate, horrible, impressive, incomplete, like, love, lovely, negative, nice, pleased, pleasure, positive, regret, ridiculous, satisfactory, satisfy, shame, suck, terrific, ugly, wonderful, worst
Table 8: keywords list for each aspect
# of aspects being described
Count of Reviews
Percentage of Reviews
0 334 3.22%
1 1587 15.32%
2 1796 17.33%
3 1691 16.32%
4 1464 14.13%
5 1104 10.66%
6 826 7.97%
7 594 5.73%
8 434 4.19%
9 296 2.86%
10 135 1.30%
11 66 0.64%
12 31 0.30%
13 3 0.03%
Total 10361 100.00%
Table 9: Number of aspects described per review
2) convert all the words into lower case; and removing punctuation and stop words. I use a default list of stop words in English defined by NLTK3. After the pre-processing, the data set contains 10,027 car reviews and 289 car models.
The average data set in research described in the literature review (section 2) is 467,492 records. In comparison, the data size in this paper is only 2.14% of the average size even though I scraped all available data from TrueCar website. One potential explanation is that the datasets being used in related study before are mainly about reviews of hotels, restaurants and low-priced products, such as mp3. However, considering the type of business and how frequently consumers tend to use that type of business, a small data size for car review is acceptable. For instance, business types that people use frequently
(such as restaurants) will probably have more reviews because more people simply visit these types of business more often and on a regular basis. But people tend not to change their car regularly. In addition, Yelp and TripAdvisor are dominant toward reviews for restaurants and hotels, but TrueCar has some major competitors such as KBB.
3.2 Observation
3.2.1 Trends of overall ratings
When scoring a product, users may consider multiple aspects of the product. If these aspects could meet the users’ requirement, they can give a high overall rating, otherwise, they could give low scores. Therefore, overall rating can partly reflect the users’ attitudes to aspects. To investigate the trend of overall ratings, I computed the distribution for overall ratings, aspects ratings, and total aspect ratings. It shows that more than half of reviewers give high ratings for overall ratings: 4 and 5 stars for their purchases. Only about 2% reviewers are extremely dissatisfied and give the rating of 1 star. The same patterns are also observed in the distribution of aspect ratings for Performance, Exterior, Reliability, Safety, Satisfaction and total aspect ratings. The details of overall rating distribution are shown in Table 10 and Figure 2, and aspect rating distribution, total aspect ratings distribution is showed in Table 11 and Figure 3.
Overall
Rating 1 2 3 4 5 Total
Count of
Reviews 164 2098 2066 2257 3481 10066
Percentage of
Reviews 0.02 0.21 0.21 0.22 0.35 1
28
Aspect 5.0 4.5 4.0 3.5 3.0 2.5 2.0 1.5 1.0 Total
Technology Count 1178 980 1022 1057 1459 1533 1431 636 292 9588
Percentage 12.29% 10.22% 10.66% 11.02% 15.22% 15.99% 14.92% 6.63% 3.05% 100.00%
Audio Count 2738 821 1191 619 2062 572 1491 301 214 10009
Percentage 27.36% 8.20% 11.90% 6.18% 20.60% 5.71% 14.90% 3.01% 2.14% 100.00%
Performance Count 2164 1565 1479 1232 1685 1000 736 164 34 10059
Percentage 21.51% 15.56% 14.70% 12.25% 16.75% 9.94% 7.32% 1.63% 0.34% 100.00%
Exterior Count 3105 1300 1449 966 1679 733 682 108 37 10059
Percentage 30.87% 12.92% 14.41% 9.60% 16.69% 7.29% 6.78% 1.07% 0.37% 100.00%
Seating Count 1726 1126 1669 1057 1997 1026 1172 219 58 10050
Percentage 17.2% 11.2% 16.6% 10.5% 19.9% 10.2% 11.7% 2.2% 0.6% 100.0%
Interior Count 1905 1565 1394 1214 1669 1011 1022 212 65 10057
Percentage 18.94% 15.56% 13.86% 12.07% 16.60% 10.05% 10.16% 2.11% 0.65% 100.00%
Efficiency Count 1565 643 991 688 1641 798 2547 323 781 9977
Percentage 15.69% 6.44% 9.93% 6.90% 16.45% 8.00% 25.53% 3.24% 7.83% 100.00%
Ride Count 1748 1099 1567 1069 1909 993 1271 294 115 10065
Percentage 17.37% 10.92% 15.57% 10.62% 18.97% 9.87% 12.63% 2.92% 1.14% 100.00%
Reliability Count 2865 913 1310 607 2069 641 1156 273 136 9970
Percentage 28.74% 9.16% 13.14% 6.09% 20.75% 6.43% 11.59% 2.74% 1.36% 100.00%
Safety Count 2334 1287 1539 1008 2031 742 917 120 28 10006
29
Aspect 5.0 4.5 4.0 3.5 3.0 2.5 2.0 1.5 1.0 Total
Comfort Count 1442 1508 1481 1452 1677 1332 930 210 33 10065
Percentage 14.33% 14.98% 14.71% 14.43% 16.66% 13.23% 9.24% 2.09% 0.33% 100.00%
Value Count 2171 321 1369 238 2601 199 2494 0 565 9958
Percentage 21.80% 3.22% 13.75% 2.39% 26.12% 2.00% 25.05% 0.00% 5.67% 100.00%
Satisfaction Count 4432 0 1775 0 2290 0 1244 0 435 10176
Percentage 43.55% 0.00% 17.44% 0.00% 22.50% 0.00% 12.22% 0.00% 4.27% 100.00% Table 11-b: Aspect rating distribution
3.2.2 Aspect Description Distribution
Table 12 and Figure 4 demonstrate the distribution of the number of aspects being described in review text. There are only 3 reviews that present all 13 aspects. By the fact that 76.98% reviews describe 0 to 5 aspects, it is known that most reviewers are not willing to offer a comprehensive review including all aspects.
# of aspects described Count Percentage
0 334 3.22%
1 1587 15.32%
2 1796 17.33%
3 1691 16.32%
4 1464 14.13%
5 1104 10.66%
6 826 7.97%
7 594 5.73%
8 434 4.19%
9 296 2.86%
10 135 1.30%
11 66 0.64%
12 31 0.30%
13 3 0.03%
Total 10361 100.00%
Figure 4: Number of aspects described per review
# of Reviews in which the Aspect is/is
not Described
YES NO
Technology 6283 3744
Audio 1191 8836
Performance 3340 6687
Exterior 3023 7004
Seating 2074 7953
Interior 3485 6542
Efficiency 1561 8466
Ride 820 9207
Reliability 1007 9020
Safety 2235 7792
Comfort 3317 6710
Value 3020 7007
Satisfaction 8009 2018
Table 13: Number of reviews in which the aspect is/is not described
4 METHODS
In this section, I discuss the methods for mapping the sentences to one or more aspects, getting sentiment score for each sentence, computing sentiment for each aspect, and adding overall rating into prediction.
4.1 Mapping Aspect to Sentence
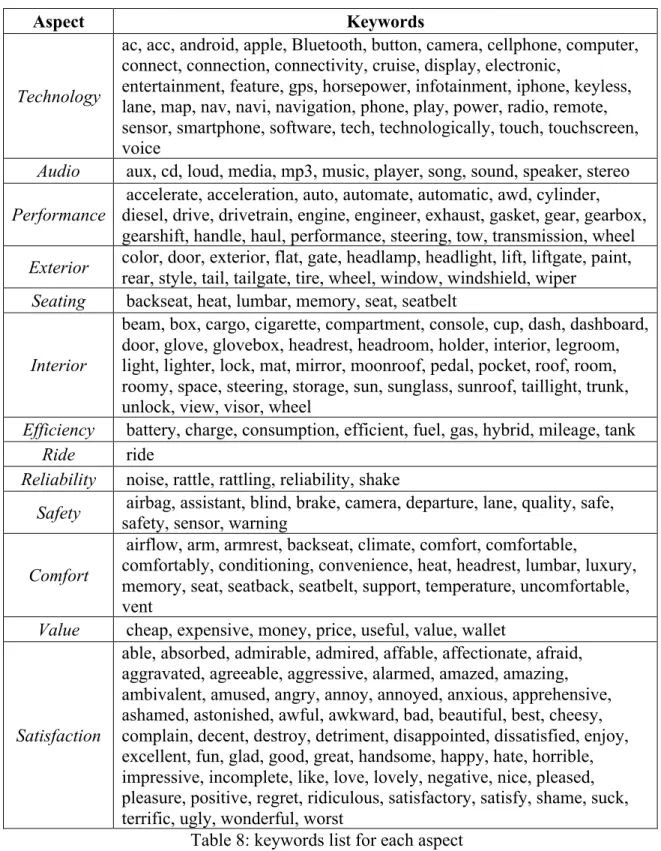
There is an assumption in this paper: that it is clear which words are discussing which aspects in a review. Therefore, I first perform sentence and aspect mapping in a review document based on the given keywords describing aspects. The keywords list is
illustrated in Table 8.
drive” would be related to Technology and Performance as it has two words from keywords list: technology and drive.
4.2 Sentiment Analysis of Sentences
I used VADER4 (Valence Aware Dictionary and sEntiment Reasoner) model for recognizing sentiment for each aspect-relevant sentence. VADER is a lexicon and rule-based sentiment analysis tool that is specifically attuned to sentiments expressed in social media. This model outputs sentiment scores to 4 classes of sentiments: Negative, Neutral, Positive and Compound. The score of Compound is computed by summing the valence scores of each word in the lexicon, which is then normalized to be between -1 (most extreme negative) and +1 (most extreme positive)5.
4.3 Aspect Rating Prediction with Text Feature
In order to compute rating for aspect A in a review R, a sum of sentiment scores of all sentences in R relating to A will be calculated. Then I use the average sentiment score as the aspect rating prediction. Because the sentiment score outputted by VADER is range from -1 to 1, the last step is to map the range to [1,5]. The following formula shows the process of calculation:
Aspect Sentiment Score = (
∑2%&'%&*%2$%&'()%&' $*+,% -+, .%/%01&' $%&'%&*%2 34)5%, +- .%/%01&' $%&'%&*%2 67) ∗:
;
4 http://www.nltk.org/howto/sentiment.html
If the Aspect Sentiment Score is not an integer or among [1.5, 2.5, 3.5, 4.5], it will be rounded to the nearest integer or decimal in [1.5, 2.5, 3.5, 4.5].
Consider an example review contains 4 sentences:
“In other words, at this level, there is no excuse for the standard sound system to be a
"dial" and not a touch screen style stereo. The sound is good, but it's totally antiquated.
Additionally, I would comment that the front seat can be a bit of a challenge to get out of
at times, and seems a little cramped at times. Thank you.”
Table 14 shows the relevant aspects and sentiment score for each sentence.
Sentence Relevant Aspects Sentiment Score 1st sentence [Technology, Audio, Exterior] -0.2263 2nd sentence [Audio, Satisfaction] 0.2382
3rd sentence [Seating, Comfort] 0.0772
4th sentence []
Table 14: Relevant aspects and sentiment score for example review To get sentiment score for Audio, the following computation is performed:
Aspect Sentiment Score = <
=>.@@AB C >.@BD@ @ 67E∗:
; = 2.51
Therefore, the final predicted rating for Audio of this review would be 2.5.
4.4 Aspect Rating Prediction with Overall Rating Feature and Text Feature
rating. The formula is as follows, where the Overall Rating Weight in this formula ranges from 0.0 to 1.0.
AvgPct = Overall Rating * Overall Rating Weight + Aspect rating prediction with text feature * (1 - Overall Rating Weight)
4.5 Aspect Rating Prediction with Chunk Parsing
I use sentence sentiment score to compute aspect sentiment score, however, one concern about this methodology is when one sentence describes more than one aspect with different emotions. For example, given a sentence “Lexus is quieter on road and has a great ride but driver seat is less comfortable.”, this sentence relates to three aspects:
Ride, Seating and Comfort but the sentiment for Ride is different from the sentiment for
Seating and Comfort. In the dataset, there are 14,142 out of 46,503 (30.41%) sentences describing 2 or more aspects. And 3441 out of 10027 (34.32%) reviews include sentences relating to more than 1 aspect. To mitigate the effect of this problem, I detect chunks in all sentences depicting more than one aspect.
I use “pos_tag” package in NLTK library as “part-of-speech” tagger. The tagger defines words tags based on standard English sentence structure. But for review texts not following a formal structure, words are likely to be tagged differently if tagging is done by a person. For example, given a sentence “fun to drive and excellent on gas”,
“excellent” is tagged as “VB” (verb), instead of “JJ” (adjective). In addition, words with all letters uppercased are tagged as “NNP” regardless the actual parts of speech.
Therefore, I have adjusted the tags in the 7 patterns to follow NLTK tagging rules. In the sentence “fun to drive and excellent on gas”, “excellent on gas” can be extracted with pattern “<VB><IN>?<DT>?<NN>+”. And “EXCELLENT SOUND” can be got through pattern “<NNP>+<CC>?”.
Compared to the original sentence, aspects are expressed more specifically in chunks. In the above example, there are two chunks after chunk detection: “great ride” and “driver seat is less comfortable”. Then, instead of analyzing the sentiment score for a full sentence, I get the sentiment score for each chunk and calculate sentiment score for each aspect.
Tag Pattern Example
<JJ><NN>+6<VBZ>?7<RBR>*8<JJ>* Tech-Plus package is phenomenal
excellent safety quiet ride
engine performance is awesome <NN>+<TO><VB>* fun to drive
convenient to use mirror hard to adjust
technology need to improve
Tag Pattern Example <RB>+<TO><VB>* fun enough to drive
very hard to drive <VB><IN>?<DT>?<NN>+ excellent on gas
Love the ride
perform like first-generation technology
love that safety aspect
<NNP>+<CC>? EXCELLENT SOUND
<DT>?<NN>+<VBZ><RB>*<JJ>+<CC>?<JJ>? <NN>?
car is reliable
seat entry is simply difficult and uncomfortable
glove compartment is too small the navigation system is
somewhat complex
the trunk is surprisingly roomy <NNP>+<IN><NNP>+ EXCELLENT FEEL OF THE
WHEEL Table15: Tag patterns and examples
Tag Meaning (Example)
CC coordinating conjunction DT determiner
IN preposition/subordinating conjunction JJ adjective (“big”)
NN noun, singular (“desk”)
NNP proper noun, singular (“Harrison”) RB adverb (“very”, “silently”)
TO to
VB verb, base form (“take”) VBD verb, past tense (“took”)
VBG verb, gerund/present participle (“taking”) VBZ verb, 3rd person singular, present (“takes”)
5 RESULTS AND DISCUSSION
40
5.1 MSE with Various Overall Rating Weight (Without Chunk Parsing)
I use Mean Squared Error (MSE) as the evaluation metrics, and the results of MSE with various overall rating weight, but without
chunk parsing are shown in Table 17.
Aspect
MSE with Various Overall Rating Weight (Without Chunk Parsing) OR Weight 0.0 OR Weight 0.1 OR Weight 0.2 OR Weight 0.3 OR Weight 0.4 OR Weight 0.5 OR Weight 0.6 OR Weight 0.7 OR Weight 0.8 OR Weight 0.9 OR Weight 1.0
Technology 1.7114 1.4263 1.1868 0.9749 0.8951 0.8576 0.7658 0.7880 0.8237 1.0429 1.0824 Audio 2.5757 2.2491 1.8656 1.5880 1.3833 1.2263 1.1007 1.0487 1.0565 1.1853 1.2375 Performance 1.8444 1.6081 1.2551 1.0085 0.8553 0.6471 0.6111 0.5361 0.5372 0.5833 0.6021 Exterior 2.7211 2.3435 1.9148 1.5484 1.3375 0.9454 0.9188 0.7797 0.7248 0.6907 0.6921 Seating 1.8873 1.5892 1.2466 0.9772 0.8173 0.6330 0.5430 0.4786 0.4705 0.5366 0.5593 Interior 2.0448 1.7187 1.3450 1.0256 0.8631 0.6028 0.5165 0.4172 0.3923 0.4138 0.4255 Efficiency 2.1186 2.0105 1.6771 1.5719 1.4394 1.5064 1.3236 1.3378 1.3753 1.4898 1.5285 Ride 1.4177 1.2851 0.9969 0.8083 0.6967 0.6273 0.5256 0.4985 0.4889 0.5391 0.5549 Reliability 2.0076 1.7254 1.3976 1.1275 0.9965 0.7510 0.6506 0.5685 0.5520 0.5586 0.5641 Safety 2.1191 1.8278 1.4183 1.1357 0.9334 0.6741 0.5933 0.4978 0.4586 0.4608 0.4842 Comfort 1.5956 1.3715 1.0303 0.7895 0.6520 0.5024 0.4028 0.3463 0.3356 0.3770 0.3968 Value 2.0300 1.7265 1.4224 1.1716 1.0516 0.9347 0.7948 0.7604 0.7554 0.8765 0.8947 Satisfaction 2.1169 1.9068 1.6372 1.2916 1.1132 1.0087 0.9399 0.8714 0.8428 0.8691 0.8799
An overall rating weight of 0, which means no overall rating information included in the
model at all, produces very poor result. In contrast, the method with an overall rating
weight of 0.8 achieves better MSE toward the average and 8 aspects: Performance,
Seating, Interior, Ride, Reliability, Safety, Comfort, Value and Satisfaction. For the other
5 aspects: Technology and Efficiency run better when overall rating weight is 0.6; Audio
and Performance perform better with an overall rating weight of 0.7; Exterior
outperforms others with an overall rating weight of 0.9.
42
5.2 MSE with Various Overall Rating Weight (With Chunk Parsing)
Table 18 displays results of MSE with various overall rating weight, and chunk parsing.
Aspect
MSE with Various Overall Rating Weight (With Chunk Parsing) OR Weight 0.0 OR Weight 0.1 OR Weight 0.2 OR Weight 0.3 OR Weight 0.4 OR Weight 0.5 OR Weight 0.6 OR Weight 0.7 OR Weight 0.8 OR Weight 0.9 OR Weight 1.0
Technology 1.6190 1.2523 1.0874 0.8451 0.8133 0.7578 0.6998 0.7409 0.7674 1.0564 1.0824
Audio 2.2133 1.8466 1.5876 1.3257 1.2681 1.0822 1.0421 1.0214 1.0477 1.2082 1.2375
Performance 2.0419 1.6589 1.3398 1.0191 0.9400 0.5964 0.6055 0.5325 0.5332 0.5905 0.6021
Exterior 2.7508 2.2128 1.8710 1.4394 1.3775 0.8231 0.8951 0.7578 0.7369 0.6918 0.6921
Seating 1.7451 1.2884 1.0900 0.7631 0.7547 0.4735 0.4726 0.4255 0.4280 0.5576 0.5593
Interior 2.0523 1.5942 1.2916 0.9234 0.8578 0.4990 0.4833 0.3834 0.3739 0.4215 0.4255
Efficiency 1.9518 1.7369 1.5231 1.3529 1.3057 1.3263 1.2120 1.2544 1.2826 1.5036 1.5285
Ride 1.8758 1.4501 1.2223 0.8527 0.8009 0.5219 0.5176 0.4433 0.4602 0.5481 0.5549
Reliability 2.1970 1.7165 1.4620 1.0969 1.0700 0.6668 0.6430 0.5406 0.5390 0.5570 0.5641
Safety 2.4302 1.9038 1.5680 1.1423 1.0526 0.5946 0.6060 0.4876 0.4693 0.4735 0.4842
Comfort 1.8367 1.3600 1.1200 0.7444 0.7095 0.3897 0.3825 0.3042 0.3073 0.3910 0.3968
Value 1.8760 1.5015 1.2946 1.0257 0.9793 0.8269 0.7293 0.7075 0.7078 0.8925 0.8947
Satisfaction 2.3033 2.0495 1.7694 1.3812 1.1953 1.0636 0.9773 0.9002 0.8506 0.8696 0.8799
After chunk parsing all the sentences depicting more than one aspect, the model performs
best with an overall rating weight of 0.7. This result further supports the point that the
MSE result would be better considering overall rating weight. One noticeable change is
that compared to the best result of the model without chunk parsing, the average MSE
decreases 3.57% using to the model with chunk parsing. And the latter model has a lower
MSE in 10 aspects, including Technology, Audio, Performance, Seating, Interior,
Efficiency, Ride, Reliability, Comfort and Value. A more direct comparison is shown in
Table 19.
Aspect MSE Without Chunk Parsing MSE With Chunk Parsing
OR Weight 0.8 OR Weight 0.7
Technology 0.8237 0.7409
Audio 1.0565 1.0214
Performance 0.5372 0.5325
Exterior 0.7248 0.7578
Seating 0.4705 0.4255
Interior 0.3923 0.3834
Efficiency 1.3753 1.2544
Ride 0.4889 0.4433
Reliability 0.5520 0.5406
Safety 0.4586 0.4876
Comfort 0.3356 0.3042
Value 0.7554 0.7075
Satisfaction 0.8428 0.9002
AVERAGE 0.6780 0.6538
Table 19: Comparison of MSE for model with and without chunk parsing
The fact that the model with chunk parsing achieves better results indicates reviewers are
sentences for each review is 4.64 and there are 13 aspects in total, it is essentially
impossible for each reviewer to write a single sentence for each aspect.
5.3 Over-Prediction and Under-Prediction
In this part I discuss the change of over-prediction and under-prediction as overall rating
weight varies.
• Over-Prediction: the predicted rating is greater than actual rating.
• Under-Prediction: the predicted rating is less than actual rating.
• Accurate-Prediction: the predicted rating and actual rating are the same.
As shown in Table 20 and Figure 6, the number of over-prediction and
accurate-prediction rise as the overall ratings weight increases. With an overall rating weight of
1.0, over-prediction is 56.21% above it is when the weight is 0.0. And accurate prediction
increases dramatically by 203.85% from a weight from 0.0 to 1.0. In contrast,
45 Prediction
Type
# of Over-Prediction, Under-prediction and Accurate-Prediction with Various Overall Rating Weight OR Weight 0.0 OR Weight 0.1 OR Weight 0.2 OR Weight 0.3 OR Weight 0.4 OR Weight 0.5 OR Weight 0.6 OR Weight 0.7 OR Weight 0.8 OR Weight 0.9 OR Weight 1.0
Over-Prediction 8840 8971 9305 10086 9873 12542 10196 11658 11497 13746 13809
Under-prediction 24438 24094 23053 22586 22266 17697 18824 17318 14924 9870 9191
Accurate-
Prediction 5042 5255 5962 5648 6181 8081 9300 9344 11899 14704 15320
47 Table 21 and Figure 7 display MSE of over-prediction, prediction and all prediction (including over-prediction,
under-prediction and accurate-under-prediction) with different overall rating weight. As it appears in Figure 7, when adding weight to overall
rating, MSE of under-prediction and all prediction decreases and reaches the lowest level at overall rating weight 0.7 and 0.8
respectively, then gradually increases. In contrast, over-prediction has its lowest MSE when overall rating weight is 0.4, and its largest
MSE of 1.36 with an overall rating weight of 1.0.
Prediction Type
MSE of Over-Prediction, Under-prediction and All-Prediction OR Weight 0.0 OR Weight 0.1 OR Weight 0.2 OR Weight 0.3 OR Weight 0.4 OR Weight 0.5 OR Weight 0.6 OR Weight 0.7 OR Weight 0.8 OR Weight 0.9 OR Weight 1.0
Over-prediction 1.20 1.20 1.00 0.90 0.86 0.94 0.96 0.98 1.07 1.32 1.36
Under-prediction 2.80 2.22 1.96 1.43 1.35 0.99 0.96 0.83 0.88 1.12 1.19
All-Prediction 2.06 1.68 1.42 1.08 1.00 0.76 0.73 0.67 0.66 0.76 0.77
According to all prediction MSE in Figure 7, the best overall rating weight is 0.8.
However, the number of accurate-predictions is the greatest when overall rating weight is
1.0. This shows that mean squared error and predictive accuracy do not always agree
when it comes to identifying an optimal prediction model.
The possible reason for under-prediction is that reviewers exaggerate their sentiment
when rating. Additionally, over-prediction implies that reviewers may offer less positive
rating than their text comments. However, another possibility is that the sentiment
analysis itself could be wrongly-rating the sentiment. The only way to determine this
would be to interview the reviewers themselves, learning what their true intentions are.
The reasons of the mismatch of review text sentiment polarity and review rating offer a
potential area for further exploration.
5.4 Aspect-Based MSE Summarization
The aspect-based MSE change is reflected in Figure 8. MSE for each single aspect is
presented in Table 22 and Table 23. Plus, Table 24 and Table 25 further display MSE of
each overall rating weight. It is observable that Audio and Efficiency have larger MSE
than other aspects when overall rating weight is 0.5 or higher. Compare to the best
average MSE 0.6538 at overall rating weight 0.7, the smallest MSE for Audio is 1.0214,
50 With regarding to change percentage from top to bottom, the sharpest change of MSE happens to Comfort, with a drop of 83.44%
from weight 0.0 to weight 0.7. Safety has the second most abrupt change of MSE of 80.69%. Another big fall of MSE is with Interior,
which is 81.78%.
6 CONCLUSIONS
The major goal for this paper is to respond to the question of whether overall rating
would improve the accuracy of aspect rating prediction or not. I propose a model
mapping aspect to sentence. The model takes review texts and overall ratings as input,
and discovers each review’s ratings on the given aspects. Then, an empirical experiment
on a car review data set shows that with overall rating, aspect ratings are predicted more
precisely. Furthermore, the prediction result is more accurate after extracting chunks
narrating aspects more specifically.
A major limitation of this methodology is the authority of keyword lists for aspects and
common tag patterns for chunk parsing. Keywords for each aspect could be overlapping,
for example: words depicting “front seat” can be related to both Comfort and Seating.
Additionally, consumers have different interpretations toward aspects. Another limitation
concerns the use of chunk parsing. People may use complicated and diverse phrases in
reviews for expression and communication. The tag patterns that I use in this research are
unlikely to correctly identify all chunks in review texts. Future optimization of the current
model will focus on addressing limitations, such as those listed above, and on validating
7 REFERENCES
Anderson, M., & Magruder, J. (2012). Learning from the Crowd: Regression Discontinuity Estimates of the Eects of an Online Review Database. The Economic Journal, doi: 10.1111/j.1468-0297.2012.02512.x, 2012.
Caruana, R. (1997). Multitask learning. Machine Learning 28(1):41–75.
Chen, H., Sun, M., Tu, C., Lin, Y., & Liu, Z. (2016). Neural sentiment classification with user and product attention. In Proceedings of EMNLP. pages 1650–1659.
Collobert, R., Weston, J., Bottou, L., Karlen, M., Kavukcuoglu, K., & Kuksa, P. (2011). Natural language processing (almost) from scratch. Journal of Machine Learning
Research 12(Aug):2493–2537.
Diao, Q., Qiu, M., Wu, C.Y., Smola, A.J., Jiang, J., & Wang, C. (2014). Jointly modeling aspects, ratings and sentiments for movie recommendation (jmars). In Proceedings of KDD, pages 193–202.
Dong, L., Wei, F., Tan, C., Tang, D., Zhou, M., & Xu, K. (2014). Adaptive recursive neural network for target-dependent twitter sentiment classification. In Proceedings of ACL, pages 49–54.
Fahrni, A., & Klenner, M. (2008). Old wine or warm beer: Targetspecific sentiment analysis of adjectives. Affective Language in Human and Machine.
Lakkaraju, H., Socher, R., & Manning, C. (2014). Aspect specific sentiment analysis using hierarchical deep learning. In NIPS Workshop on Deep Learning and
Representation Learning.
Liu, B. (2012). Sentiment analysis and opinion mining. Synthesis lectures on human language technologies, 5(1):1–167.
Lu, B., Ott, M., Cardie, C., & Tsou, B.K. (2011). Multi-aspect sentiment analysis with topic models. In Proceedings of ICDM Workshops, pages 81–88.
McAuley, J., Leskovec, J., & Jurafsky, D. (2012). Learning attitudes and attributes from multiaspect reviews. In Proceedings of ICDM. IEEE, pages 1020–1025.
Pang, B., & Lee, L. (2008). Opinion mining and sentiment analysis. Foundations and trends in information retrieval, 2(1-2):1–135.
Pappas, N., & Popescu-Belis, A. (2014). Explaining the stars: Weighted multiple-instance learning for aspect-based sentiment analysis. In Proceedings of EMNLP, pages 455–466. Association for Computational Linguistics.
Pontiki, M., Galanis, D., Papageorgiou, H., Androutsopoulos, I., Manandhar, S., ALSmadi, M., Al-Ayyoub, M., Zhao, Y., Qin, B., Clercq, O.D., Hoste, V., Apidianaki, M., Tannier, X., Loukachevitch, N., Kotelnikov, E., Bel, N., Jim´enez-Zafra, S.M., & Eryi˘git, G. (2016). Semeval-2016 task 5: Aspect based sentiment analysis. In
Proceedings of the 10th International Workshop on Semantic Evaluation (SemEval-2016), pages 19–30. Association for Computational Linguistics.
Pontiki, M., Galanis, D., Pavlopoulos, J., Papageorgiou, H., Androutsopoulos, I., & Manandhar, S. (2014). Semeval-2014 task 4: Aspect based sentiment analysis. Proceedings of International Workshop on Semantic Evaluation at, pages 27–35.
Qu, L., Ifrim, G., & Weikum, G. (2010). The bag-of-opinions method for review rating prediction from sparse text patterns. In Proceedings of the 23rd International Conference on Computational Linguistics. Association for Computational Linguistics, 2010, pp. 913– 921.
Shrestha, N., & Nasoz, F. (2019). Deep Learning Sentiment Analysis of Amazon.com Reviews and Ratings. ArXiv, abs/1904.04096.
Socher, R., Perelygin, A., Wu, J.Y., Chuang, J., Manning, C.D., Ng, A.Y., & Potts, C. (2013). Recursive deep models for semantic compositionality over a sentiment treebank. In Proceedings of EMNLP.
Sutskever, I., Vinyals, O., & Le, Q. (2014). Sequence to sequence learning with neural networks. In Advances in Neural Information Processing Systems (NIPS 2014).
Tang, D., Qin, B., & Liu, T. (2015a, September). Document modeling with gated recurrent neural network for sentiment classification. In Proceedings of EMNLP, pages 1422–1432, Lisbon, Portugal, September. Association for Computational Linguistics.
Tang, D., Qin, B., & Liu. T. (2015b). Learning semantic representations of users and products for document level sentiment classification. In ACL. pages 1014–1023.
Titov, I., & McDonald, R. (2008). A joint model of text and aspect ratings for sentiment summarization. ACL.
Toh, Z., & Su. J. (2016). Nlangp at semeval-2016 task 5: Improving aspect based
sentiment analysis using neural network features. In Proceedings of the 10th International Workshop on Semantic Evaluation (SemEval-2016), pages 282–288. Association for Computational Linguistics.
Wang, H., Lu, Y., & Zhai, C. X. (2010). Latent aspect rating analysis on review text data: a rating regression approach. In Proceedings of KDD, pages 783–792.
Wang, H., Lu, Y., & Zhai, C.X. (2011). Latent aspect rating analysis without aspect keyword supervision. In Proceedings of KDD, pages 618–626.
Wang, Y., Huang, M., Zhao, L., & Zhu, X. (2016). Attention-based lstm for aspect-level sentiment classification. In Proceedings of EMNLP.
Xia, R., Zong, C., & Li, S. (2011). Ensemble of feature sets and classification algorithms for sentiment classification. Information Sciences, 181(6):1138–1152.
Yang, Z., Yang, D., Dyer, C., He, X., Smola, A.J., & Hovy, E.H. (2016). Hierarchical attention networks for document classification. In HLT-NAACL, pages 1480–1489.
Yin, Y., Song, Y., & Zhang, M. (2017). Document-level multi-aspect sentiment