Global Cardiovascular Disease Risk Scores: A Systematic Review of the Literature
and
Study of the Effect of Risk Scores on Physician Adherence to Guidelines for the Primary Prevention of Cardiovascular
Disease
Eric Michael Crespo, M.D.
A Master's Paper submitted to the faculty of the University of North Carolina at Chapel Hill in partial fulfillment of the requirements for the degree
of Master of Public Health in the Public Health Leadership Program
Table of Contents
I.
Introduction
II.
Background: Cardiovascular Disease Prevention and the
Rationale for Global CHD Risk Calculation
a. The Burden of Suffering Associated with Cardiovascular Disease in the U.S.
b. Opportunities for Prevention
c. The Continuum of Cardiovascular Disease and Prevention
d. The Prevention Gap
e. Integrating Risk Information: The Rationale for Global Cardiovascular Disease Risk Scores
1. Risk Stratification
n. Framingham Risk Scores
m. Clinical Relevance of Risk Scores
IV. Limitations
v. Validity
VI. Other Factors
1. CHD Equivalents
2. The Metabolic Syndrome
3. Novel Risk Factors and New Screening Tests
f. Is There Evidence Supporting the Use of Global Risk Scores?
III.
Is the Routine Use of Global Coronary Heart Disease Risk
Scores Associated with Clinical Benefits?: A Systematic
Review of the Literature
a.
Methodsb.
Resultsc. Discussion
IV.
The Effect of Global CHD Risk Scores on Physician
Decisions Regarding the Primary Prevention of
Cardiovascular Disease: Preliminary Results
a. Methods
b.
Resultsc. Discussion
2 of102
Introduction
Several major guidelines and organizations now advocate routine assessment of
cardiovascular risk using Framiugham-derived coronary heart disease (CHD) risk
scores.1-3 Yet there is relatively little data on whether the routine use of such
assessments translates into improved clinical outcomes. In particular, little is
known about how knowledge of a patient's calculated 10-year CHD risk affects a
physician's perception of the patient's risk and whether that in turn translates into improved adherence to published guidelines for the primary prevention of CHD.
This paper is organized into three major sections: First, a thorough review of the
theoretical benefits of global CHD risk calculation is presented. Following this is
a systematic review of the literature. supporting the efficacy of incorporating
Framingham-derived global risk scores into routine clinical practice. Lastly we
present the methods and preliminary results of a study designed to determine
whether physicians make better CHD prevention decisions when they interpret a
patient's risk factor information in the context of a calculated 10-year risk of
CHD than when they use the risk factor information alone.
Background:
Cardiovascular Disease Prevention and the
Rationale for Global CHD Risk Calculation
The Burden of Suffering Associated with Cardiovascular Disease
in the
U.S.
Almost one million Americans die of cardiovascular disease (CVD) each year,
which is more than cancer, chronic obstructive lung disease, accidents, diabetes,
and influenza/pneumonia combined. The major forms of CVD, heart disease and
stroke, account for one of every five and one of every 15 deaths respectively, and
together they account for more than one of every three deaths in the U.S each
year. This is true regardless of gender or ethnic group. Despite a 26% decline in
the death rate from CVD over the last decade, the actual number of CVD deaths
has declined by only approximately 9.4% because of the increasing prevalence of
CVD and its risk factors in our society. 4• 5
Sixty-four million Americans currently have some form of CVD, and each year
they are joined by 1.9 million more (700,000 new myocardial infarctions [MI],
500,000 recurrent Mis, 500,000 new strokes, and 200,000 recurrent strokes)4•
These numbers are expected to increase over the next decade given the growing
number of older Americans and the high prevalence of CVD risk factors.
Although the incidence and prevalence of CVD clearly increase with age, this is
not simply a problem of the elderly. In fact, approximately 16.8% of all heart
disease deaths occur in people under 65 years old. 4• 6
Along with the staggering human toll of CVD, the economic impact is significant.
CVD is the #1 disease category listed on hospital discharges (6.2 million/year),
and it accounts for 71 million physician office visits, 5.6 million outpatient
department visits, and 4.2 million emergency department visits each year.4• 7• 8 In
2004, the direct and indirect costs due to CVD are estimated at $368.4 billion.4
Opportunities for Prevention
Cardiovascular disease and its risk factors are among the most common
conditions encountered by primary care clinicians,7 and an increasing number of
people now have multiple risk factors4• 9• 10 Table 1 summarizes the prevalence of
the various CVD risk factors and puts these numbers into the perspective of the
average clinician's patient panel. The numbers vary depending on the location
and nature of practices, but the overall message is clear: every clinician sees many
patients who either already have CVD or are at risk for developing it.
Table 1: Prevalence of CVD and Its Risk Factors U.S. Adults" Prevalence
in U.S.
(%)
6 of 102
Prevalence estimates derived from NHANES III/IV and CDC/NCHS
data as listed in American Heart Association Heart Disease and Stroke Statistics - 2004 Update. Dallas, TX: American Heart Association;
2003. Prevalence of multiple risk factors is derived from Paynter et al. Declining prevalence of no known major risk factors for heart disease and stroke among adults -- United States, 1991-2001. MMWR. 2004;53(1):4-7.
•White and African-American men and women over age 20, except for tobacco use and physical inactivity statistics, which refer to adults 2:18 years.
nCardiovascular disease is defmed as !CD/I 0 codes !00-99 and Q20-28. Coronary Heart Disease is defmed as ICD/10 codes !20-25. Stroke is defined as ICD/10 codes !60-69.
*One or more of: hypertension, elevated cholesterol, diabetes, tobacco use, obesity.
** JNC 711
***As of2000, there were 67.1 Internists and Family Practioners per 100,000 U.S. population, this translates to 1490 patients per primary care physician12 The number of patients was calculated by multiplying the prevalence of the risk factor by 1490.
APhysical inactivity is defined as not meeting one of the following standards: activity of moderate intensity for 2:30 minutes per day on 2:5 days per week or vigorous intensity for 2:20 minutes per day on 2:3 days per week.13
Although sobering, these estimates point out the substantial opportunity that
exists for preventive interventions to make a difference in the lives of a large
number of patients. Much of this work has to be done at a population level, but
through consistent application of evidenced-based preventive interventions,
clinicians are in a position to help reduce the number of individuals in their
communities who will have a new or recurrent CVD event over both the
short-and long-term. Achieving this, however, requires not only a familiarity with
guidelines, but also an understanding of overarching framework of CVD
prevention.
The Continuum of Cardiovascular Disease and Prevention
Prevention can be conceptualized as a continuum with components that
correspond to the underlying burden of atherosclerotic disease, and thus to the
risk of CVD events in the target patient population (Figure 1 ).
[Figure 1 is located at the end ofthe paper]
Primordial prevention targets populations without any underlying f atherosclerosis and can be thought of as the prevention of CVD by preventing the
development of CVD risk factors in the first place14-17 Interventions in this
category include counseling for healthy diet, physical activity, obesity, and
smoking prevention. Although individual counseling of patients is desirable,
these interventions are most effective when part of a more intensive,
multidisciplinary program with a strong community-based component. The goal
of these activities is to decrease the prevalence of risk factors across all of society,
which in turn translates into a reduction in the number of people developing CVD.
Primary prevention refers to efforts to modify existing risk factors with the aim
of delaying or preventing new-onset CVD.18 These efforts target a heterogeneous
L
group of asymptomatic people without clinical cardiovascular disease who are atvarying levels of risk depending on the number, combination, and magnitude of
their risk factors. While some patients are at low risk, others have risk that equals
that of patients who already have CVD.
Over time, and with the accumulation of risk factors, patients will develop
varying degrees of subclinical atherosclerosis. These patients are at considerable
risk for experiencing a CVD event (MI, stroke, TIA, etc ... ) in the short term. In
these patients, the goal is to retard the progression of subclinical disease and
prevent a first CVD event. Prevention of a first CVD event in patients who have
vascular disease but who hav not yet suffered a clinical event is termed
secondary prevention.
F
Unlike primordial, primary, and secondary prevention, all of which aim to prevent
a first CVD event, the goal of tertiary prevention is to prevent recurrent events
in people who have already had a clinical CVD event. These people are at very
high risk for another event, and they require aggressive risk reduction strategies.
The framework provides insight into the manner in which the different CVD
prevention guidelines fit together. It also emphasizes that each level of
prevention is a stepping stone into the next, such that the preventive activities that
are begun in each stage are added on to the ones begun previously. The manner
in which the different CVD prevention guidelines fit into this framework is shown
in Appendix 1.
The Prevention Gap
Despite the availability of numerous guidelines and abundant evidence regarding
the efficacy of interventions to prevent CVD, the majority of people with CVD
risk factors do not have them under adequate control.19-23 The facts are startling:
69% of hypertensive patients do not have their blood pressure under control, and
almost half are not even on any treatrnent.22 Additionally, only 18% of patients
with dyslipidemia have their cholesterol treated to goallevels_19 The reasons for
this are complex and involve the interplay of multiple patient-, physician-, and
health care system-related factors.
For physicians, implementing evidenced-based guidelines into practice is
challenging. In part, this is due to the sheer number of existing guidelines and the
time constraints of everyday practice.24 Other factors include competing patient
demands, issues with patient adherence, misunderstanding about the proper focus
of preventive efforts (on the part of both the patient and physician), lack of
consistency among different guidelines, and confusion caused by rapidly
advancing science. The latter is especially true in the area of CVD prevention
where new biomarkers and diagnostic tests are announced frequently.
An additional factor that may play a role in the poor implementation of
interventions aimed at preventing CVD is that physicians have difficulty
accurately estimating risk. Risk assessment is important because it not only helps
identify candidates for preventive interventions, but also because it guides the
10 of102
f
I
intensity and types of interventions that are chosen?5 Unfortunately, estimating
risk is not as straightforward as it may seem, and several studies have shown that
physicians vary significantly in their ability to accurately estimate a patient's risk
ofCVD.26'34 It follows that inaccurate risk estimation may contribute to difficulty
in appropriately implementing CVD-preventing interventions.
Integrating Risk Information: The Rationale for Global
Cardiovascular Disease Risk Scores
Risk Stratification
Over the last decade several authorities have proposed that risk stratification (i.e.
estimation of a patient's overall risk of CVD) should be the first step in deciding
how to proceed with preventive interventions.
The rationale for this recommendation arises from the fact that the balance of
benefits and harms for treating CHD risk factors varies across the spectrum of
CHD risk. This is because several "traditional" risk factors demonstrate a fairly
linear relationship with the incidence of CVD. 35• 36 such that the risk of CVD is
reduced/increased by a relatively constant proportion across the spectrum of CHD
risk. As a corollary, the absolute benefit caused by a change in risk factor level
depends on the patient's baseline level of risk.
This linear association and its implications are the underpinning of what most
physicians understand intuitively; that is, as the risk of CVD increases, the net
benefits of treatment increase as well. The corollary to this is that as baseline
risk increases, the benefits of treatment will outweigh potential harms by a greater
margin since the harms of a particular treatment are generally independent of
CVD risk and therefore tend to remain at a relatively fixed level (Figure
2i
7•With this in mind, it becomes clear that estimation of baseline risk is central to
balancing the benefits and harms of any intervention. 38
Fig!. I'~ 2: Th;;, r41eti"Mhif:! bi!'1Wl!'en C'JD 11~ t~rtd lh;;o
Benefits
md
Harms rl T!'fatmentBenefit increases as CVD risk increases, but hann is
constant because it is generally independent of CVD risk. WhenCVD risk exceeds a certain threshold, the
benefits of treatment outweigh the hanns. (Adapted
from: Glasziou P, Irwig M. An evidence based
approach to individualising treatment. BMJ.
1995;311; 1356-1359.)
Hlql
The clinical utility of these observations can be illustrated using the example of
aspirin. Table 2 shows that when aspirin is used for primary prevention, a greater
number of events are prevented as the baseline risk for coronary heart disease
increases. In contrast, the risk of gastrointestinal bleeding from aspirin remains
constant across all CHD risk levels.3 The number of coronary heart disease
events prevented begins to exceed the number of adverse events at a 5-year risk of
3%. Below this threshold level aspirin therapy has the potential to cause more
harm than benefit, and thus should be avoided.
[Table 2 is located at the end of the paper]
Framingham Risk Scores
It is possible to arrive at a reasonably good estimate of CVD risk by screening for
the traditional CVD risk factors and then calculating a patient's global 10-year
coronary heart disease (CHD) risk score. This score, which can be easily
calculated using a number of readily available tools,39 is based on data collected
from the Framingham Heart Study and the Framingham Offspring Study. In 1998
a simplified and updated algorithm was published that integrated the categorical
approaches that are a part of blood pressure and cholesterol guidelines.36
The risk estimate is derived from a prediction model that was developed using
data from 5345 subjects (47% male) who were free of clinically apparent
coronary heart disease (CHD) and were between the ages of 30 and 74 years old
at the time of enrollment in the study. The patients were followed for 12 years in
order to collect end-point information. Multivariable and logistic regression were
used to develop models for the 1 0-year incidence of CHD events, and the
coefficients from the model were used to develop a point system for summing the
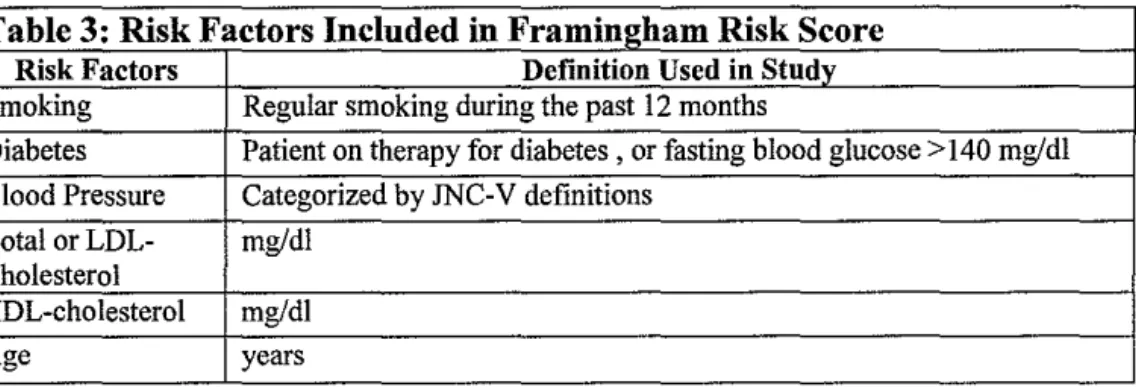
effects of various risk factors. Table 3 lists the risk factors included in the
original model. It is notable that obesity, triglycerides, physical activity, and
family history, which are all established risk factors, are not included in the
model. It is not clear whether the inclusion of these in the model would provide
significant additional information because these risk factors are at least partially
collinear with the risk factors already included in the model, and therefore the
independent contribution of these risk factors would is obscured.25
Table 3: Risk Factors Included in Framingham Risk Score Risk Factors Definition Used in Study Smoking Regular smoking during the past 12 mouths
Diabetes Patient on therapy for diabetes , or fasting blood glucose> 140 mg/dl
Blood Pressure Categorized by JNC-V definitions
Total or LDL- mg/dl Cholesterol
HDL-cholesterol mg/dl
Age years
The Framingham model can be used to predict a patient's 10-year risk of "Total
CHD" (angina, recognized and umecognized MI, unstable angina, and CHD
death) or "Hard CHD" (MI and CHD death only). Appendix 2 presents a simple
point-based method for calculating a Framingham risk score. Although absolute
risk estimates are used most often, relative risk can also be calculated. The
reference group is a "low risk" cohort, defined as non-diabetic non-smokers with
BP<l20/80 mmHg, total cholesterol <200 mg/dl (LDL-C < 130 mg/dl), and
C 2: 45 mg/dl (men) or 2: 55 mg/dl (women). This definition of "low risk" is
based on data from the Multiple Risk Factor Intervention Trial (MRFIT).40• 41
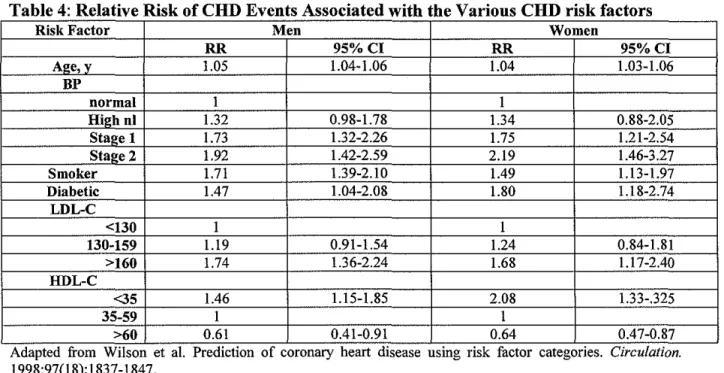
The model adds a degree of perspective because it reveals that different risk
factors impart a relatively comparable degree of risk -- generally on the order of a
RR 1.2-2.0 (Table 4). The similar influences of the different risk factors is not
widely appreciated.18• 36 Additionally, the model highlights the importance of age
as a risk factor: even in the absence of other risk factors, absolute risk for CHD
rises progressively with age (Table 5). The higher baseline risk associated with
older age points out the substantial opportunity for prevention in the elderly.18
[Tables 4 and 5 are located at the end ofthe paper]
Clinical Relevance of Risk Scores
Risk scores help clinicians classify patients as being either at low-, intermediate-,
or high-risk of coronary heart disease events over the next 10 years (short-term
risk). Definitions for the cut-offs between levels of risk, along with the general
implications of each level, can be found in Table 6.
[Tables 6 is located at the end of the paper]
Although generally accepted, the cut-offs between risk levels have some
uncertainty about them, 25• 42 and the they must be viewed as guides rather than as
absolute indications for any particular therapy. This uncertainty exists because
definitions of risk must take into account more than just the balance of the
potential harms and benefits of a particular treatment. Issues of cost-effectiveness
and individual patient preferences also must play a role. The distinctions become
particularly hazy among patients that fall into the intermediate risk category.
Although most U.S. authorities agree that those with a 10-year CHD risk of>20%
can be considered to be at high short-term risk and therefore candidates for more
aggressive risk reduction,2• 25 there is less agreement on the boundary between
low- and intermediate risk, with some arguing that 5% to 6% is a more
appropriate cut-off for the "low risk" designation because it limits the category to
patients who are less likely to have any of the traditional CHD risk factors other
than age.43
The issue is further complicated because low short-term risk does not necessarily
imply a low long-term risk. For example, a 50 year old man with a I 0-year risk
of 8% has an approximately 24% risk of having a CHD event over the next 30
years. Depending on the patient's general state of health this may be tum out to
be significant.
Limitations
There are several important limitations to Framingham-derived global risk
scores:25
They are meant only for primary prevention and are invalid for patients
who already have CHD -- these patients are already at high risk and
require aggressive risk reduction.
Scores do not apply to severe forms of any particular risk factor, and they
probably underestimate risk in those situations.
Measurements were made several years ago and it is possible that the
absolute level of risk associated with a particular risk factor in the
population has changed over time.
The study population was relatively homogeneous, and estimates may not
apply to different populations
The magnitude of risk reduction achieved by modifYing each risk factor
may not equal (in reverse) the increment of risk conferred by that risk
factor.
Scores are average values and they may vary among individuals
depending on other risk factors not included in equation that might modify
overall risk.
Validity
Despite these limitations, global CHD risk scores have been demonstrated to be
valid among both white and black Americans, and they perform acceptably in
Hispanic Americans.25• 44 People of South Asian origin appear to have about
twice the absolute risk of whites when living in America, while East Asian
Americans may have a lower absolute risk than other ethnic groups in the U.S.
However, while absolute risks may be different, the relative risk conferred by risk
factors is probably similar for all ethnic groups.25
Other Factors -CHD Equivalents
Although diabetes is included in the scoring system, its presence has now been
elevated to a CHD equivalent, and therefore diabetic patients reqmre more
aggressive risk reduction than is indicated by their risk score? Although the
elevation of diabetes to a CHD equivalent is a useful clinical decision tool
because it reminds physicians that over the long-term, diabetics are at higher risk
of developing cardiovascular disease, it can also be somewhat inaccurate because
not all diabetics have a short-term CHD risk of >20%. This is particularly true of
younger patients.
The distinction is not evident, however, when using newer risk scoring tools (such
as those available through the National Cholesterol Education Program) because
these tools preclude calculation of a numerical risk once "diabetes" has been
noted. In these instances, the answer "CHD equivalent" is returned instead of a
numerical estimate of risk. Given that diabetics generally are at higher risk, the
distinction is somewhat academic for most patients, but it is worth noting.
On the other hand, peripheral vascular disease and cerebrovascular disease are
true CHD equivalents. Considering them as such underscores the fact that
atherosclerosis is a systemic disease that can affect the entire vasculature.
Patients with these disorders are automatically included in the high risk category.
The Metabolic Syndrome
Approximately 44% of American adults over 50 years old have the metabolic
syndrome (defined by the National Cholesterol Education Program [NCEP] as
three or more of the following: (!) abdominal obesity (waist circumference >40
inches for males, >35 inches for females), (2) systolic blood pressure 2': 130
mmHg or diastolic blood pressure 2': 85 or on anti-hypertensive medication, (3)
fasting triglycerides of2': !50 mg/dl, (4) HDL-C <40 mg/dl [males] or< 50 mg/dl
[females], (5) impaired fasting glucose [110-125 mg/dl]). The metabolic
syndrome is associated with an increased risk of CHD (OR 2.07, 95% CI
!.66-2.59), and the importance of its detection is highlighted in the most recent NCEP
guidelines.2' 45 Although some components of the metabolic syndrome are
included among the major risk factors used in Framingham calculations, not all
elements are accounted for, and the true risk for patients with the metabolic
syndrome may be underestimated by Framingham global risk scores?· 18• 4547
This concern has been called into question, however, by an analysis of data from
NHANES III, which suggests that Framingham scores may indeed be accurate in
patients with metabolic syndrome. In this study, the metabolic syndrome was a
significant predictor of CHD in univariate analysis. However, in a multivariable
model that included waist circumference, triglycerides, HDL-C, blood pressure,
impaired fasting glucose, diabetes, and metabolic syndrome, only HDL-C, blood
pressure, and diabetes were significant.45 This result suggests that the metabolic
syndrome is highly correlated with the traditional risk factors, and thus
Framingham scores may indeed be valid in this population.
Novel Risk Factors and New Screening Tests
Over the last decade a variety of new risk factors and screening tests for CVD
have been proposed (Table 7), and some, such as C-reactive protein (CRP), have
received wide attention in both the medical and lay press. Many of these tests
show significant promise for the early detection of CVD, and it has been proposed
that they may be useful in identifying low- and intermediate-risk patients who
need more aggressive risk reduction.48"53 However, it is not clear whether any of
these tests provide clinically useful information that cannot be derived from
screening for the traditional risk factors - especially in patients deemed to be at
either low- or high- risk for CVD.54·60
[Table 7is located at the end ofthe paper]
This uncertainty exists even with the most highly touted novel marker, CRP;
despite over 22 published studies, there is still much debate about the extent to
which it can add to the prediction of CVD risk over and above the traditional risk
factors. Most notably, a recently published large cohort study and updated
meta-analysis concluded that although CRP is indeed a statistically significant predictor
of CHD, the strength of the association is markedly attenuated when adjustments
are made for traditional risk factors.61 This study followed a recent systematic
review that also examined the evidence for CRP and concluded that the optimal
use for CRP in routine screening and risk stratification remains to be
determined. 55
L
Similar situations exist with all of the other novel risk factors and new screening
tests that have been proposed. Specifically, no controlled trials of screening for
and treating any of the novel risk factors (or using the new screening tests) have
been conducted to determine whether integration of such tests in clinical practice
makes a difference in patient outcomes. Therefore, although it is likely that some
of these risk factors and screening tests will eventually play a key role in
prevention, the most appropriate way to use them is still unclear. Cost
b
effectiveness also remains to be determined. Until these issues are resolved, the
greatest clinical benefit can probably be derived by continued focus on screening L
for and treating traditional CVD risk factors, which, as noted above, still remain
woefully under-treated in the U.S.
Is There Evidence Supporting the Use of Global Risk Scores?
As noted above, the use of global risk scores has several potential benefits:
Improved physician estimation of a patient's CVD risk
Improved identification of high-risk patients who require immediate
attention25
Improved balancing of potential benefits and harms of preventive
interventions
Ability to modify the intensity of preventive interventions depending on
h b 1. . f . k25 62 t e ase me estimate o ns ·
Motivation for both physicians and patients to overcome the clinical
inertia that often prevents an effective intervention from being initiated63'
64
Improved patient understanding of the rationale for treatment
Improved patient understanding of the individual's risk ofCVD33
Improved patient adherence to prescribed risk-reducing interventions65
Improved cost-effectiveness of risk-reducing interventions66
These proposed benefits address a number of factors that are perceived as being
responsible for the current under-utilization of interventions that reduce the risk of
CVD, Underlying all of them is the assumption that the routine use of
Framingham global CHD risk scores will lead to improved clinical outcomes,
In many ways this makes sense, It is clear that some form of risk estimation is a
requisite part of good preventive medicine, and it is also clear that both physicians
and patients have difficulty accurately estimating risk, It follows from these
observations that a tool that corrects misperceptions and raises awareness of risk
should be usefuL To some extent this appears to be the logic behind the various
recommendations for the use routine use of global risk scores,
Although this may in fact be the case, there is relatively little data on whether the
routine use of Framingham-derived global risk calculations actually translates into
improved clinical outcomes, In an era of evidence-based medicine this is a
'
t
seeming paradox: widespread support of a screening test without any evidence of
benefit. Even more interesting is the fact that this is done with the goal of
increasing the use of other evidence-based interventions. This situation likely
stems from four factors. First, as described above, the risk scores themselves are
valid predictors of CHD risk. Second, their use is associated with a very low cost
in terms of both time and money. Third, there is an assumption that no possible
harm can arise from using them, and lastly, and perhaps most importantly, there is
such an enormous underutilization of appropriate CVD risk-reducing
interventions that any tool that is perceived to be a useful remedy to the situation
is welcomed.
The goal of this paper is not to refute this line of reasoning. Rather, we hope to
shed light on the issue of whether there is evidence that the routine use of global
risk scores is in fact associated with clinical benefits. Two approaches are used.
First, the result of a systematic review of the literature in this area is presented.
L
Since it was expected that there would be a paucity of studies addressing this
issue, the systematic review was performed concurrent with a small study that
attempts to test the hypothesis that physicians make better CHD prevention
decisions when they interpret risk factor information in the context of a global
risk score than when they view the risk factor information only. The methods and
;----preliminary results of this study are presented following the systematic review.
Is the Routine Use of Global Coronary Heart
Disease Risk Scores Associated with Clinical
Benefits?
A Systematic Review of the Literature
24 of102
Methods
Questions to be reviewed:
The primary question addressed by this review is: Does routine calculation of a
global CHD risk score by physicians (as opposed to either simple risk factor
counting or no formal assessment of risk) lead to clinical benefits? For the
purposes of this review, clinical benefits are broadly defined as either (1)
improved physician adherence with evidence-based guidelines for the primary
prevention of CVD, (2) increased appropriate prescribing of risk reducing
therapies, (3) improved control of patient CVD risk fuctors (i.e. blood pressure,
cholesterol), (4) a reduction in CVD events, or (5) increased patient adherence
with therapies targeted at the primary prevention of CVD.
Given that any screening test may be associated with harm, a secondary question
is whether there are any harms associated with screening using global risk scores.
Search Strategy
We searched MEDLINE (1966- April 2004) and the Cochrane database using
MeSH terms and four distinct search strategies. This broad search strategy was
used in order to increase the likelihood of finding all pertinent studies. The search
was limited to studies in hnmans and to the English language literature.
Search strategy I: "Cardiovascular Diseases/pc [Prevention &
Control]" AND "Risk Assessment"
Search strategy 2: ("Heart Diseases" OR "Vascular Diseases") AND
"Risk Assessment" AND ("Feasibility Studies" OR Cross-Sectional
Studies" OR "Follow-up Studies" OR "Longitudinal Studies" OR
"Prospective Studies" OR "Cross-Over Studies" OR "Intervention
Studies" OR "Cohort Studies" OR "Epidemiologic Studies" OR
"Case-Control Studies" OR "Retrospective Studies" OR "Multicenter
Studies" OR "Evaluation Studies")
Search strategy 3: "Cardiovascular Diseases/pc [Prevention &
Control]" AND ("Framingham.mp" OR "Global Risk.mp" OR
"Global Risk Score.mp" OR "Coronary Risk.mp" OR "Coronary Risk
Score.mp" OR Cardiovascular Risk.mp" OR "Cardiovascular Risk
Score.mp'') AND ("Feasibility Studies" OR Cross-Sectional Studies"
OR "Follow-up Studies" OR "Longitudinal Studies" OR "Prospective
I
tStudies" OR "Cross-Over Studies" OR "Intervention Studies" OR
"Cohort Studies" OR "Epidemiologic Studies" OR "Case-Control
Studies" OR "Retrospective Studies" OR "Multicenter Studies" OR
"Evaluation Studies")
Search strategy 4: "Cardiovascular risk score$.mp" OR "Coronary risk
score$.mp"
Study Inclusion Criteria:
We included studies of any design as long as they met the following criteria: (1)
study population consisted of asymptomatic adults 2: 18 years old with no prior
history of CVD; (2) Global CHD risk calculation was specified as the primary
study intervention (multi-factorial interventions were acceptable as long as the
calculation of global CHD risk was the most prominent part of the intervention);
(3) There was clear documentation of the calculation of a global CHD risk score
by a physician or other health care provider as part of an individual patient
encounter (Questionnaire-based studies were considered acceptable as long as
they were designed to simulate clinical encounters with patients); and (4) One or
more of the following endpoints was used: (i) rates of prescribing for aspirin,
anti-hypertensive medication, or lipid-lowering medication; (ii) change in patient
blood pressure or cholesterol levels; (iii) physician compliance with guidelines for
CVD prevention; (iv) rate of CVD events (defined here as new onset
stroke/transient ischemic attack, myocardial infarction, acute coronary syndrome,
stable angina, peripheral vascular disease, carotid artery disease, or cardiac
death); (v) patient adherence with therapy; or (vi) harms of CHD risk calculation.
We considered Framingham-derived estimates preferable, however other scoring
systems were acceptable as long as they presented risk in a comparable fashion
(i.e. as an absolute risk estimate or in terms of risk categories -low, intermediate,
high). Additionally, in order to be included, studies had to provide enough
information so that it was possible to determine the method of global risk
calculation as well as the manner in which the risk assessment was used in the
clinical encounter.
Study Exclusion Criteria:
We excluded studies for the following reasons: (1) they involved children or
adolescents; (2) risk calculation was performed primarily by patients; (3) risk
calculation was performed outside of a clinical setting; or ( 4) the study primarily
addressed secondary prevention of CVD.
Data Extraction Strategy
A single reviewer determined which studies were eligible for inclusion in the
review and then independently abstracted the data from the studies into tables for
analysis. A second reviewer checked these tables for accuracy and disagreements
were resolved by discussion between the reviewers.
Assessment of Study Quality
We assessed study quality using criteria proposed by the U.S. Preventive Services
Task Force.67 Under these criteria both research design and internal/external
validity are taken into account when assessing the quality of an individual study.
Each study is given a grade based on the traditional hierarchy of evidence (I
[randomized controlled trial], II-I [controlled trial without randomization], II-2
[cohort or case-control study], II-3 [multiple time-series with or without
intervention, or dramatic results from an uncontrolled experiment], III [expert
opinion, case reports, descriptive studies]).
Additionally, grades are also assigned for internal and external validity based on a
three-category rating system (good, fair, and poor). The study grade for internal
validity is based on fulfillment of the following criteria: (1) comparable
comparison; (2) equal, valid, and reliable measurement; (3) clear definition of the
intervention; and ( 4) consideration of all important outcomes. Studies that meet
all of these criteria are graded as "good". Studies that meet most of these criteria
are graded as "fair", and studies that meet few or none of these criteria, or those
that have a fatal flaw, are graded as "poor". Similarly, the study grade for
external validity is based on the fulfillment of the following criteria: (1) study
population reflects the type and spectrum of patients that are likely to be seen by a
general practioner, and (2) study procedures reflect actual clinical practice.
Grades of "good," "fair," or "poor" are assigned in a similar fashion as for
internal validity.
Once the quality of each individual study has been assessed, the body of evidence
as a whole is taken into account. At this level the internal and external validity of
all the studies are considered in the aggregate, and the consistency and coherence
of the evidence are each assigned a grade of"good," "fair," or "poor".
Results
Search Results: We summarize the results of our May 2004 literature review in
Tables 8 and 9. Overall, we reviewed 5254 citations.
Table 8: Summary of Literature Search Results
Search Initial Number Number Number Number Strategy Number of Remaining Remaining Remaining Included in
Articles After After After Systematic Identified Review of Review of Review of Review
Article Titles Abstracts Articles
I 1196 293 3 2 2
2 3184 993 53 2 2
3 813 12 I I I
4 61 I I I I
Total 5254 1299 58 6 6
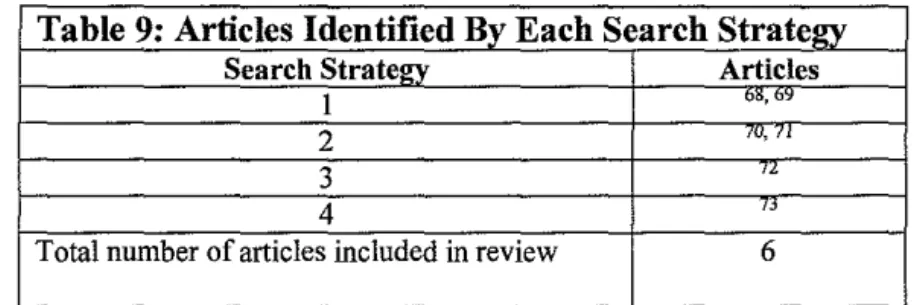
Table 9: Articles Identified By Each Search Strategy Search Strategy Articles
I
"·"'
2 7U, "IJ
3
,.
4 "
Total number of articles included in review 6
3955 (75%) were clearly not relevant to the questions of interest. An additional
1241 articles were excluded after careful review of the title and abstract. Detailed
review of the remaining 58 articles excluded 52 articles. The most common
reasons for exclusion were that the cited articles did not have an experimental
design (i.e. they were reviews, editorials, and letters) (11 articles) or that they
related to the development and validation of different risk scoring systems (23
articles). A number of studies were also excluded because they either used risk
scores as part of the eligibility criteria (for example, to limit a study population to
high risk patients) or as an endpoint, but not as an intervention (18 articles). Six
studies met our inclusion criteria and were included in our review.
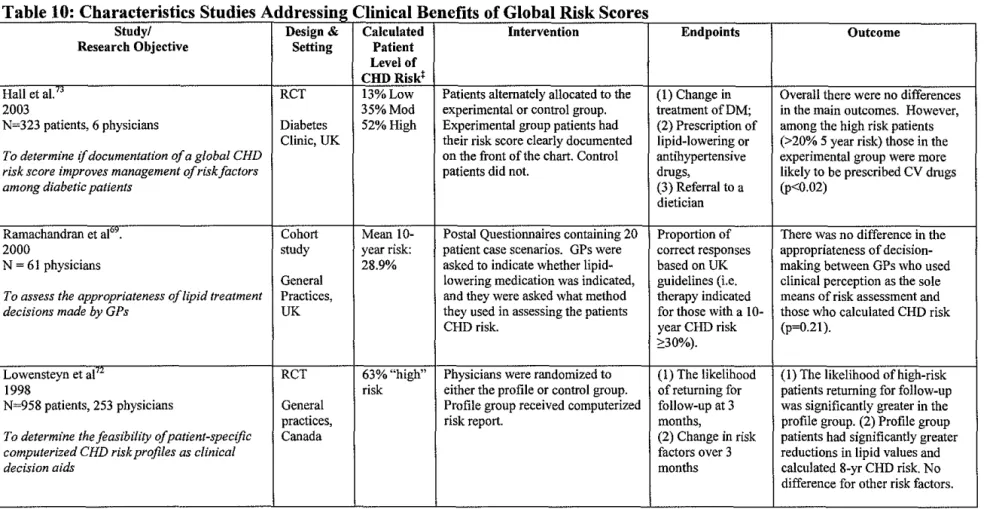
Of the six studies, four addressed whether routine calculation of a global risk
score improves clinical outcomes (Table 10).69• 71'73 The remaining two addressed
the question of whether there are harms associated with risk calculation (Table
11).68• 70 No studies directly addressed the effect of risk scores on patient
adherence. All included studies were published after 1996.
[Tables 10 and 11 are located at the end of the paper]
L '
Of the four studies that addressed whether routine use of global risk scores is
associated with clinical benefit, three were randomized controlled trials and one
was a cohort study. Three took place in actual clinical settings, whereas a fourth
study queried physicians using hypothetical patient scenarios. Three studies
(those by Ramachandran, Lowensteyn, and Montgomery) took place in a general
practice population, but the fourth (a study by Hall) was conducted in a Diabetes
referral clinic. All four studies used some form of a Framingham-derived risk
score. In two studies, risk scores were provided to the physician; in the other two,
physicians were only given the tools for risk calculation. The number of patients
and, more importantly, physicians included in each study varied widely, with the
study by Hall being the smallest (6 physicians, 323 patients) and the study by
Lowensteyn being the largest (253 physicians, 958 patients). As can be seen in
Table 10, the primary endpoints of the four studies varied widely.
Ofthe two studies that address the potential harms of using global risk scores, one
is a non-blinded randomized controlled trial and one is a cohort study. Both
studies used risk scores derived from epidemiologic databases other than
Framingham (North wick Park Heart Study; 70 British Regional Heart Study and
Dundee risk score68). However, in both instances the risk scores were presented
in a categorical format (low, intermediate, high) similar to Framingham scores.
Both included a relatively large number of patients, took place in a general
practice population, and used questionnaires to assess their endpoints (Table 11).
As shown in Table 12, study quality for both studies on the benefits and harms of global risk calculation ranged from poor to fair. Three of the four studies
addressing the clinical benefits of global risk scores received a rating of "I-fair"
and one was rated as "II-2-poor". The two studies addressing harm were evenly
split between the same ratings. Across all of the studies a major limitation in
determining both the internal and external validity of each study was a significant
lack of information about not only the study procedures, but also the baseline
characteristics of both the physicians and the patients. This lack of information
creates difficulty in assessing for important issues such as the adequacy of
randomization, confounding, and selection bias. Additionally, among the
randomized trials, blinding was only attempted in the studies by Hall and
Lowensteyn, and in both instances it is unclear if it was successful. These issues
are explored further in the discussions of each study.
[Table 12 is located at the end of the paper]
Does routine calculation of a global risk score improve clinical outcomes?
Of the four studies assessing the benefit of global CHD risk calculation, the study
by Hall and colleagues 73 provides the most direct evidence that risk calculation is
associated with a change in physician prescribing habits. The only other study that
addressed this outcome (Montgomery) examined as a secondary outcome?1
In the Hall study, six diabetologists saw 323 consecutive patients who were free
of CVD and were alternately randomized to either an experimental or control
group. For patients in the experimental group, physicians received 5-year CHD
risk scores (New Zealand risk score) on the front of the chart. They received no
such information for control patients. The primary outcomes were a documented
change in treatment of diabetes, prescription rates of lipid lowering or
antihypertensive drugs, or referral to a dietician. Overall, documentation of a risk
score did not have an effect on physician prescribing habits; however, Physicians
were more likely to prescribe a lipid lowering or anti-hypertensive drug to
patients with a 5-year CHD risk >20% (52% ofthe patients (p<0.02).
Several issues limit the usefulness of this study and result in it receiving a rating
of "!-fair". Foremost among these is that almost no baseline data about patients
or physicians was provided. This lack of information precludes knowing whether
randomization was successful and leaves open the possibility of significant
confounding. Adding to this is the fact that it is unclear whether the attempt at
blinding the physicians and patients was successful. Furthermore, the endpoint is
somewhat difficult to interpret because the only significant result came from
subgroup analysis and no information was given as to the appropriateness of the
changes in therapy. Although it can be argued that in high-risk patients increased
prescribing of lipid-lowering and anti-hypertensive drugs is often the correct thing
to do, from a decision-making standpoint, it would have been more informative to
determine whether risk scores led the physicians to make more appropriate (i.e.
guideline-directed) decisions.
The generalizability of the study is also questionable because of the small sample
size and the type of patients included. Only six physicians from a single practice
were included in the study, and it is difficult to know whether these physicians are
truly representative most primary care clinicians. Furthermore, the population
studied is not necessarily representative of the general primary care population.
These patients all had diabetes, and by U.S. standards 87% of the patients would
be considered as being at high risk (10-year CHD risk >20%). Despite this, the
types of decisions being made by the physicians are reflective of typical primary
care decisions. Similar endpoints were examined in the study by Montgomery
and colleagues. 71
In this study, patients' global risk and physicians' prescribing habits were
examined in 27 general practices in the UK (comprised of 74 physicians and 11
nurses) after physicians and nurses were randomized to receive one of three
interventions: (I) a computer-based clinical decision support system plus a CHD
risk chart (2) CHD risk chart alone (New Zealand risk chart), or (3) usual care.
Both the computer-based system and the risk chart calculated identical estimates
of 5-year CHD risk, the only difference being that the computer-based system
presented the risk numerically and the chart presented it pictorially. From within
each practice, 30 treated hypertensive patients were randomly selected for
invitation to participate in the study and a total of 614 patients attended a baseline
screening visit and were enrolled in the study. Follow-up was completed at 12
months.
After adjustment for practice computer system and for baseline CHD risk, a
similar proportion of patients in all three groups were still at high risk (5-year
CHD risk 2:10%) after one year. Therefore it appeared that providing physicians
with the tools to calculate global CHD risk did not improve patients CHD risk
beyond usual care. Interestingly, however, analysis of secondary endpoints
revealed that risk calculation was associated with lower mean systolic blood
pressure at 12 months compared to usual care group (-4.6 mmHg). Patients in the
chart only group were also more than two times as likely to be prescribed
cardiovascular drugs than were patients in the other groups (p<0.01). Although
these results did not adequately account for multiple comparisons and were
attenuated in the computer group, they suggest that global risk calculation may
affect physician prescribing and intermediate risk factor outcomes, but not enough
to move an appreciable number of people across the high-risk cut-off.
As with the studies by Hall, this study also received a quality rating of "I-fair".
The primary reason for this rating is that the study was not blinded and that too
few details were given regarding the study protocol. The former issue is
particularly important because it leaves open significant room for confounding
and bias on the part of both the physician and the patient. It is also problematic
that >25% of the patients already had CVD at baseline. Since global risk scores
are meant only for primary prevention, their use in this population is questionable.
The limited provision of data also limits the external validity of this study. No
information is given as to the types of drugs (lipid lowering, antihypertensive,
anti-anginal.. .. ) that were prescribed, and limited details are provided about
exactly how the risk chart or computer system was used (by physician or nurse;
before, during or after patient visit ... ). This lack of treatment and protocol details
makes study interpretation difficult. Additionally, as with all the studies included
in this review, these were generally high risk patients: the mean 5-year CHD risk
at baseline was 18.5% (37% 10-year risk). Despite this, the overall control of risk
factors at 12 months was surprisingly poor. For example, the mean systolic blood
pressure in all three groups was still > 150 mrn Hg. This suggests that these study
patients were not being treated to a similar standard as would currently be
expected.
Similar to the studies by Hall and Montgomery, the study by Lowensteyn72 also
focused on physician calculation of global risk scores for patients. In this study,
253 Canadian physicians were recruited from among 445 attendees at a
continuing medical education meeting on CVD risk assessment. The physicians
were randomized to either a profile group or a control group, and they were all
instructed to emoll patients between the ages of30-74 who were free ofCVD and
"in whom they thought a risk profile would be clinically useful." When a patient
was enrolled in the study, the physician and patient completed different parts of
the enrollment form (data on risk factors, etc ... ) which was then mailed to the
coordinating center. Profile physicians scheduled patients to come back in 2
weeks for their risk profile results; control physicians did not. Control patients
only received their risk profile if they returned for a follow-up visit in 3-6 months.
At the 2 week follow-up, the profile group patients were told their 8-year CHD
risk. Follow-up after that was at the discretion of the physicians and patients.
The main hypothesis of the study was that being labeled as high risk at the initial
visit would encourage physicians and patients to have a follow-up visit.
Therefore, the main outcome measure was the likelihood of a high vs. low risk
patient being seen at the 3-month follow-up. The difference in likelihood of
follow-up between the two groups was considered to represent the effect of the
risk profile. Secondary outcomes included changes in specific risk factor values
between baseline and the 3-month follow-up.
Overall, the likelihood of physicians reassessing high vs. low risk patients was
significantly greater in the profile group, which suggested to the authors that
calculation of a risk profile leads to increased follow-up of high risk patients.
Additionally, after adjustment for baseline differences, the profile group patients
demonstrated significantly greater reductions in lipid values(total cholesterol
-0.49 vs. -0.09 mmol/L) and calculated 8-yr CHD risk (-1.8% vs. -0.3%). There
was not a significant difference for other risk factors.
The conclusions of this study must be viewed with criticism. First, although 253
physicians were randomized into the study, only 51% of physicians (57% profile;
39% control) actually enrolled patients in the study. The method of enrollment
also raises the question of selection bias because physicians were instructed to
enroll patients "in whom they thought a risk profile would be clinically useful."
Combined with the broad inclusion criteria (age and freedom from CVD), these
instructions allowed significant leeway in deciding which patients to recruit into
the study. Since no data is given on patients who were screened but not enrolled
it is impossible to rule out selection bias. This is true despite the fact that baseline
patient characteristics were similar in both groups.
More worrisome however, is the exceedingly high attrition rate among study
patients. Although 958 patients were initially enrolled, only 50.6% of control and
25.8% of profile group patients actually came back for follow-up. The disparity
between groups appears to due to the study design which encouraged control
patients to come back for follow-up because the results of the risk profile were
withheld until that visit. This "encouragement" confounds the normal patient and
physician motivation for scheduling (and for actually returning for) follow-up.
The external validity of this study is hampered by the awkward study design,
which does not mimic clinical practice. In fact, it is somewhat difficult to draw a
parallel between the study scenario (patient provides risk factor information;
information is mailed to an outside agency; risk score is mailed back two weeks
later) and what actually happens in the real-world (risk score is calculated and
acted upon during a single clinic visit).
In contrast to these studies, the final study addressing the clinical utility of global
risk scores suggests that risk calculation may not be associated with a discernible
benefit. This study, however, has important differences: it is a cohort study,
which allows greater potential for confounding; it uses hypothetical patient
scenarios to address the effects of risk calculation on clinical outcomes; and it has
several flaws, which result in a poor quality rating.
In this small study Ramachandran and colleagues69 mailed questionnaires to 200
randomly selected general practioners (GPs) in the UK. Each questionnaire
consisted of 20 patient case scenarios in which CVD risk factor information was
given, and the GPs were asked to indicate what method they used to determine the
patient's risk of CVD and whether they felt that lipid lowering therapy was
indicated. The primary outcome was the proportion of correct responses based on
the UK guidelines at that time which stated that lipid-lowering therapy is
indicated in patients with a 1 0-year CHD risk> 30%. GPs were reminded of this
guideline in the cover letter that accompanied the questionnaire.
Only 61 physicians (30.5%) responded. Of these, 14 (26%) calculated a 10-year
CHD risk score (Sheffield Table), 26 (48%) solely used clinical judgment to
gauge risk, and the remaining 21 (26%) used some combination of methods.
Overall 62.1% of decisions were in accordance with the guideline; however, there
was no difference in the appropriateness of decision-making between GPs who
used clinical perception as the sole means of risk assessment and those who used
the Sheffield table either on its own or in conjunction with other methods
(p=0.21).
While interesting, this study received a quality rating of "II-2-poor" for a variety
of reasons. Foremost among these are the extremely low response rate and the
fact that physicians were not randomized as to the method of risk determination
used. Both of these introduce the possibility of significant confounding.
Additionally, the low response rate suggests that the study likely does not have
enough power to detect a significant difference in the primary endpoint. This is
difficult to determine because no sample size calculations were reported. Lastly,
since no information is given on physician characteristics it is impossible to
determine if the physicians included in the study reflect the average general
practioner.
When these four studies are examined in aggregate the quality of the evidence
supporting a clinical benefit to the routine use of global risk scores is poor to fair.
Given that the no meaningful conclusions can be drawn from Ramachandran
study, the overall evidence quality is pulled towards fair. However, this is
counterbalanced by the fact that of the remaining three studies, only the small
study by Hall directly addresses the question of interest. While the studies by
Lowensteyn and Montgomery both provide some evidence of a benefit associated
with the use of global risk scores, neither addresses the routine use of risk scores
as they would be expected to be used in practice. Additionally the lack of
treatment details in all three studies creates difficulty in establishing a fully
credible linkage between the use of risk scores and the modest clinical benefits
seen in each study. Additional difficulty in drawing a conclusion is introduced
because the Hall study, which represents the most direct evidence, only included
six physicians. In terms of physician sample size this is significantly outweighed
by the Lowensteyn and Montgomery studies.
Are there harms associated with screening nsing global CHD risk scores?
Two studies directly address whether CVD screening using global risk scores is
associated with adverse psychological outcomes. Both studies suggest that there
is not any significant harm. However, both are marked by several flaws which
limit their validity.
Connelly70 performed a prospective cohort study of 5772 men in which all
participants underwent CHD screening and were informed of their level of CHD
risk based on an algorithm derived from the Northwick Park Heart Study. The
men were not told their risk level at the initial screening; rather they were later
sent a letter that informed them of their personal risk for CHD (categorized as
low, moderate, or high). Men deemed to be at "high" risk were seen back for a
follow-up appointment during which they were able to discuss the results. The
letters sent to men deemed to be at "moderate" risk included general advice about
the particular risk factor that was elevated; however no follow-up appointment
was offered. The "low" risk men were simply sent a letter stating that they did
not have any special risk for CHD.
Psychological symptoms in all ofthe men were assessed at the baseline screening,
at the time that they were informed of their risk level, and again at three months.
Overall, men who were labeled as being at either "high" or "low" risk showed a
decrease in their psychological symptoms after labeling. Interestingly, the men
who were labeled as "moderate" risk actually had an increase in psychological
symptoms. Taken together, this result appears to suggest the intuitive conclusion
that if information about elevated risk is not accompanied by appropriate support,
there may some degree of increased anxiety among patients.
This study received a quality rating of "II-2-fair" based on several factors. The
primary internal validity issues were that the study was uncontrolled and not
blinded. Additionally, not enough details were provided about the risk score and
what went on at the screening and follow-up visits. When coupled with a 25%
drop-out rate, these issues raise questions about the strength of the evidence
provided by the study that even the large sample size does not completely
outweigh. The generalizability of the study is hampered by a lack of details about
the interventions and by the nature and clinical significance of the "psychological
symptoms" experienced by the patients.
Despite being a randomized controlled trial, the study addressing harms by
Marteau and colleagues68 is fraught with such a substantial omission of
information that it is very difficult to use in drawing conclusions. This study
randomized approximately 3000 couples to a screening or a control group. The
screening group couples underwent psychological and CHD screening, including
an estimate of their global CHD risk. They were then counseled on ways to
reduce CHD risk, and they were offered follow-up at a frequency commensurate
with their level of risk (more frequent follow-up for higher risk patients). Control
patients did not undergo any screening until the one year mark, at which time they
underwent the same procedure as the screening group. The primary outcome was
a comparison of the perceptions of health, the risk of suffering a heart attack, and
the ability to reduce that risk in the intervention and the control groups at 1 year.
Overall, the study results suggest that participation in a screening program
including calculation of a CHD risk score was not associated with adverse
concerns about health, but that it may be associated with a sense of less control
over one's own personal risk.
Exceedingly few details were provided regarding several key issues, including the
screening and enrollment process, randomization, attempts at blinding, baseline
patient characteristics, content of follow-up visits, and treatments that were
undertaken. Additionally, the clinical relevance of the questionnaire measures is
unclear. Taken as a whole, these omissions make it impossible to rule-out a
variety of sources of bias and confounding. Therefore the study received a quality
rating of"I-poor".
In aggregate, there is poor to fair evidence that global risk scores are not
associated with significant psychological harms. The large sample size of the
Connelly study bolsters the "fair" rating, however given that it is only a single
study it is difficult to draw any firm conclusions.
Discussion
Despite calls for widespread use of global CHD risk scores as a clinical screening
tool there is a paucity of literature supporting the numerous theoretical benefits
associated with such screening. The majority of the literature on global risk
scores currently relates to the development and validation of different risk scoring
systems. This review highlights the fact that not much research has been done to
elucidate the actual clinical benefits that can be expected if clinicians adopt global
CHD risk scores into their everyday practice.
Based on the available studies reviewed in this paper, there is fair to poor
evidence that the routine use of global CHD risk scores may be associated with an
increase in the prescribing of cardiovascular drugs to high risk patients and
possibly with improved control of blood pressure and cholesterol levels.
However, even excluding the one poor quality study, the small number of studies
with disparate outcomes and the relatively small number of physicians included in