"sy^^sB'ws'ff
TABLE OF CONTENTS
LIST OF FIGURES...ii
INTRODUCTION...1
THE NEED FOR dMAPS...4
DMAPS DATA STRUCTURE...9
DATAFILE FIELD STRUCTURES...15
Blblio Datafile Source Datafile Cond Datafile
Sample Datafile
Polll Datafile PROGRAM SEARCH LOGIC...24Single Datafile Searches
Multiple Datafile Searches USER INTERFACE SCREENS...30Mainmenu Screen Search Parameter Selection Menu Menu-type Selection Screen Free-Entry Screen
Bibliography Display Screen
Data Summary Screen One D.ata Summary Screen Two Data Output Screen One VIEWING DATA...,39ENTERING DATA...42
CONCLUSIONS AND RECOMMENDATIONS...,...46
APPENDIX A:
Program Structures and Relationships...A-1
APPENDIX B:
Program Coding...I
APPENDIX C:
LIST OF FIGURES
DATA SEARCHING AND DATAFILE STRUCTURE
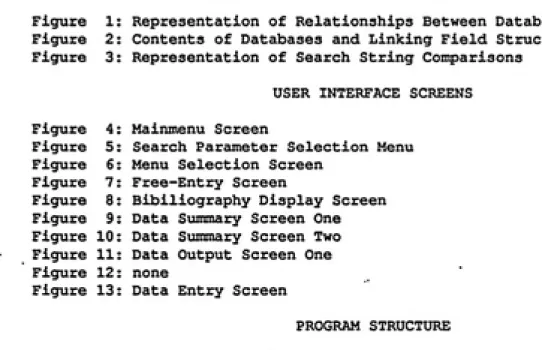
Figure 1: Representation of Relationships Between Database Records
Figure 2: Contents of Databases and Linking Field Structure
Figure 3: Representation of Search String Comparisons
USER INTERFACE SCREENSFigure 4:
Figure 5:
Figure 6:
Figure 7:
Figure 8:
Figure 9:
Figure 10:
Figure
11:Figure 12:
Figure 13:
Mainmenu Screen
Search Parameter Selection Menu Menu Selection Screen
Free-Entry Screen
Bibiliography Display Screen
Data Summary Screen One
Data Summary Screen Two
Data Output Screen One
none
Data Entry Screen
PROGRAM STRUCTURE
Figure 14: Tree Diagram of Program Structure
Figure 15: Relationship Between Selected Programs
Int roduct ion
One of the most frustrating aspects of dealing with Indoor Air
Pollution is the difficulty in acquiring information linking
pollutants and specific source materials. Although there has been
considerable research done in this area, the field of indoor air
pollution is so new that it is often difficult to find relevant
scientific articles dealing with this subject. Even with access to
large university research libraries and on-line computer
bibliographic databases it is very difficult to find articles dealing
with indoor air pollution in general, and in particular those dealing
with specific air pollutants and their sources.
Unfortunately, it is often the people who need these data most that
have the least access to even these difficult to use resources.
Architects, policy makers, builders, and Industrial Hygienists
frequently have neither the hardware, time, expertise nor funds to do
a comprehensive search for this type of data. On-line database
access charges alone could run into the thousands of dollars before
receiving the first list of applicable information. As a result, it
is not expected that present on-line databases can offer adequate
resources to these people in the area of indoor air pollution
sources.
The recent proliferation of powerful desk-top personal computers and
corresponding advances in software for these computers have made it
possible to design and implement a stand-alone computerized database
from scientific research concerning thousands of source-pollutant
relationships can now be made available in a form that allows not
only for the presentation of the bare-bones pollutant-emission data,
but also for a comprehensive summary of research methods, test
conditions, analysis methods, and bibliographic references. With the
ec[uipment that is available to almost any office today, a thorough
and comprehensive database of indoor air pollution source evaluations
can be put in the hands of anyone who would find it useful.
In a recent publication J. Crum of the US EPA at Research
Triangle Park, NC introduced the concept of a computer program to
accomplish these goals and an actual program called Indoor Air Source
Emissions (lASE) database.^^) This program was written in
dBase JJjf^] and was intended for use with IBMf^^ and compatible
personal computers. Although demonstrating an approach to finding
and utilizing the broadly based literature on indoor air emission
sources via personal computer, the program had.serious flaws. It was
felt that much could be done to increase the speed and versatility
of such an indoor air pollution database system. This paper reports
on progress toward these goals at UNC.
In order for any database of indoor air pollution source data to
be most useful, it was decided that it should meet several goals:
1) It should be useful to users with a wide range of interests,
including researchers, architects, policy makers,
manufacturers, builders, designers, and modelers.
2) It should be as widely accessible as possible. This has
combination of relational database management system and
computer hardware to accomplish this goal.
3) It must be able to satisfy a broad range of needs. For
exanple, some users may be interested only in bibliographic
information, whereas others may wish to use the retrieved
data to analyze specific indoor air pollution problems.
4) The system must be "user friendly"; i.e., uncomplicated and
undaunting to operate. This allows the data to be accessible
to persons whose training is in areas other than in the use
of computers.
5) Since it is anticipated that the amount of emission rate
data will grow rapidly in the near future, the database must
be easy to update and modify. Easy data entry also helps to
minimize entry errors, another important consideration.
With these design goals in mind, a database containing source
specific data from research articles has been compiled, along with
controlling computer programs which will allow for quick and easy
access to this indoor air pollution data. This database system has
been titled dMAPS, the database of Micro-environmental Air Pollution
Sources. The remainder of this paper describes dMAPS' function,
The need for an Indoor Air Pollution DateJsase
In recent years the recognition that non-occupational indoor
environments may contain air pollutants in concentrations which may
be harmful to human health has led to increased interest in the
recognition and identification of the sources of these pollutants.
The trend toward home and office designs which employ energy
conservation techniques such as tight construction, weatherization,
and reduced ventilation has led to an increased opportunity for
acciomulation of air pollutants produced within these structures.
Identification and measurement of low level pollutants in
non-industrial indoor air can be extremely difficult. These pollutants
are not associated with specific manufacturing processes as they are
in the industrial environment, but are instead produced by common
materials within the environment itself. Since they are usually
present in concentrations far lower than the recognized acceptable
levels for occupational exposures they are not readily detected using
traditional Industrial Hygiene sampling methods. Since extremely
sensitive and expensive collection and analytical techniques must be
employed to determine the concentration of a typical indoor air
pollutant, it is very important to identify the most probable
pollutants present before sampling is begun. The 'shotgun' approach
to sampling and analysis is not appropriate because of the large
number of compounds present in most indoor air, and the difficulty in
determining which of these common low-level pollutants may be the
The Industrial Hygienist traditionally uses the
Recognition-Evaluation-Control strategy in determining the proper sampling
strategy in an industrial environment. In an orthodox industrial
environment the Industrial Hygienist typically evaluates
manufacturing processes, recognizes the pollutants which may be
emitted in these processes, and then recommends control strategies.
Indoor air pollution complaints in a non-manufacturing occupational
environment produce a different set of problems which the Industrial
Hygienist often finds difficult to approach. The
Recognition-Evaluation-Control method is often short-circuited in the recognition
stage since there are no manufacturing processes from which obvious
pollutants may be identified. It may be for this reason that
Industrial Hygienists often find it difficult to determine a logical
starting point to deal with indoor air pollution problems.
Because most indoor air pollutants are generated by materials both
within and comprising the building's structure, one approach to
evaluating indoor air pollution levels is the treatment of physical
materials in the indoor environment just as if they were small
manufacturing processes. Treating them as such re-establishes the
recognition, evaluation, and control procedures familiar to
Industrial Hygienists. Thinking of the various materials in the
environment as pollution producing processes requires only that each
material be associated with the pollutants that it may produce. Once
of formulating an indoor air pollution sampling strategy more
manageable.
The dMAPS system has been designed to offer a starting point for the
evaluation of indoor air pollution by identifying pollutants which
have been shown to be associated with specific source materials.
Data from published scientific articles dealing with definite
pollutant/material relationships have been included in the dMAPS
database which at this time includes almost 2,000 of these
relationships.
As a further assistance in formulating a sampling strategy, the
Industrial Hygienist may make use of dMAPS' features for display of
information such as test method, analytic method, emission and
environmental data for any pollutant/material relationship within the
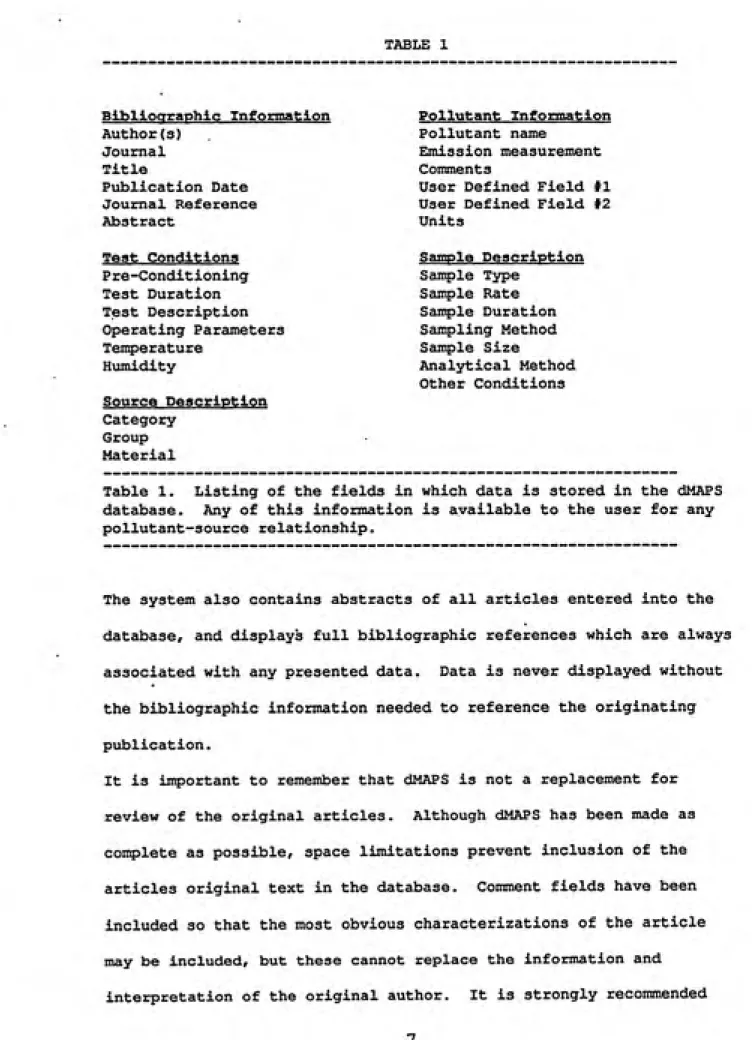
database. Table 1 details the data types in the dMAPS database that
TABLE 1
Bibliographic Information
Author(s)Journal
Title
Publication Date Journal Reference
Abstract
Test Conditions
P re-Condit ioning
Test DurationTest Description
Operating Parameters
TemperatureHumidity
Source Description Category
Group Material
Pollutant Information
Pollutant name
Emission measurement
Comments
User Defined Field #1 User Defined Field #2
Units
Sample Description
Sample Type Sample Rate
Sample Duration
Sampling Method
Sample Size
Analytical Method
Other ConditionsTable 1. Listing of the fields in which data is stored in the dMAPS
database. Any of this information is available to the user for any
pollutant-source relationship.
The system also contains abstracts of all articles entered into the
database, and displays full bibliographic references which are always
associated with any presented data. Data is never displayed without
the bibliographic information needed to reference the originating
publication.
It is important to remember that dMAPS is not a replacement for
review of the original articles. Although dMAPS has been made as
complete as possible, space limitations prevent inclusion of the
articles original text in the database. Comment fields have been
included so that the most obvious characterizations of the article
may be included, but these cannot replace the information and
that the original articles be reviewed before final decisions are
made on indoor air pollution control strategies, or before data from
dMAPS Structure
Data in the dMAPS programs are contained in five datafiles. Each of
these datafiles holds data concerning a particular type of data. For
example, the SOURCE.DBF datafile holds data concerning source
materials which were evaluated for emissions, while the BIBLIO.DBF
datafile holds data concerning the bibliographic information about
the publication from which the data have been collected. The
information in these five datafiles is related to the others by key
fields.
Each datafile contains units called records. In the Biblio datafile
each of these records contain several types of information (Authors,
Journal, Article Title, and Publication date) about one particular
publication. If information has been entered for forty different
articles, there will be forty records, each having information about
a different article. There is an additional field in each record,
unique for each record and normally invisible to the user, which
contains a unique identification number for each article.
Information about sources of indoor air pollutants are held in the
Source datafile, just as bibliographic information is held in the
Biblio datafile. However, each record in the Source datafile also
contains a small piece of the Biblio datafile: the ID number of the
article in which its data was found. Therefore, any published
article listed in the Biblio datafile which deals with several source
which have its ID number. Conversely, due to their common ID
numbers, any specific record in the Source datafile can immediately
be associated with its parent record and all the parent records' data
in the Biblio datafile.
This type of structure means that for every record in the Source
datafile, and therefore every piece of data in the Source datafile,
it is possible to immediately have access to all of the information
about its bibliographic origin held in the Biblio datafile. It is
this type of ID number linking which associates every piece of
information in all five datafiles with the information about its
publication article.
Since the dMAPS database contains five datafiles, the relationship
between them becomes more complex than the example above. Each of
these datafiles is related only to the datafile above and below it.
The Source datafile for example, is related to.the Biblio datafile as
described above, but is also related to the Cond datafile in exactly
the same way that the Biblio datafile is related to the Source
datafile. In other words, each record in any datafile is related to
one and only one parent record in the datafile above it. In turn,
that parent record is related to only one grandparent record in the
datafile above it. This chaining continues until the topmost
datafile Biblio is reached, which contains the most general
information associated with any piece of data. This chaining allows
every individual record in any of the datafiles to have constant
access to all of the more general information concerning it which has
Subset of matching records, Pom .DBF Pollutant Measurement
Units
Exponent
User Field 1 User Data 1
User Field 2 User Data 2
Comment 1 Total records of BIblio.DBF Authors
1 1
1
1 Title 1
1 Journal 1
1 Reference |
Publication
1 Date 1
'T---Subset of matching records,
Cond.DBF Conditioning "h.
Material Size
Test illl
Duration ^j^
Ventilation III
Rate III
TestDescription |||
Other
Conditions |||
Operating |||
Parameters |||
Temperature
Celsius
Subset of matching records,
Source.DBF
r- Group
Category
MaterialSubset of matching records,
Sample.DBFSample Type Sample Size
Sample Rate
Analytical
Method
Sample
Duration
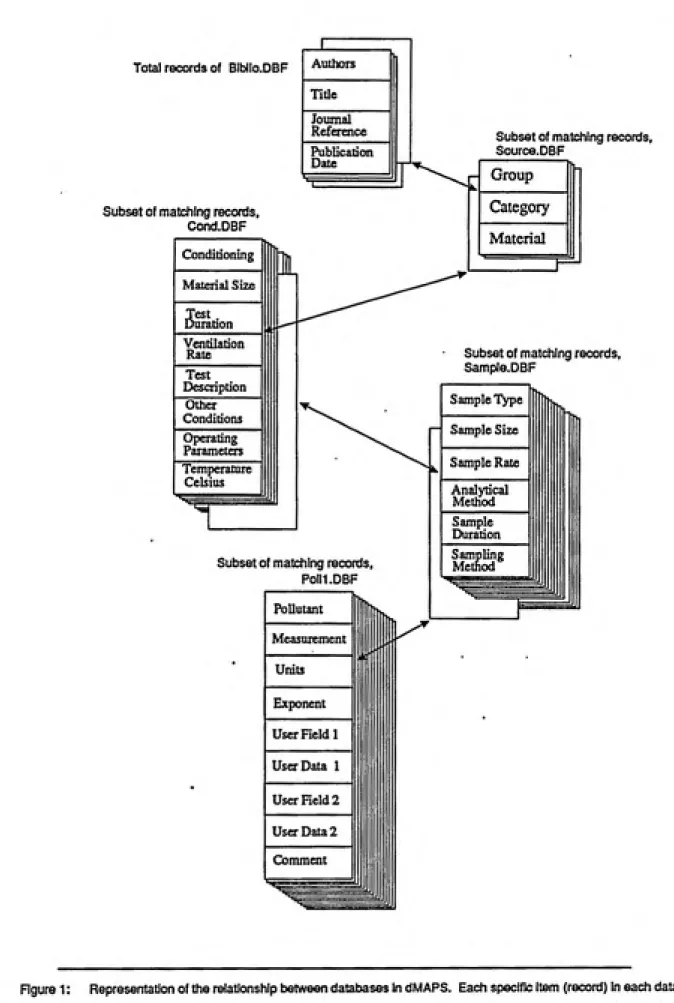
Figure 1: Representation of the relationship between databases in dMAPS. Each specific item (record) In each database
is associated to related records in ttie database immediatley below it This staicture allows information to be related in data
searches from general to specific; or once specific items are selected by the user, upward, from specific items to their general
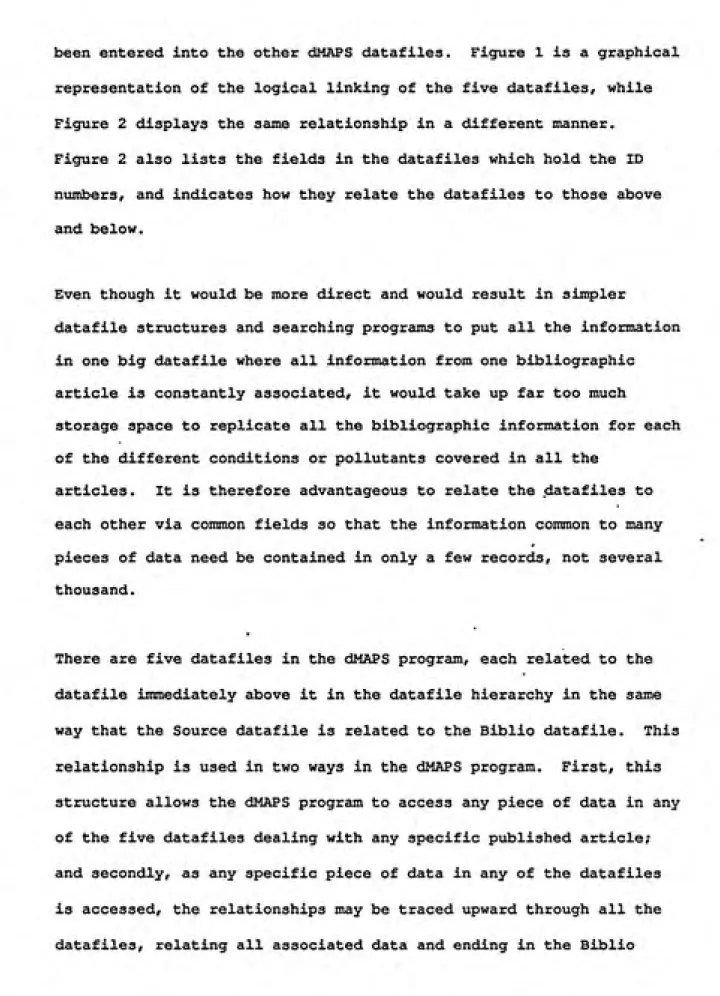
been entered into the other dMAPS dataflies. Figure 1 is a graphical
representation of the logical linking of the five datafiles, while
Figure 2 displays the same relationship in a different manner.
Figure 2 also lists the fields in the datafiles which hold the ID
numbers, and indicates how they relate the datafiles to those above
and below.
Even though it would be more direct and would result in simpler
datafile structures and searching programs to put all the information
in one big datafile where all information from one bibliographic
article is constantly associated, it would take up far too much
storage space to replicate all the bibliographic information for each
of the different conditions or pollutants covered in all the
articles. It is therefore advantageous to relate the datafiles to
each other via common fields so that the information common to many
pieces of data need be contained in only a few records, not several
thousand.
There are five datafiles in the dMAPS program, each related to the
datafile immediately above it in the datafile hierarchy in the same
way that the Source datafile is related to the Biblio datafile. This
relationship is used in two ways in the dMAPS program. First, this
structure allows the dMAPS program to access any piece of data in any
of the five datafiles dealing with any specific piablished article;
and secondly, as any specific piece of data in any of the datafiles
is accessed, the relationships may be traced upward through all the
datafiles, relating all associated data and ending in the Biblio
datafile with the associated data concerning the originating
publication.
BEBUO.DBF SOURCE.DBF CX3ND.DBF SAMPLE.DBF POLLl.DBF Abstract 10 Tu3io 150 Tifle 200 Publication Date DltB Journal Reference
refer 150
msa
:lliiiii0^i
Group Category 30 Material 60Source^no
Pre-Craditioning pce^condi 40 Material Size mtjtize 35 Test Duration lHt_dar 35 Ventilation Rate weoCnte 20 Test Description 50 Other Omditions other_coDd Operating Parameters OpCf.JT 150 Temperature CelsiusIBmp_deg_c 10
% Relative
Humidity
rel humid 10
Cond no
Sample
Periodicity
sampLpBT 30
Sample Size
sampLsin 10
Sample Rate sampl_rflSe 30 Analytical Method ilytic 70 Sample Duration nmpl.diir 20 Sampling Method
sunpLmeth 70
WM
5ainp_^no |
Pollutant30 Measurement i
TTiffttnuyt i^i 'iX 30
Units
10
Exponent
2 User Held 1
meil m
User Data 1
merdatil 20 UsCTField2
11KI2 10 User Data 2
U9erdata2 20 Comment 1
1501
Figure 2: Contents of the five dMAPS databases and their Uniting fields. Each shaded field at the bottom
of each database column is unique in that database, but is not unique in the following database. For
example,-the Cond_no field in COND.DBF will have only one record with a value of 4, while example,-the Cond_no field
The following are descriptions of the data fields contained in
the dMAPS program databases. The dMAPS program contains five
databases, BIBLIO, SOURCE, COND, SAMPLE, AND POLLl. The numbers
enclosed in parentheses after every field name indicate the niimber of
spaces allocated in the database to that field. It is this data
which is related by key fields in the manner previously described.
Field names which are prefaced by an asterisks are fields which may
be used for searches of the data.
BIBLIO DATABASE
This database deals with the information concerning the
published article in which the data was found. All data in the other
databases ares associated with a parent article contained in this
database.
Abstract (10)
This is a special field in dBASE III called a memo field.
Employed in every BIBLIO record, it allows large descriptive
narratives to be associated with each individual record with
out taking up large amounts of storage space. In this case the
field contains the abstract of the published article associated
with the record being viewed. The abstract is physically
located in the file BIBLIO.DBT, but is linked to the database
via this field.
*Authors (150)
This field holds the names of the authors of the article.
Listed in the order in which they appeared on the original
article heading, all authors are listed except when the length
would exceed the 150 character maximum length.
Title (200)
The original title of the article, book, or publication as
presented in the original publication.
*Date (4)
The year the article was originally published.
Refer (150)
This field holds information concerning the reference
publication from which the article was gathered. As well as
the publication, other reference information is included in
this field such as reference publication volume number and the
pages the article occupies in the publication.
The previous four fields, when appended together by the dMAPS
program, form a classical bibliographic reference: Authors, Title,
Journal Reference, and Publication Date.
Biblio_no (4)
The number linking this database with the source database, and
indirectly with all four other databases. Each bibliography
record in the Biblio database receives a unicjue biblio_no which
associates all data throughout the database with its original
journal article. See Figure 1 for the ranking of the
databases.
SOURCE DATABASE
This database has information concerning the indoor air
pollution source classes.
*Group (15)
This is the broadest division for indoor air pollution sources
and generally includes such classifications as Water,
Combustion, Consumer Products, and Structural Materials.
*Category (30)
This classification is somewhat more specific than Group, but
still is related to broad types of indoor air pollution
sources. Types of entries in this area are Textiles,
Insulating Materials, Plastics, and Applied Coatings.
*Material (60)
This field is the classification that deals with the most
specific sources of indoor air pollutants, and includes
specific source'materials such as Plywood, Paint, Carpet, and
Cigarettes.
Source_no (4)
Unique for every record in this database, this field value
associates each record in this database with several associated
records in the next ranking database, COND. See Figure 1 for
the ranking of the databases.
Biblio_no (4)
A field containing the bibliography nvimber from which the
record is associated. Many records in this database may share
the same biblio_no.
COND DATABASE
Information concerning the experimental conditions are contained
in this database. Either material condition or environmental
condition factors effecting emissions from are in this database.
Pre_Condi (40)
Any pre-conditioning of the source material before the
beginning of the test is entered here.
Test_dur (35)
The test duration is entered here. This is not the same as the
sampl_dur field in the sample.dbf, which is the duration of the
sampling activity, but is the duration of the entire test under
any particular condition.
Test_desc (50)
A short verbal test description, including any information
which may be useful to the dMAPS user.
Oper_par (37)
Any operating parameters, environmental or otherwise, which may
have had an effect on the outcome of results of the test.
Temp_Deg_C (30)
The tenperature in degrees Celsius under which the test was
conducted.
Rel_bunild (10)
The percent celatlve humidity under which the test was
performed.
Vent_rate (20)
The ventilation rate of the material during the time the
measurements were being taken, or during the time of the entire
experiment, whichever is more appropriate.
Mat_size (35)
Material size, the surface area or any other measurement
identifying the amount of material evaluated.
Other_Cond (150)
Any other operating conditions which may be of use in
evaluating the data. Any special conditions of the test,
special environmental conditions, or comments about the test
are included in this field.Cond_no (4)
Unique for every record in this database, this field value
associates each record in this database with several associated
records in the next ranking database, SAMPLE. See Figure 1 for
the ranking of the databases.
Biblio_no (4)
A field containing the bibliography number from the previous
ranking database with which the record is associated. Many
records in this database may share the same biblio_no.
SAMPI£ DATABASE FIEIJ3S
This database holds information concerning sample collection
procedures and analytic methods.
Scut^l_Per (30)
This is the sample periodicity: Continuous, Periodic,.
Integrated, etc.
Sanipl_Rate (30)
This field lists the sampling rate at which the pollutant was
measured, such as liters/minute.
Sampl_Dur (20)
The sasple duration, the length of time a sample was taken for
evaluation of the emissions from a particular
material/condition combination.
Sampl_Meth (70)
This is the method used to collect or measure the pollutant
emitted by any particular source material. The sanple method
includes entries such as charcoal tube, direct reading
colorimetric tubes, or impinger collection into distilled
water.Sairpl_Size (10)
SaxaplB size, the amount of sample taken for analytical
measurement. This is not the statistical sample size, nor is
it the size of the material from which pollutants were
measured.
Analytic (70)
The analytic method used to determine the concentration of
pollutant collected in the sample device. When direct reading
instruments are used to determine the pollutant concentration,
this field can be the same as the sample method or the method
that the direct reading instrument uses to determine
concentration.Samp_no (4)
Unique for every record in this database, this field value
associates each record in this database with several associated
records in the next ranking database, POLLl.
Cond_no (4)
A field containing the condition number in the previous ranking
database with which this record is associated. Many records in
this database may share the same cond_no.
POLLl DATABASE
This database contains information concerning the final test results,
including measured emissions for every pollutant in the database.
Also included here are the user defined labels and data fields, and
specific comments concerning any individual pollutant and its test
condition.
*Pollutant (30)
This is the chemical name of the pollutant that was evaluated
under the conditions of the experiment.
Measuremnt (30)
The air concentration of the pollutant emitted by the source
material being tested.
Units (10) ͣ
The units of concentration of the pollutant measured as
reported by the original article. This may be in PPM, Mg/m3,
or any other appropriate units. If both CGS and English units
are reported, CGS units are preferred.
Exponent (3)
When measured concentration is extremely large or extremely
small, there may not be enough room in the measuremnt field to
accommodate these numbers. If this is the case the exponent
field may be employed to allow meaningful entries in the
measuremnt field.Comment (150)
This comment field is associated with each
pollutant/measurement value and is available for detailed
description of how this particular test or condition is unique.
Userdatal (20)
This is one of two user definable fields, and is called the
User Defined Label in the data entry screen. The user may
enter any label into this field, and associate any data with it
in the Userl field, which is called Data in the entry screen.
Any type of information or comment concerning this pollutant
and this condition may be entered in these fields.
Userdata2 (20)
Second of two user definable fields.
Userl (10)
The data field associated with the Userdatal field which
contains its label.
User2 (10) ͣ
The data field for the Userdata2 label.
San^_no (4)
A field containing the sample number which associates records
in this database with a particular sair55_no from the previous
ranking database, SAMPLE. Many records in this database may
share the same samp_no.
DESCRIPTION OF PROGRAM SEARCH LOGIC
The dMAPS program allows searches of the database on seven key
fields. These fields are Group, Category, Material, Pollutant,
Authors, Date of Publication, and Journal title. The Group,
Category, and Material fields allow searches for data associated with
indoor air pollution sources, while the Pollutant field allows
searches for specific pollutants. The Authors, Date, and Journal
fields allow searches for data associated with specific published
articles.
The program also allows any combination of these fields to be
searched simultaneously. For example, the user may query the program
to find all information concerning the emission of the pollutants
formaldehyde and hexane from the source material carpet.
The five separate databases in the dMAPS data section are related to
the others through identifying fields (Figure 2). Although this type
of structure requires a complex data relation formula, it is
necessary to use this technique to save disk storage space. A more
detailed description of database relationships in dMAPS is given in
the dMAPS Structure section.
Although there are five databases in dMAPS, searchable fields are
found in only three of them. The Author, Date, and Journal fields
are located in the BIBLIO database. Pollutant is located in the POLLl
database, and Group, Category, and Material are in the SOURCE
database. Which databases are searched depends upon the user's
search criteria. If the user picks only a pollutant, dMAPS will
search only the POLLl database, while if the user picks a date and a
pollutant, the program will search the POLLl database and then the
BIBLIO database finding information meeting the user's search
criteria in each. As matching information is found in each database
r
the program assembles a character string identifying which published
article is associated with the match. After the searches are
complete these strings are then compared according to the logic
operators the user has specified.
Single Database Searches
The internal programming algorithms used to search for user queries
has been written to provide the speediest search possible. In order
to provide this fast search, the program begins searching every
record sequentially until a match is found, and then "remembers" the
article from which the data came. The program then resumes the
search. To speed the search however, the program now ignores all
records associated with that article. This is useful since once an
article is identified as containing information of interest to the
user it is redundant and time consuming to repetitively re-identify
it.. As other matches are found at other locations in the database,
these new article ID numbers are also remembered and subsec[uently
ignored.
At the end of the search, these "remembered" article numbers are used
to allow the data display portion of the dMAPS program to quickly
jump between sections of the database which contain information
concerning the user's needs. Areas which are not associated with the
user's search criteria are quickly skipped. For exaiqsle, if article
number ten was the only article which dealt with the user's query,
then only the data derived from that article will be accessed.
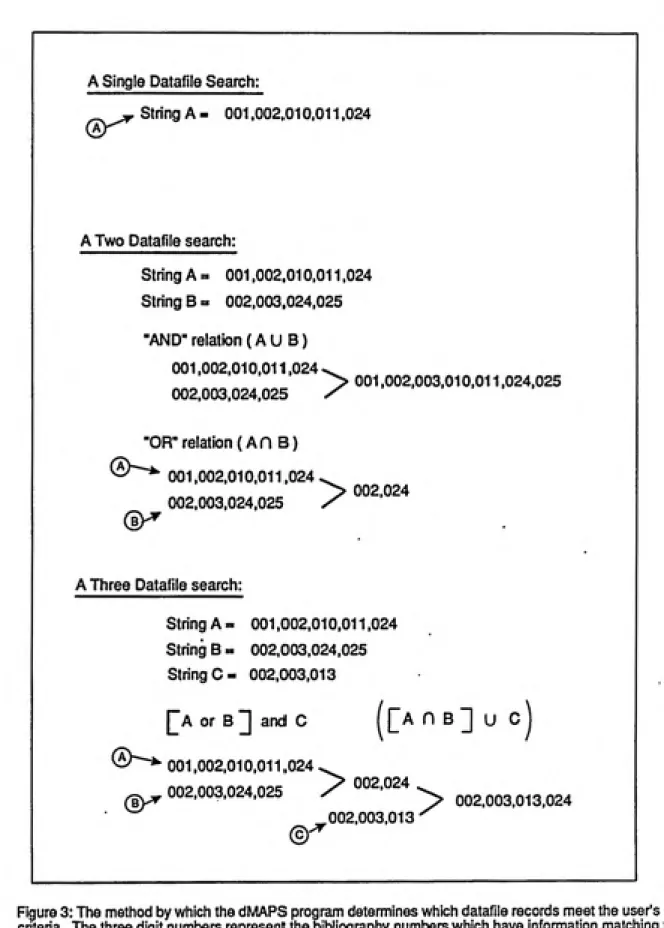
Multiple Database Searches
If a user specifies two search fields that are in separate databases,
the above procedure is carried out with each database. The result is
String A containing the ID numbers of the articles matching the first
criterion, and String B containing the ID numbers of the second
criterion. The program is then able to evaluate the interaction of
these two strings via any logical operator the user has specified.
See Figure 3.
If the logical operator is "OR", as is the case when the user
requests information concerning CARPET Q£_ FORMALDEHYDE <A union B)
String A is compared to String B and duplicate ID numbers are
deleted. A third string. String C, is then created containing all of
the ID numbers from both strings. This operation, A union B, is
performed in the program COMPOR.
If the logical operator is "AND" ( A intersect B) the program
determines which article ID niombers are common to both strings. This
results in a String C which contains ID numbers for articles which
have information concerning search criteria A and search criteria B.
Comparison for A intersect B is performed in the COMPAND program.
When three different databases are searched, the process is nearly
identical. In this case however, when string A is coit^ared to string
B the result is stored to a new string A. The string from the third
database is coir^iled, stored to a new string B and then compared to
A. When the program has searched through all the appropriate
databases, the final stored string contains a list of all articles
which contain information about the user's search criteria. Although
this sounds complicated, it practice it is quite straight-forward as
can be seen in Figure 3.
The above searching method speeds operation of the search in two
ways. First, skipping records is much faster than evaluating them to
determine if they match a search criteria, and secondly, this method
allows several databases to be searched and the logical relationships
between the databases found without linking them on common key
A Single Datafile Search:
^j^ String A = 001,002,010.011,024
A Two Datafile search:
String A = 001.002,010,011.024
String B = 002,003,024,025
"AND- relation (A U B)
001.002.010,011,024,^
> 001,002,003,010,011,024,025
002.003.024,025 /
"OR" relation (An B)
(5)^
001.002,010,011,024
002,003.024.025
^ 002.024
A Three Datafile search:
String A = 001,002,010,011,024
String B = 002,003,024,025
String C= 002,003,013
[^A or B ]] and C f []a n B ] U C
^^^^^^ 001,002.010,011.024 ^
002,003,024,025 7 °°2.024 ^ ^^2.003.013.024
ͣ
002,003.013"'^
Figure 3: The method by which the dMAPS program determines which datafile records meet the user's
criteria. The three digit numbers represent the bibliography numbers which have information matching the
individual search criteria. The matching articles are listed as strings A, B, and C which are compared
fields. Normally, searches conducted on databases constantly linked
by common key fields are the easiest way to search multiple databases
in dBASE III Plus, but the method is very slow since the pointers in
each linked database must be updated every time the pointer is moved
in any of the databases. In dMAPS this would requires opening and
closing of each of the five databases in turn to move the pointer.
Even though it is done automatically, the opening and closing of
these databases takes considerable time in large databases. The
method used in dMAPS uses key fields between databases, but does not
link the databases together. Comparisons are performed after each
database has been searched.
In summary, in order to make searching of the dMAPS databases as fast
as possible a dedicated searching program was developed to search
each database separately, compile lists of matching records in each
database, and then to logically coit^are these lists against each
other. The result is a list of articles which contain information
related in the manner the user specified in his or her search
criteria. Although requiring several program modules in the dMAPS
program, this method of searching provides an average searching speed
sixteen times faster than the standard dBASE III Plus searching
method. This considerable improvement is speed means that a search
taking 37 seconds using the developed search procedure would take
about 10 minutes using the standard dBASE III Plus method.
USER INTERF21CE SCREENS
The following pages contain representations of the dMAPS user
interface screens. If the user is interested only in using dMAPS as
a tool, and is not interested in the means by which the dMAPS program
accomplishes its goals, then these screens are the only parts of
dMAPS that the user sees. To this type user the following screens
are essentially dMAPS. All database relations, program relations,
search algorithms and data manipulations are transparent and need not
be considered by this type of user.
These screens have been designed to lead the user through the steps
to extract meaningful information from the database. Menus are
provided rather than asking the user to know or learn dBASE-like
commands. Additionally, the user is not required to be particularly
aware of the type of information that is in the database. By
selecting broad or narrow search parameters from the menus, the user
is presented with lists of available options or choices. It is not
even necessary that the user be able to spell formaldehyde to find
articles dealing with it.
The following screens are presented generally in the order in which
they would appear to a user conducting a search for a pollutant. To
aid in clarity of this written presentation not all screens have been
shown, and some instructions which are normally included in the
screen versions have been omitted.
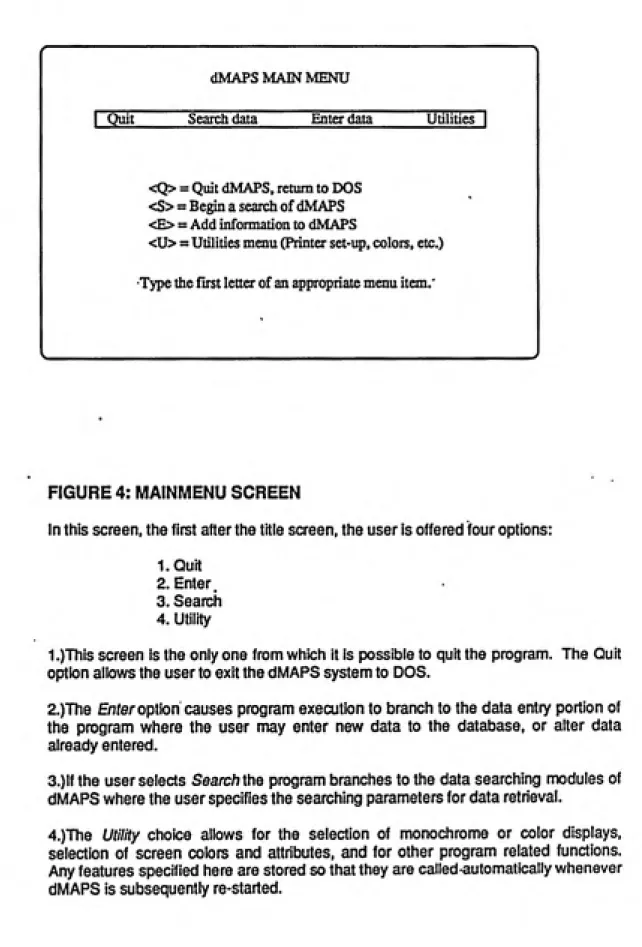
dMAPS MAIN MENU
Quit Search data Enter data Utilities
<Q> = Quit dMAPS, return to DOS
<S> = Begin a search of dMAPS
<E> = Add information to dMAPS
<U> = Utilities menu (Printer set-up, colors, etc.)
Type the first letter of an appropriate menu item.
FIGURE 4: MAINMENU SCREEN
In this screen, the first after the title screen, the user is offered four options:
LQuit
2. Enter.
3. Search
4. Utility
1.)This screen is the only one from which it is possible to quit the program. The Quit
option allows the user to exit the dMAPS system to DOS.
2.)The Enfer option causes program execution to branch to the data entry portion of
the program where the user may enter new data to the database, or alter data
already entered.
3.)lf the user selects Searc/7 the program branches to the data searching modules of
dMAPS where the user specifies the searching parameters for data retrieval.
4.)The Utility choice allows for the selection of monochrome or color displays,
selection of screen colors and attributes, and for other program related functions.
Any features specified here are stored so that they are called automatically whenever
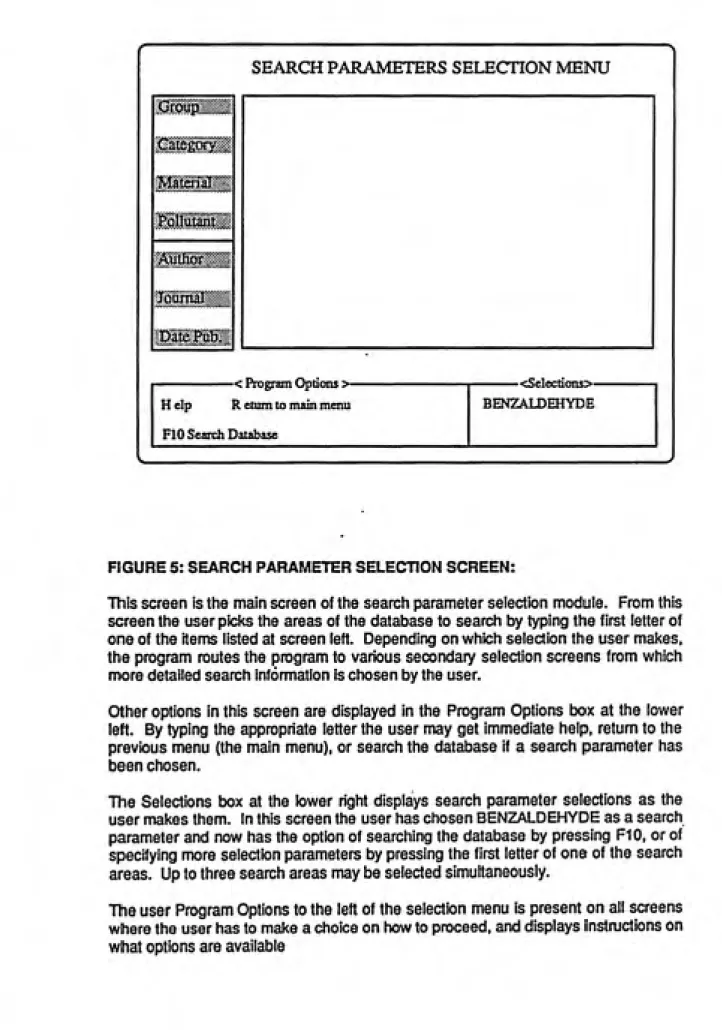
SEARCH PARAMETERS SELECTION MENU
3i!liP^»
Help R etum to main menu
BENZAI.DEHYDE FIO Search DatabaseFIGURE 5: SEARCH PARAMETER SELECTION SCREEN:
This screen is the main screen of the search parameter selection module. From this
screen the user picks the areas of the database to search by typing the first letter of
one of the items listed at screen left. Depending on which selection the user makes,
the program routes the program to various secondary selection screens from which
more detailed search information is chosen by the user.
Other options in this screen are displayed in the Program Options box at the lower
left. By typing the appropriate letter the user may get immediate help, return to the
previous menu (the main menu), or search the database if a search parameter has
been chosen.
The Selections box at the lower right displays search parameter selections as the
user makes them. In this screen the user has chosen BENZALDEHYDE as a search
parameter and now has the option of searching the database by pressing F10, or of
specifying more selection parameters by pressing the first letter of one of the search
areas. Up to three search areas may be selected simultaneously.
The user Program Options to the left of the selection menu is present on all screens
where the user has to make a choice on how to proceed, and displays instructions on
r
Pollutant34:DECANEJI- 52: INDEN0[1 A3-CD)PYRENE
PgUpl
35: DICHLOROErHANE,l> 53: ISO-OCTANE36: DIEraYLBENZENE,13- 54: ISOHIOPYLBENZENB
37:ETHANOL
55:KETONE,C5-38: ETHOXYEIHYLACErATE 56:KETONE,C8-39:EIHYLACErATE 59:UMONENE 40: ETHYLBEN2ENE 60:METHANE
41: ETHYLMEIHYLBENZENE,! J!. 61: METHYL-2-BUTANONEJ!. 42: ErHYLMETHYLBEN2ENE,l,4. 62:
METHYL-2.PENTANONE,4-43: ETHYLMETHYLCYCLOHEXANE 63: METHYLHEPTANE,3-44: FLUOROANTHENE 64:METHYLSTYRENE 4S: FORMALDEHYDE 65: N OF NITROGEN OXIDES 46: FORMLADEHYDE 66: NICKEL
47: HALCX3ENATED ALKANE 67: NmUC OXIDE 48: HEPTANE,!- 68: NiraOGEN DIOXIDE 49: HEPTANE^N- 69: NTTROSODIMETHYLAMDJEJI JftHEXANEJI- 70: NITROSOPYROUDINaN-51:
HEXANOLJI-PgDn 1
Enter the number of the Pollutant of interest:
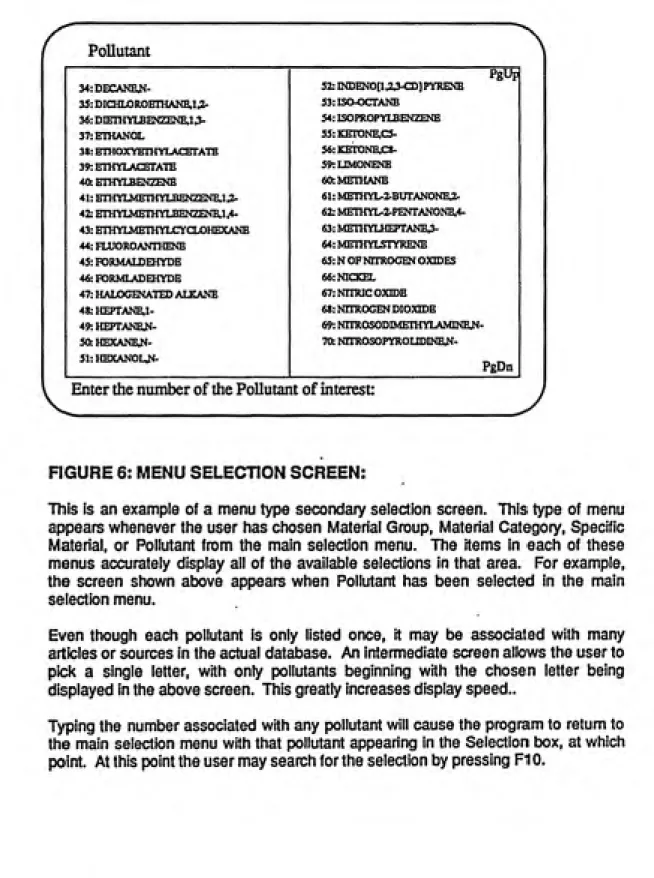
FIGURE 6: MENU SELECTION SCREEN:
This is an example of a menu type secondary selectton screen. This type of menu
appears whenever the user has chosen Material Group, Material Category, Specific
Material, or Pollutant from the main selection menu. The items in each of these
menus accurately display all of the available selections in that area. For example,
the screen shown above appears when Pollutant has been selected in the main
selection menu.
Even though each pollutant is only listed once, it may be associated with many
articles or sources in the actual database. An intermediate screen allows the user to
pick a single letter, with only pollutants Ijeginning with the chosen letter being
displayed in the above screen. This greatly increases display speed..
Typing the number associated with any pollutant will cause the program to return to
the main selection menu with that pollutant appearing in the Selection tx)x, at which
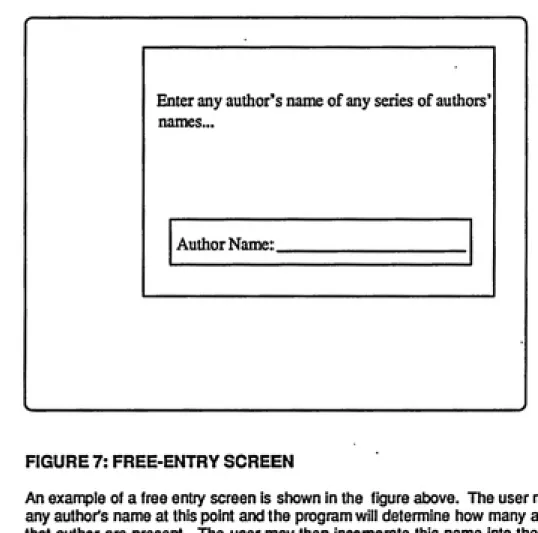
Enter any author's name of any series of authors'
names-Author Name:
FIGURE 7: FREE-ENTRY SCREEN
lof2_________________________________________________________________
MolhaveJ^ Anderson,!, Liindquist,GR, and Nielson,0,
Gas Emission from Building Materials - Occurance and Hygienic Standard
1982 Danish Building Research Institute (SBI) Report no. 137
t
Previous Matching Article 1
; Next Matching ArticleQ
Quit to main menu 1
F2Abstract for this aitide 1
1 ™
Data for this article 1
FIGURE 8: BIBLIOGRAPHY DISPLAY SCREEN
This screen appears after a data search has been performed by the program, and is
the first point at which the user begins to see the contents of the database which deal
with his or her search criteria. The first article that contains data concerning the
search criteria is displayed at the top of the screen. The location in the list of articles
is displayed slightly atxjve the menu box. In this case the location is at the first of
five articles which contain data meeting the search criteria.
Options at this point are to page through the other four matching articles with the
arrow keys, look at the data for this article, view an abstract for this article, or return
Molhave J., Anderson,!, Lundqaist,GR, and Nielson,0,
Gas Emission from BulcHng Materials - Occurance and Hygienic Standaid
1982 Danish Building Research Institute (SBO Report no. 137
1 alcohoI,c4-
1 Test Conditionalcohoi,c7/c8- 2
Te^ Conditions 1
1 alkane
9Test Conditions 1
alkane,clO- 7
Test Conditions i
alkane,c7/cl3 1Test Condition |
alkane,c8- 2
Test Conditions ]
1 alkane,c8/clO-
1Test Condition 1
1 alkane,c9-
1 Test Condition1 amines
41 Test Conditions> benzaldehyde 1 Test Condition
1 benzene,c3-
11 Test Conditions1 benzene,c4-
5 Test ConditionsTA Move Cursor Bar FIO Select Item
R Select another reference articleFIGURE 9: DATA SUMMARY SCREEN ONE
This screen begins the display of data from any article that the user has chosen from
the previous screen. Each pollutant in the article is listed along with the number of
different test conditions for each pollutant. As can be seen in the above screen, the
amount of data in a single article can be very large. This article lists over 70 pollutant
test conditions on this screen alone, with more screens available (PgDn).
To see data conceming a specific pollutant, the user moves a highlight bar through
the available choices. By pressing FIO the data for only the highlighted pollutant is
displayed.
If any pollutant/condition group contains a user specified search item, for example a
specific source chosen by the user, it is marked with a delta. Although all
pollutant/conditions are displayed for each article, only those groups so marked
«<Pollutant = AMINES»>
Material Measured Emission
vinyl coated wallpaper
floor varnish
not detected not detected
plywood
chipboard
caulking compounds
needle felt
not detected
3 ppm
not detected not detected
insulation sheets not detected
floor/wallcovering
calcium silicate sheet
not detected
not detected
wall covering
insulation foam
not detected
not detected
jointing compound
needle feltnot detected not detected
linoleum floor covering
not detectedFIGURE 10: DATA SUMMARY SCREEN TWO
This type of screen can be presented for every pollutant/condition entry in data
screen one, the previous screen. The atx)ve screen shows the results as if the user
had chosen AMINES in the previous screen. All source.materials and measured
emissions are displayed for each of the 41 conditions listed on the previous screen.
If any of these materials are of interest to the user he may move the highlight to that
material and press F10 to view data concerning the details of the test.
By positioning the highlight on a material of interest with the cursor keys and pressing
F9, the user can restrict the presentation of data in the next screen to only those that
specifically deal with the material that was highlighted. All other materials are
ignored. An F10 will present data concerning this pollutant for all of the displayed
MolhaveJ^ Anderson,!, Landquist,GR, and Nidson,0,
Gas Emission from Building Materials - Occurance and Hygienic Standard
1982 Danish Building Research Institute (SBI) Report no. 137
0.06mgAn3 BENZALDEHYDE |
TESTDATA
Measuied Emission: 0.06mg/m3
Description: measurements made at equilibrium: 140 hrs
Duration: ns Material fiberboard
Matl. Pie-Conditioning: ns
Opiating Panunaters ns
Room/Chamber Volume 1.8 cubic meter
VentiaMon Rate: 0.691pm +/- 5%
Temp(C) 21.1+/-1.7 Humidity (%RH) 40-45%
Data sere«n: 1 2 3
[ -^ MORE PgDn New Material PgUp Prev Material R Return QQuitdMAPS J
FIGURE 11: DA7A OUTPUT SCREEN ONE:
This is the first of three data display screens which show the entire data set for this
pollutant/material/condition relationship. This screen shows the test data and results
given in the article listed at the top, the article which has been chosen previously by
the user. By using the keyboard cursor keys the user can page through all three
screens: this screen of test data, screen 2 which is sampling information, and screen
3 which includes comments and user defined fields.
When the user presses PgDn, data for the next set of conditions for this pollutant
replaces the data in the display. If the user had accessed this screen by pressing F9,
the display would shift to the next occurance of data concerning benzaldehyde from
fibertward. If the user had pressed F10 to access this screen, a PgDn would display
the next data conceming the pollutnat benzaldehyde, without regard to what specific
source material it may have been associated with.
Since much of this data is similar, any data that is different from the previous screen
DATA VIEWING
After the user has entered a correct search criteria and the dMAPS
program has searched the database for data concerning those criteria,
the amount of data that is available for presentation can still be
very large. For this reason after the user has specified certain
areas of interest a series of data output siommary screens are
presented. The need for these screens is obvious when it is realized
that even one article may contain hundreds of separate entries. For
example, if an article evaluates 10 source materials at two
temperatures, and in each instance analyzes for 10 pollutants, the
result would be 200 separate records associated with this one
article. Clearly, to merely present the user with all the data at
this point would make it very difficult to gain useful information
from the database.
To allow the user to see data more specifically useful to his or her
needs, the dMAPS program employs a series of data summary screens
which allow the user to progressively filter the information to more
manageable amounts. The procedure for data display is as follows:
1. Select a specific article which has been found,
2. Select a specific pollutant in that article,
3. Select source material(s) for that pollutant,
4. View data.-*^i^hJ'^*i'
Figure 8 is a representation of the screen to select individual
articles. By using the arrow keys the user can page up or down to
the articles that dMAPS has found that match the user's search criteria. The user can then view the data in the selected article.At the present time there is no way to cross the article boundaries
and view data that are in articles other than the selected article.
To view information held in other articles, the user returns to this
screen and selects another article.
The next screen. Figure 9,. is the first data summary screen and
presents the first level of summary data for the selected article.
As the user continues through this and the following summary, screens
the data displayed becomes more complete. This screen presents a
list of all the pollutants dealt with in the article and the number
of test conditions under which emissions of this pollutant were
measured. The user selects a pollutant of interest by highlighting a
pollutant by pressing arrow keys and then pressing FIO.
Note that some of the pollutants shown are marked with a delta. If
the user had originally specified a material in the selection
section, a delta appears when that criteria is met in one of the test
conditions for that pollutant. For example, if the user had
specified "carpet" as a source material, the dMAPS program marks
every pollutant in this article that has had its carpeting emission
levels evaluated. The user may then choose only these tests to view
in detail.
The next screen. Figure 10, is reached when the user selects a
pollutant from the previous screen. Listed here are the source
materials and the measured emissions from that material. If the user
wishes to proceed, pressing F9 will present detailed information
concerning all of the listed source materials, or FIO will allow the
listing of only those materials similar to the highlighted material.
The user may move the highlight to any specific material with the
arrow keys before pressing FIO.
If the user choses to continue, the next series of screens presents
the detailed data available from that article/pollutant/source
material combination. The format of these screens are shown in
Figure 11. Three of these screens are available and present all the
data in the datafiles for this particular combination. A more
detailed description of these screens can be found under each Figure
in the User Interface Screens section.
It is hoped that future versions of dMAPS will allow for convenient
printing of the data found in the search procedures. Presently the
only printed output is the Print Screen function of the computer.
Printing of data will allow larger amounts of data to be output at
one time than can readily be done from the video display, and will
greatly enhance the ease of access to data.
Data Entry
Data entry for dMAPS is achieved by entering data and bibliographic
infoirmation from articles in a special module of the program. The
information entered in this area is stored in a file that is not incorporated into the full dMAPS datafiles until the user requests
it. This method speeds up data entry and makes the data more easily
appended or changed.
The data entry module is reached from the main menu screen, while the
command to update the dMAPS datafiles with the newly entered
information is in the Utilities module. These two actions are
separated in order to discourage the frequent updating of the main
datafiles for just a few newly entered records. Frequent updating is
undesirable since it takes time to order and index the newly updated
datafiles, and also because it becomes more difficult to correct
entry errors once the new data has been incorporated into the main
datafiles.
As can be seen in Figure 13, the data entry screens are divided into
sections with each section corresponding to one of the dMAPS
datafiles. Although the user must keep track of the structure of the
data entered into the program, effort has been made to make this task
as easy as possible. Repetitive typing has been minimized, and the
input screens have been organized in such a way that user can most
easily determine the datafile structure.
In order to do this the data entry screens have the entry blanks
arranged in order of increasing specificity. The bibliographic
information comes first since this data will not change throughout
the article being entered. The next section contains the entry
blanks concerning the sources of pollutants covered in the article,
while the next section contains information concerning the different
conditions under which the sources were evaluated. The final two
sections contain information about the sampling method for each of
the source/condition relationships mentioned above and, finally,
about the evaluated pollutant and associated test results.
This structure makes it relatively easy to enter large amounts of
data for single articles. When the user first begins entry for an
article all of the entry blanks are empty, and the user fills in all
the appropriate blanks. The user then calls up another screen to
fill in, but since much of the information will be identical the next
screen appears with the new entry blanks filled with the old
information from the previous screen. The user may then change only
those items that require it. The first screen, completely filled in
by the user, and every subsequent screen partially filled in by the
user constitute one record each in the dMAPS datafiles.
This arrangement is such that if any item is changed only items in
its immediate section or in the sections below it need be updated.
For exanple, in Figure 13 it can be seen that if an author conducted
research on two pollutants under identical conditions and used
identical sampling methods, only fields in EXPERIMENTAL RESULTS and
below are candidates for change, everything above would remain the
same. On the other hand, if the user began entering data from an
article concerning a different source material, all entry blanks
RTRT-TDTiRAPHTr INFORM ATTON
BroLIO_NO~
AUTHORS TITLE REFER ABSTRACT
>ͣ
SOURCE INFORMATION SOURCE_NO->|
GROUP CATEGORY MATERIAL
EXPERIMENTAL CONDITIONS COND_NO—>
PRE.CONDI TEST_DUR TEST.DESC OPER_PARA TEMP_DEG_C REL_HUMID MAT_SIZE VENT RATE OTHERCOND
SAMPLING INFORMATION SAMP_NO—>
SAMPL_TYPE SAMPL.RATE SAMPL.DUR SAMPL_METH SAMPL_SIZE ANALYSIS
EXPERIMENTAL RESULTS POLLUTANT ANALYZED I
EMISSION DATA I
COMMENTS I
XIOI UNITS I
USER DEFINED FIELDS (Optional)
USER DEFINED LABEL: I ASSOOATED DATA: | USER DEFINED LABEL: I ASSOaATEDDATA: I
<PgDn> Next Page <PgUp> ftev Record <CtrlxEnd> Save/Reset/End
Figure 13: Representation of the data entry screen accessed from the Entry selection of the main menu.
within and beneath the section containing SOURCE INFORMATION would be
candidates for change. Again, no areas above it would have to be
altered.
The hierarchical format of the data entry screens make it almost as
fast to enter data for an article dealing with 10 pollutants as for
one dealing with only one pollutant. Although it may be possible on
future versions of dMAPS, the program is not now able to
automatically determine the relationships between data in an article.
This task must be done by the user. Again, this is made relatively
single by the hierarchical structure of the data input screen. An
easy to remember rule is that when any item is changed, the
corresponding key number in that section and in all sections below it
must be increased by one. This rule relieves the user of most of the
task of keeping track of the relationships between article data.
As the user enters data from articles, the data is stored in a
temporary datafile called UPDATE.DBF. This file is stored and
appended to until the user determines that its information should be
incorporated into the main dMAPS datafiles. This makes it easy to
stop in the middle of entering data for an article and to resume
later. The program either picks up where the user last stopped, or
presents a new blank screen to begin another article, according to
the user's response to a series of questions at the beginning of the
data entry screens. The key for the Biblio_no field is automatically
entered for the user according to the last entry.
For additional information concerning the best procedures for entry
of new data and a tutorial lesson, consult the dMAPS Manual.
CONCLUSIONS AND RECOMMENDATIONS FOR FUTURE WORK
This program has been structured so that it may serve as a starting
point for further development. The program is in modular form,
meaning that different functions such as data entry, data searching,
and data display are in separately written sub-programs called
Procedures within the dMAPS main program. This form makes it
convenient to add other procedures to add other operations or
features. Recommendations for additional procedures include:
1. A module to allow printing out the data via a printer in a form
more convenient than the screen display format.
2. A module to transfer data from the dMAPS program, either found
data or data in toto, to a Lotus 1-2-3 spreadsheet. This will serve
two purposes. First, having the data in a spreadsheet format
familiar to many computer users will allow easier analysis of the
data, and secondly, it will allow the output of selected areas of the
data into a structure which will allow easier viewing of grouped
data. DBASE III Plus and Lotus 1-2-3 each have their own strengths
in data manipulation, and a procedure to allow data to be transferred
to a spreadsheet from dMAPS will greatly increase usefulness of the
data contained in dMAPS.3. It is presently necessary to view data grouped by published
article. This is only one way that data output may be structured.
and other output formats may be more convenient for different users.
Specifically, displaying data across bibliographic reference
boundaries would be particularly useful, presenting data on one
source material, pollutant, or other key field across the entire
database.4. Two versions of the program have been written, one for DBASE III
Plus, and one for the compatible database program Foxbase Plus. The
Foxbase Plus version is superior to the dBASE version, particularly
in areas such as disk-space storage requirements and speed.
Additionally, the dMAPS program written for Foxbase may be compiled
to run without the presence of the entire Foxbase program, but with a
Run-time version which may be distributed to users without charge.
This greatly increases the usefulness and audience of the dMAPS
program. I recommend that Foxbase Plus be used for all future
developmental work.
5. Conversion programs are available to convert DBASE (and Foxbase)
programs into the C programming language. This would be an extremely
desirable task for three reasons. Since programs in C are able to
run under many different operating systems, encoding dMAPS into C
would greatly increase the available audience by allowing the program
to run under non-DOS operating systems such as UNIX. Conversion to C
would also mean that dMAPS would exist as executable files rec[uiring
no additional software. Finally, programs in C are extremely fast.
Program operations now taking 17 seconds in DBASE and 8 seconds in
the faster Foxbase programs would execute almost instantaneously in a
C version.6. The present version contains data from forty articles dealing with
indoor air pollution. In order for the program to remain useful,
data must continue to be entered as more articles are published and
found in literature searches. As stated in the introduction, private
individuals have neither the time, money, nor skills to do
comprehensive literature searches for new data. Indeed, that lack of
ability has been the main reason to develop dMAPS. It would be a
serious mistake to now burden the users by requiring that they alone
keep the dMAPS program datafiles up to date. This responsibility
should fall on the group which has ultimate control of dMAPS
development, be that the University of North Carolina or the US EPA.