JOSEPH ROSSABI.
A FIBER OPTIC SPECTROSCOPIC ANALYSIS OF DIURON SORPTION/DESORPTION PROCESSES IN SUBSURFACE MEDIA. UNDER THE DIRECTION OF CASS T. MILLER.
ABSTRACT
The quantitative assessment of sorption and desorption processes is vital to the complete understanding of
contaminant fate and transport in the subsurface. The sorption and desorption of a synthetic organic pesticide, diuron, was studied by optical ultraviolet (UV) absorption spectroscopy in two configurations. The first utilized the "grab sample" method and a conventional laboratory benchtop UV/VIS spectrophotometer, and the second employed a fiber optic spectrophotometer.
The "grab sample" method is susceptible to systematic errors related to the removal of the sample from the
subsurface system for analysis. Fiber optic
spectrophotometry has the potential for noninvasive,
nondestructive measurements obtained within the subsurface media.
The hypothesis of this work was that fiber optic spectrophotometry can be used to determine the fate and
transport of a pesticide in laboratory systems of subsurface media, using a one dimensional column configuration.
The results of this research demonstrate that fiber optic spectroscopic methods can be used for one-dimensional subsurface media column sorption/desorption and tracer
experiments under the conditions used in this study. In addition, sorption kinetic experiments indicate that
equilibrium conditions are not attained after 140 days of
equilibration. Data from equilibrium distribution
ACKNOWLEDGEMENTS
I would like to thank the members of my committee. Dr. Cass T. Miller, Dr. Michael D. Aitken, and Dr. Philip C. Singer for their helpful comments and suggestions. In
addition, I would like to thank my advisor. Dr. Miller, for giving me the opportunity to perform this research. Thanks are due to Joe Pedit who was my laboratory mentor. This work was made possible by grants from the United States
Geological Survey and the Water Resources Research Institute of North Carolina. Of course, thanks to Terry for
TABLE OF CONTENTS
Page
ABSTRACT... ii
ACKNOWLEDGEMENTS... ill TABLE OF CONTENTS... Iv LIST OF TABLES... vii
LIST OF FIGURES... vlll I INTRODUCTION ... 1
1.1 Overview... 1
1.2 Optical Spectroscopy ... 2
1.3 In Situ Measurements... 3
1.4 Pesticide Sorption/Desorption ... 5
1.5 Research Objectives ... 6
II THEORY... 8
2.1 Optical Spectroscopy ... 8
2.1.1 Absorption Spectroscopy ... 8
2.1.2 Luminescence Spectroscopy ... 10
2.1.3 Scattering Processes ... 11
2.2 Fiber Optic Sensors ... 11
2.2.1 Fiber Optic Waveguides ... 12
2.2.2 General Sensor Configuration ... 14
2.2.3 Types of Fiber Optic Sensors ... 15
2.3 Sorption/Desorption ... 17
2.3.1 Sorption/Desorption Processes ... 18
2.3.2 Sorption/Desorption Equilibrium .... 18
2.3.3 Sorption/Desorption Rate Models .... 21
2.3.3.1 Local Equilibrium Models .... 22
2.3.3.2 Chemical Models ... 23
2.3.3.3 Physical Models ... 25
2.3.3.3.1 First Order Mass Transfer Models... 25
2.3.3.3.2 Physical Diffusion Models... 26
III MATERIALS AND METHODS... 31
3.1 Materials... 31
3.1.1 Solid... 31
3.1.2 Solutes... 32
3.1.3 Solutions... 34
3.2 Experimental Methods ... 35
3.2.2 Sorption/Desorption Batch Kinetic
Experiments... 40
3.2.2.1 Conventional Configuration ... 40
3.2.2.2 Suprasil™ Configuration .... 42
3.2.2.3 Desorption Experiments ... 43
3.2.3 Sorption/Desorption Batch Equilibrium Experiments... 44
3.2.4 Solid-phase Extraction... 46
3.2.5 Column Experiments ... 47
3.3 Instrument Description and Measurement Procedure... 53
3.3.1 Conventional Spectrophotometry .... 53
3.3.1.1 Cuvette Method ... 55
3.3.1.2 Suprasil™ Bottle Method .... 59
3.3.2 Column Measurements ... 62
3.3.3 Fiber Optic Spectrophotometry ... 62
3.3.3.1 Column Experiment ... 64
3.3.3.2 Suprasil™ Bottle Batch Experiment... 65
IV EXPERIMENTAL RESULTS AND DISCUSSION ... 67
4.1 Experimental Results ... 67
4.1.1 Batch Experiments ... 67
4.1.1.1 Equilibrium Distribution Experiments... . 69
4.1.1.2 Kinetic Experiments ... 74
4.1.1.2.1 Sorption Kinetic Experiments... 74
4.1.1.2.2 Suprasil™ Bottle Experiments... 81
4.1.1.2.3 Desorption Kinetic Experiments... 83
4.1.2 Column Experiments ... 86
4.1.2.1 First Column Experiment: Col-1, Trc-1 ... 86
4.1.2.2 Second Column: Col-2, Trc-2 . . 95
4.2 Instrument Variation and Signal Processing . . 97
4.2.1 Instrument Variation ... 97
4.2.2 Signal Processing ... 103
4.2.2.1 Grab Sample Corrections . . . 103
4.2.2.2 Fiber Optic Data Corrections . 105 4.3 Discussion of Experimental Results ... 117
4.3.1. Equilibrium distribution experiments 117
4.3.2 Kinetic Experiments ... 118
4.3.3 Suprasil™ Bottle Kinetic Experiment . 119
4.3.4 Column Experiments ... 121
4.3.5 Computer Modeling of Data... 126
V CONCLUSIONS AND RECOMMENDATIONS ... .... 132
5.1 Conclusions... 132
5.2 Recommendations... 133
LIST OF TABLES
Page
Table 3-1 Solid Properties... 31
Table 3-2 Solute Properties... 32
Table 4-1 List of Experiments... 68
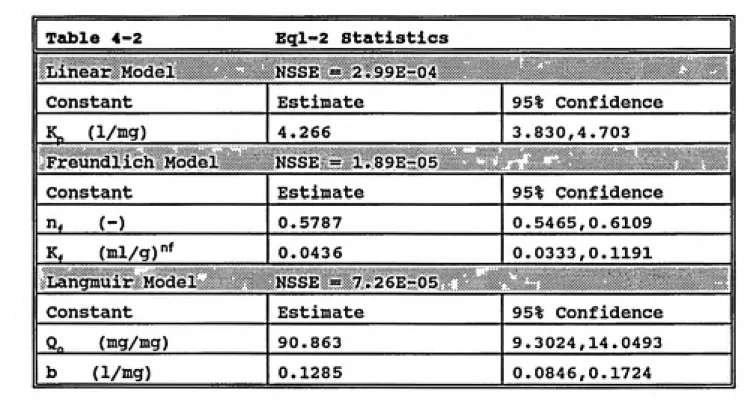
Table 4-2 Eql-2 Statistics... 72
Table 4-3 Column Parameters... 88
LIST OF FIGURES
Page
Figure 3-1 UV absorbance spectrxom of diuron... 37
Figure 3-2 UV absorbance spectrum of sodium azide. . . 39
Figure 3-3 Diagram of Column Apparatus... 48
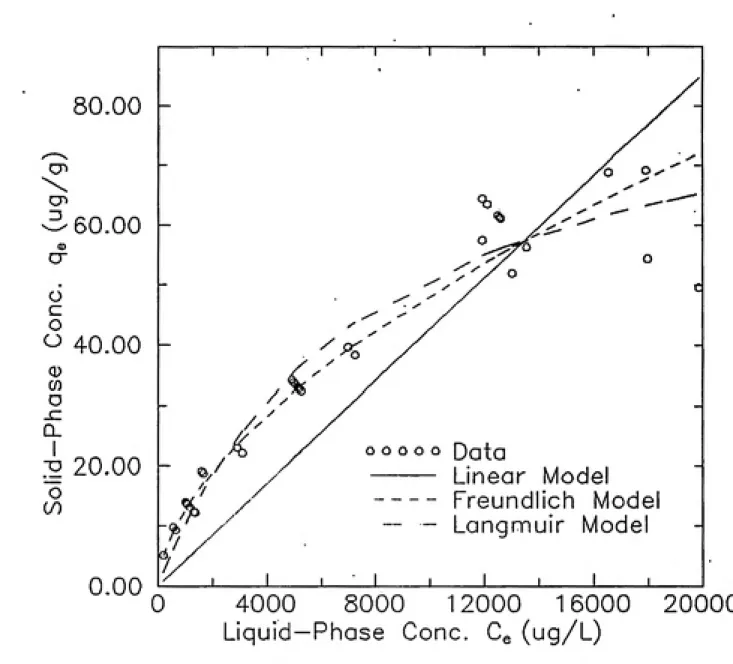
Figure 4-1 Equilibrium Distribution data with model fits... 71
Figure 4-2 Equilibrium Distribution data, Desorption data with Freundlich fit... 73
Figure 4-3 Comparison of standards data... 75
Figure 4-4 Sorption kinetic data for Srp-1... 78
Figure 4-5 Sorption kinetic data for Srp-2... 79
Figure 4-6 Sorption kinetic data for sodium azide. . . 80
Figure 4-7 Variability of absorbance for Suprasil™ bottle... 82
Figure 4-8 Sorption kinetic data for Srp-1 using conventional and Suprasil™ methods... 84
Figure 4-9 Desorption kinetic data of Dsrp-2... 85
Figure 4-10 Column-1 grab sample diuron data... 89
Figure 4-11 Column-1 grab sample tracer data... 91
Figure 4-12 Colximn-1 raw fiber optic diuron data. . . 92
Figure 4-13 Column-1 comparison of grab sample diuron data with corrected fiber optic diuron data. ... 93
Figure 4-14 Column-1 comparisonf of grab sample tracer data with corrected fiber optic tracer data. ... 94
Figure 4-15 Column-1 comparison of analytic solution of tracer and corrected fiber optic data... 96
Figure 4-16 Column-2 comparison of grab sample diuron data with corrected fiber optic data... 98
Figure 4-17 Column-2 comparison of grab sample tracer data with corrected fiber optic tracer data. ... 99
Figure 4-18 Portion of Column-1 experiment used for
correction... 108Figure 4-19 Column-l raw fiber optic data at two wavelengths... Ill
Figure 4-20 Linear and nonlinear fits to raw data. . 112
Figure 4-21 Comparison of raw data and correction
curve... 113Figure 4-22 Comparison of raw data and corrected data at two wavelengths... 114
Figure 4-23 Comparison of raw delta plot and corrected
delta plot at 248 nm... 116I INTRODUCTION
1.1 Overview
Approximately one half of the population of the United States uses ground water for drinking (Schiffman, 1988). It is therefore important to be able to discriminate and
quantify the factors affecting the quality of this resource. Over the past century, much progress has been made in the areas of chemical synthesis and the use of these
chemicals in industry and agriculture. Unfortunately, this has not been accompanied by equal progress in the knowledge of the relation between synthetic chemicals and the natural environment. As a result, some of these synthetic
chemicals such as organic solvents, pesticides, and
herbicides have contaminated otherwise pristine subsurface environments because of improper disposal or application
practices. The health risks of some of these contaminants
are just beginning to be understood. Therefore, humans are currently faced with environmental problems left to them by their forbearers.
Understanding the flow and transport of contaminants in
water quality. Determining contaminant concentration
requires chemical analysis. Techniques for the chemical analysis of subsurface contaminants have traditionally relied on the "grab sample" method. In this method, a solid, liquid, or vapor phase sample is obtained at a
particular point in the subsurface region and brought into the laboratory for analysis. This method induces many chances for systematic errors, including: the changing of the environment to physically obtain the sample; removal of the sample from its original environment; transportation of the sample in another environment; and analysis in a
different environment. All of these may affect the sample or the assessment of the contaminant concentration in that sample. The ideal measurement would accurately assess the contaminant concentration without affecting the contaminant, the sample, or its environment.
X.2 Optical Spectroscopy
Since the advent of quantum mechanics, the basic
principles of atomic and molecular spectra have not changed (Patterson, 1987). Spectroscopy, the study of spectra, has
been used to identify atoms, molecules, and their associated
structures and environments. This is done by analyzing the
wavelength and intensity of the radiation emitted, absorbed,
known external electromagnetic conditions often take the form of a probe wave that is made to interact with the structure of interest.
There are various types of spectroscopic techniques commonly in use. These are categorized according to the characteristics of the probe wave used and the type of
interaction between the probe wave and the analyte. Optical spectroscopy uses an electromagnetic wave in the region from the low ultraviolet (less than 200 nm) to the far infrared
(greater than 10,000 nm) as the probe. The types of interactions exploited with optical spectroscopy are of three basic types: absorption, elastic and inelastic scattering, and luminescence. All three have been successfully used in chemical analysis.
1.3 In Situ Measurements
Although the use of optical spectroscopy for chemical and physical analysis has been well established over the past century it has generally lacked the mobility necessary to do analysis outside of a structured laboratory
environment. This problem is not limited to optical
understanding of real world chemical, physical, and biological processes.
Performing chemical analysis requires the isolation of a measurable parameter of interest by controlling the
variables associated with that parameter. Analytical
techniques achieve this by the selectivity and operational control of the probe and detector as well as by the
measurement of ambient conditions such as temperature and pressure. Most analytical techniques require relatively
large physical instrumentation and physically stable probes
and detectors to accurately make these measurements. Because of the rigidity of the probe and detector
configuration, a sample must be extracted from its natural environment and brought into the measurement field of the instrument. This changes the parameter's natural conditions and may introduce error in the measurement. In order to make accurate measurements in natural settings, an
instrument's presence must minimally affect the measurement yet maintain a useful degree of accuracy. This is often very difficult to achieve because of the physical size
limitations required to be noninvasive while maintaining the necessary components to maintain accuracy.
Optical spectroscopy has had the most success of the analytic techniques in making the transition from laboratory
to in situ measurement for a number of reasons. One reason
non-destructive, which enables relatively continuous
measurements. Another reason for its success is the small size and conductivity of waveguides available for the
medium. These high conductivity waveguides allow
measurements to be made remotely from the probe generation and detection equipment. The small size of the waveguides allows relatively noninvasive measurements to be performed.
Since optical spectroscopy techniques operate by the modulation of a light beam, the size of the probe is limited only by the minimum diameter of light achievable. Single mode fibers have typical core diameters of 5-10 /xm. With the progress made in recent years on light sources and optical fibers, probes can be made small enough to be non-intrusive to many of the measurements made of parameters in natural environments.
1.4 Pesticide Sorption/Desorption
Sorption/desorption effects have been found to be among the most significant factors affecting the fate and
transport of synthetic organic contaminants in the
subsurface (Weber and Miller, 1989). The mechanisms for these mass transfer processes is dependent on the
organic matter (NOM). Many different theoretical and
mathematical formulations for quantifying the dominant factors in sorption and desorption processes have been
postulated over the past years but none has been universally superior in the description of experimental data to the
exclusion of the others in all cases (Brusseau and Rao, 1989b). A thorough understanding of the manifestation of sorption and desorption processes in subsurface media would allow better predictions of the spatio-temporal fate of
contaminants.
1.5 Research Objectives
The main objective of this work was to investigate and evaluate a fiber optic spectroscopic technique for
performing important environmental analyses. The general goal was the accurate assessment of the sorption and
desorption parameters of a pesticide on a typical subsurface medium. The hypothesis of this work was that fiber optic spectrophotometry can be used to determine the fate and transport of a pesticide in laboratory subsurface media systems.
Proof of the experimental hypothesis would indicate
that there is potential for in situ assessment of particular
sorption/desorption behavior using a fiber optic
accurate determination of sorption/desorption effects and their contribution to contaminant fate and transport in
laboratory configurations. Non-invasive techniques may also eventually aid in the clarification of the predominant
II THEORY
2.1 Optical Spectroscopy
As mentioned in Section 1.2, there are three basic types of optical spectroscopies currently employed for chemical analysis. Two of these are briefly discussed in the paragraphs following. UV absorption spectroscopy was
used in this work and is discussed in more detail.
2.1.1 Absorption Spectroscopy
The absorption of electromagnetic energy follows the
principles of quantum electrodynamics, however, the process
is often adequately described by a semi-classical mechanism (Patterson, 1987). Matter preferentially absorbs light of a particular wavelength range. The wavelength of the light absorbed corresponds to the amount of energy required by the matter to move from a lower energy state to a higher energy
state. Quantum dynamic theory specifies the precise
wavelength of light necessary to achieve a particular energy
state in a unique substance by the Bohr model of the photon.
where E is the energy of the photon, v is the frequency of
the photon with units cm"\ and h is Planck's constant.
Within an energy state there are several small
vibrational levels of energy or perturbations around the energy state. These various levels have their own
individual energy requirements but taken together can be thought of as a continuum around an energy state with very little loss in theoretical accuracy (Janata, 1989). The concept of a continuum allows a statistical treatment of the interaction of light and matter. This treatment leads to the well known Lambert-Beers' equation (Chen, 1987):
'^oq^Q^-abC (2-2)
where I and I^^ are the instantaneous and source intensities
at a particular wavelength, a is the absorptivity constant of the matter for a given set of conditions, and b and C are the path length of the light through the matter and the
concentration of the absorbing species in grams/liter (Silverstein et al., 1974). It is useful to define a
quantity called the absorbance A of a species as:
A is known as the optical density of a material in the older
literature (Silverstein et al., 1974). A plot of the
absorbance with respect to wavelength is normally described
as the absorbance or absorption spectrum of a chemical species. As is outlined above, the absorption spectrvun is
dependent on the species type and current energy state and
concentration.
2.1.2 Luminescence Spectroscopy
Matter is usually in its lowest stable energy state for
a given ambient condition before the energy of the photon is
absorbed. After absorption, the excited matter will again
seek its lowest stable energy state. This state is achieved
in several ways: chemical or physical transformations of the
matter that uses the excess energy, a radiative process in
which the energy is lost by the emission of a photon, or a
combination of the two processes (Chang, 1971). The
wavelength of the radiated photon is dependent on the
physical and chemical characteristics of the matter. The
radiative processes give rise to the field of luminescence
spectroscopy, which includes both fluorescence spectroscopy
commonly used in liquid chromatography apparatus for liquid
used to characterize crystal purity in semiconductor materials (Goldberg and Weiner, 1989).
2.1.3 Scattering Processes
The last process mentioned is scattering. Radiative scattering is a process involving the interaction of the wave and momentum vectors of the light and matter (Gilson and Hendra, 1970). This interaction gives rise to scattered radiation that is characteristically different than the
incident radiation. The differences can be in wavelength, intensity, polarization, and coherence, and are dependent on the type of matter and the characteristics of the incident
intensity. Scattering processes are usually probed with an incident beam of monochromatic light and are differentiated by the resultant scattered light's wavelength spectrum with respect to the incident spectrum. These processes include Rayleigh, Brillouin, and Raman scattering. Of these three, Raman scattering has been the most useful in the optical analysis of matter.
2.2 Fiber Optic Sensors
There has been a surge in the field of fiber optic sensor research over the past two decades. This surge has
ͣ
^psp^
optic communications research. The communications field is
interested in the unadulterated transmission of light signals through plastic or glass optical fiber. However, any unwanted cause of modulation of a communications signal through a fiber has potential as a fiber optic sensing
parameter.
2.2.1 Fiber Optic Waveguides
The theory behind the transmission of light down a fiber waveguide harkens back to the classical Maxwell's Equations describing electromagnetic fields and Snell's law
(Olsen and Rogers, 1984). Snell's law is usually written
as:
iaiSine^-njSinej (2-4)
where n, and n^ are the indices of refraction of two
adjoining media, and 9, and e^ are the angles of incidence
and reflection measured with respect to the perpendicular to the interfacial surface of a ray of light passing from
medium 1 to medium 2.
For n, greater than nj, if the angle of incidence, 9, is
sin8^--^ (2-5)
ͣ
^1
nearly all of the light will be reflected back into medium 1. If medium 1 is formed as a cylinder concentric to a
larger cylinder of medium 2, it is easy to see that light
introduced at one end of medium 1 will traverse down the length of medium 1 by multiple internal reflections. The light is therefore guided from one end to the other.
Optical fiber is usually fabricated from glass or
plastic preforms and is drawn into long thin strands serving as the primary light conduit or core. These strands are normally coated with a cladding material of a different
index of refraction than the core material to maintain the waveguiding properties of the core. Other layers are also coated on to improve properties such as strength and
flexibility of the fiber optic cable. The transmission
properties of the fiber depend on the core and cladding
materials and their relation (Daly, 1984). Fiber optic materials and manufacturing methods are rich topics but are
2.2.2 General Sensor Configuration
The general configuration of an active fiber optic sensing system involves three regions linked by fiber optic waveguides. Passive fiber optic sensors such as those
utilizing the chemiluminescent effect do not have a separate optical source and will not be discussed here. The first region consists of an optical source. This can be any
source of optical electromagnetic radiation compatible with the waveguide but most often takes the form of a lamp, a light emitting diode (LED), or a laser. The radiation from this source is carried with minimal modulation down the
first waveguide to a sensing region. This second region is where the actual measurement takes place. At this point, the original light signal is modulated. Modulation can be manifest in a change in intensity, frequency, polarization, propagation time, or phase. For example, if a material that characteristically absorbs light over the wavelength range 240 to 260 nm is placed in the path of the incident
radiation, the resultant light will have a lower intensity over that 20 nm range than if the absorbing material were absent.
The resultant or modulated light passes from the
sensing region to the detector region via another fiber
photomultiplier, photodiode, or avalanche photodiode. The third region often includes a spectrometer ahead of the detector to separate the components of the light by wavelength.
2.2.3 Types of Fiber Optic Sensors
The sensing region of a fiber optic sensor can be either intrinsic or extrinsic. Intrinsic sensing occurs when the light is modulated directly within the fiber. This type of sensor is often used to measure changes in phase and is incorporated in fiber optic gyroscopes and other sensors utilizing the Mach-Zender effect (Butler and Ginley, 1988). Extrinsic sensing occurs when light is modulated outside of the fiber core region and then reintroduced into the fiber leading to the detection region. This type of sensing is used most often in chemical sensing. Extrinsic modulation can occur in a cell, through a membrane, in a porous region,
etc.
Chemical sensing has not been the only fertile region for the application of fiber optic sensors. Fiber optic sensors have been used for a plethora of types of
measurements including temperature (Conforti et al., 1989), particle counting (Chow et al., 1988), electric current
(Edwards et al., 1989), humidity (Zhou et al., 1988),
and Cheng, 1988), and pH measurements (Jones and Porter, 1988; Luo and Walt, 1989a; Gabor and Walt, 1991).
Fiber optic chemical sensors have been used in many different configurations for measuring many different parameters (Seitz, 1984; Peterson, 1988). These sensors have used all three of the general optical spectroscopic methods discussed above.
Fluorescence based fiber optic sensors have been extremely popular for chemical sensing, usually in
conjunction with a catalyst or reactant attached to the fiber (Kulp et al., 1987; Louch and Ingle, 1988; Fuh et al., 1988; Zung et al., 1988; Lieberman and Brown, 1988; Herron and Whitehead, 1988; Carrol et al., 1989; Bright and
Litwiler, 1989; Luo and Walt, 1989b; Shakhsher and Seitz, 1990; Gunasingham et al., 1990). These types of sensors have also had success in environmental applications such as
in situ ground water monitoring (Chudyk et al., 1988),
gasoline sensing, hazardous waste screening (Chudyk, 1989), and column experiments to measure flow and transport (Kulp et al., 1988).
Scattering techniques have also been employed in fiber optic sensors (Laguesse, 1988). Raman scattering probes have been studied most often (Walrafen and Stone, 1972; Ross and McClain, 1981; McCreery et al., 1983; Schwab and
Absorption sensing techniques have also been used in fiber optic configurations for chemical sensing (Tenge et al., 1987; Carey et al., 1989; Dickert et al., 1989; Zhou et al., 1989; Renn and Synovec, 1990; Cavinato et al., 1990).
2.3 Sorption/Desorption
When discussing the effects of sorption/desorption processes on the fate and transport of nonionic organic chemicals in the subsurface it is convenient to use the one dimensional form of the transport equation for saturated conditions:
where c is the solute concentration in the fluid phase; t is time; D is a longitudinal dispersion coefficient, v is an average fluid-phase pore velocity in the x direction, x is distance; the terms subscripted rxn and srp are source-sink terms for chemical reaction and sorption-desorption mass
transfer, respectively; p is the solid-phase density; 6 is
section the primary focus will be on the forms of the possible sorption/desorption mass transfer terms.
2.3.1 Sorption/Desorptlon Processes
In a system comprised of a solute, a solid, and an aqueous phase, sorption and desorption processes can be defined to be those processes causing mass transfer of the solute between the aqueous and solid phases.
Sorption and desorption processes are usually analyzed in terms of an equilibrium state and a rate state. Single solute systems will be the only systems discussed here.
2.3.2 Sorption/Desorptlon Equilibrium
For nonpolar hydrophobic organic compounds the literature has shown that the dominant factors in the sorption/desorption processes of aqueous and solid phase systems are the natural organic matter content of the solid phase media and the hydrophobicity of the solute (McCarty et al.,1981; Ball and Roberts, 1991a). This is analogous to a partitioning behavior often exploited in chemical extraction procedures. Karickhoff (1984) observed that a linear
-i^^^l^fssr
Qo'K^C^ (2-7)«e "p^e
where q^ is the equilibrivim solid-phase solute
concentration, K^ is the linear sorption partition
coefficient, and c^ is the equilibrium fluid-phase solute
concentration. The linear sorption partition coefficient contains contributions relating to both the organic content of the solid media and the hydrophobicity of the solute as is illustrated by the following two equations:
Kp'focKoc (2-8)
and
LogiK^) -ALog{K.„) + B (2-9)
where K^^^, is the organic carbon referenced sorption
partition coefficient, f^^^ is the organic carbon content of
the natural solid material, A and B are empirical
coefficients of regression and K^ is the octanol-water
coefficient and A and B can be found in the literature
(Sabljic, 1987).
In most situations, especially those where the solute concentration is relatively high or the solute is ionic or highly polar, nonlinear expressions are better able to fit the relation between the solid and aqueous phase
concentrations of solute. Several expressions have been used in this vein (Kinniburgh, 1986). The Freundlich
equation has had a great deal of success in the description of these systems. The Freundlich expression is usually
written as:
where K^ and n^ are constants. This implies a nonlinear
relationship between the sorption retardation coefficient and the aqueous concentration making it more difficult to solve the contaminant transport equation.
Non-singular effects have been observed in many
sorption/desorption equilibrium experiments, in which the curves describing the equilibrium distribution of a solute in the aqueous/solid phase system are different after
researchers (Di Toro, 1985; Chang, 1989) , there is no strong
conviction that this is an inherent property of the
sorption/desorption mechanism. Several researchers
(Koskinen et al., 1979; Curl and Keoleian, 1984; Gschwend
and Wu, 1985; Brusseau and Rao,1989; Chang, 1989; Ball and Roberts, 1991a) have listed a number of explanations for
non-singular data. The explanations have mostly related to
problems in the experimental techniques often used to study
systems such as these. However, Brusseau and Rao (1989)
have suggested that chemical reactions fixing the solute
onto the solid phase may be occurring after sorption in
hysteretic systems.
2.3.3 Sorption/Desorption Rate Models
Researchers have recently found that the equilibrium
conditions for sorption and desorption processes can take
months or longer to occur (Chang, 1989; Pedit and Miller,
1990; Levert, 1990; Ball and Roberts, 1991a, 1991b).
Therefore in order to accurately describe contaminant fate
and transport it is necessary to understand the rate of
sorption and desorption processes.
Sorption/desorption rate models usually take one of
three forms: the local equilibrium model, chemical site
2.3.3.1 Local Equilibrium Models
The local equilibrium asstimption (LEA) postulates that
sorption/desorption occurs quickly with respect to
advection. This implies that the solid and aqueous phases
of solute are in equilibrium at localized points within the
system. The contaminant transport equation would therefore
employ one of the equilibrium expressions discussed above to
describe the changes in solute with respect to time. For a
system described by the Freundlich expression, the following
would hold under the LEA:
dt dc dC ^ ^ dt
For a conservative solute this results in a retardation of
solute breakthrough normally observed from the contaminant
transport equation with no sorption. This retardation
Rf-1+ P^^"^) n^KfC"'-^ (2-12)
The retardation factor is independent of solute
concentration when the sorption equilibrium distribution
relationship is linear (n^=l).
The LEA model has been shown to be incorrect in
experimental investigations in both the field (Goltz and
Roberts, 1986) and the laboratory (Weber and Miller, 1988).
However, it has been used as a reference point for comparing
other types of sorption/desorption models (Weber and Miller,
1988; Goltz and Roberts, 1986; Miller and Weber, 1986,
1988) .
2.3.3.2 Chemical Models
Chemical rate models assume that the sorption process is limited by kinetics rather than by mass transport
limitations assumed by the physical models. Generally these
models are categorized as single site rate equations or two
site mechanisms in which the sorption process is depicted as
a combination of fast and slow sites. Of these, the two site model has been more successful at accurately
representing non-equilibrium data (Cameron and Klute, 1977;
the fast or instantaneous sites are represented by an
equilibrium condition and the slow sites are controlled by a
kinetic expression. This model can be represented as:
where f is the fraction of instantaneous sites, and k^ and
kg are the sorption and desorption rate constants,
respectively. Assuming a linear sorption equilibrium
distribution, the transport equation for a conservative
solute is given by:
where
2.3.3.3 Physical Models
Physical models are fundamentally different from the
chemical models described above in that sorption is
postulated to occur instantaneously when a solute has
physically reached a sorption site. The rate limiting
factor in this type of model is embedded in a diffusion
parameter. There are two general categories of physical
models. The first are usually called first order mass
transfer models, and the second type can be described as
diffusion models.
2.3.3.3.1 First Order Mass Transfer Models
First order mass transfer models usually describe two
types of solid surface regions associated with a particle in
a saturated system. The immobile region is defined as the
surface of the solid within the pores and contacting the
stagnant fluid phase within the particle. The mobile region
is the surface of the solid that is in contact with the bulk
fluid of the system (assuming a negligible hydrodynamic
layer around the surface of the particle). The limiting
step in the sorption process is the mass transfer from the
bulk fluid phase to the stagnant fluid phase. Many
researchers have had success using this type of model to
1977; Nkedi-Kizza et al., 1982; Goltz and Roberts, 1986;
Brusseau et al., 1989).
2.3.3.3.2 Physical Diffusion Models
Physical diffusion models have only recently become
popular for modeling sorption/desorption effects in
siibsurface media although they have been used for some time
in modeling activated carbon systems. In these models,
diffusion into the particle characterizes the rate limiting
step, and is dependent on the radial position of the solute
with respect to the particle's geometry. The types of
diffusion that can occur are pore diffusion, surface
diffusion, intraorganic matter diffusion, or a combination
of these.In the pore diffusion process, fluid and solid phase
solute concentrations at the same radial position within a
pore volume are assumed to be in equilibrium. However, the
concentrations are dependent upon the radial position as
moderated by a diffusion process. For a particle with a
spherical geometry, this concentration can be written as:
r2 dr[
dt r2 dr\ dr
^''^.£±Mr^^\ (2-16)
where c is the solute concentration in the fluid phase
within the intraparticle pore space, D^ is the apparent
diffusion coefficient, and r is the radial distance from the
center of the sphere. The apparent diffusion coefficient is
given by:
D^-^ (2-17)
where D is the effective pore-diffusion coefficient and R is the intraparticle pore-retardation factor. The pore
retardation factor is defined by an equilibrium distribution
expression. When the Freundlich expression is used to
describe the sorption equilibrium distribution relationship,
^ e
where 6 is the intraparticle porosity. If the solute is
nonsorbing, Rp = 1; however, often there is still an
apparent sorption effect due to very small diameter,
tortuous pores that might result in the steric hindrance of a solute ( Ball and Roberts, 1991b; Brusseau et al., 1991;).
In addition, mass transfer resistance at the hydrodynamic
boundary layer surrounding the particle may impart
additional constraints on solute sorption (Miller and Weber,
1986).
In the surface diffusion model, solute diffuses into the particle by concentration gradients in the solid phase
along the walls of the pore. For a particle with a
spherical geometry, the change in solid concentration with
respect to radial position is given by:
dQr . ^s d (. dQr
r^riL\ (2-19)
where q is the solute concentration in the solid phase as a
coefficient. For a Freundlich equilibrium condition, the
particle boundary conditions are:
i'^f'
C^-l "^ - r^ (2-20)
and
^"^-0 atr-0 (2-21)
dr
where c^ is the solute concentration at the surface of the
particle.
Two problems with the pore and surface diffusion models
as described above are that a uniform particle size and a
spherical particle shape are usually assumed. These two
assumptions are not valid in natural subsurface conditions
and must be accounted for in some systems to preserve the
accuracy of the model (Cooney et al., 1983; Rasmuson, 1985).
However, researchers have observed excellent results using a
single representative average particle size (Miller and
Weber, 1986, 1988).
1^^^
Ill MATERIALS AND METHODS
3.1 Materials
3.1.1 solid
The subsurface media used (Wagner media), was collected
from a sand and gravel pit owned by Killins Concrete Company
in Ann Arbor, Michigan. The media was comprised of glacial
deposits taken at a depth of 20 to 25 meters below the
surface. The material was air dried, sieved to remove
particles larger than 2 mm in diameter, and prewashed to
remove easily dissolved natural organic matter and to
eliminate nonsettling particles (Levert, 1990). The
characteristics of the media are given in Table 3-1.
1 Table 3-1
Solid Properties
1 Washed Wagner Subsurface Media |
Median Grain Size Diameter
(mm)
0.50
11
Grain Size Uniformity
Coefficient
(d.n/d,n)
2.98
11
Solid Density
(g/cra^)
2.67
pH (aqueous slurry)
8.80 1
Organic Carbon Content
II (%)
1.20
3.1.2 Solutes
Diuron, (3-(3,4-dichlorophenol)-l,l-dimethylurea), a
herbicide used in a variety of agricultural applications
(Mustafa and Gamar, 1972), was chosen as the solute to be
investigated . The general characteristics of this
moderately hydrophobic, nonvolatile, nonionic, organic
chemical are given in Table 3-2.
1 Teible 3-2 Solute Properties |
Diuron 3-(3,4-dichlorophenyl)-1,1-dimethylurea |
1 CAS #
330-54-1Mercer et al, 1990 |
Molecular Wt.(g/mol)
233.10
Melting Pt. (°C)
158-159 Worthing and
Walker, 1983
Aqueous Solubility
(mg/i)
42 @ 25° C Worthing and
Walker, 1983 |
Vapor Pressure (mm Hg)
3.1 X 10"' § 50° C Worthing and
Walker, 1983
1 log K„„
2.81Mercer et al, 1990 |
Chemical and biological transformations which can be
extremely important factors in the fate and transport of
organic chemicals are only briefly discussed in this work.
The transformation of organic chemicals in the
subsurface can occur by several different processes
(Weber and Miller, 1989). Researchers have found that
diuron is biodegradeable under both aerobic and anaerobic
conditions (Khan et al., 1976; Attaway et al., 1982). Under
aerobic conditions, diuron was found to be transformed to
3,4-dichloroaniline by two N-demethylations followed by a
hydrolysis reaction. Diuron was found to be transformed to
3-(3-chlorophenyl)-l,l-dimethylurea by reductive
dehalogenation under anaerobic conditions. Researchers have
also found that chemical transformations of diuron under
ordinary temperatures and neutral pH ranges were negligible
(Hill et al., 1955; Worthing and Walker, 1983). This was
confirmed by Chang (1989). The biological contribution to
diuron degradation was found to be negligible for this work.
The minimal contributions of chemical and biological
transformation allowed easier analysis of
sorption/desorption processes in the experimental
configurations of this work.
Sodium azide (NaNj) is often used as an inhibitor of
biological activity in experiments like these, however,
because of its strong and broad UV absorption peak at 210 nm
sodium azide was not used in conjunction with diuron in four
of the six experiments. The characteristically prominent UV
absorption mode of sodium azide was exploited in the column
tracer experiments. A buffer solution spiked with sodium
azide was used in these conservative tracer experiments to
Methanol (CH3OH) was used in extraction experiments as
a solvent for diuron and was obtained from EM Science
(Gibbstown, NJ).
3.1.3 Solutions
There were primarily three solutions used in these
experiments: diuron in buffer, diuron in methanol, and
sodium azide in buffer.
The buffer solution consisted of 0.005 M sodium
tetraborate (NagB^O^ • lOHjO) and 0.005 M calcium chloride
dihydrate (CaClg
ͣ
2H2O) in distilled, de-ionized (DDI)
water. This water was obtained from a Corning Model AG-11
Still and Corning Mega-Pure System Model Dl Deionizer
(Corning Glass Works, Corning, NY). The sodium tetraborate
was used as a buffer to help control the pH of the solutions
and the calcium chloride dihydrate was used to improve
particle settling during centrifugation of samples in the
bottle point experiments.
The pH of the buffer solution was adjusted to
approximately 8.40 by the addition of small amounts of
hydrochloric acid (HCl). Extractions of selected sample
bottles were done using methanol to confirm that no
transformation was occurring. This was accomplished using
mass balance considerations with the known influent solute
in solution and extracted solid phases. All of the
inorganic chemicals were obtained from Fisher Scientific
Company (Norcross, GA) and were used as received.
Diuron solutions were obtained by dissolving diuron
(reported 98% pure) from E.I. duPont de Nemours Co.,Inc.
(Wilmington, DE) into either the buffer solution or
methanol. The diuron was used as received and the aqueous
solutions of diuron were filtered to remove undissolved
impurities before using. Filtering was accomplished with a
vacuum filter apparatus and 8-^110 particle retention filter
paper (Whatman, grade 40, Fisher Scientific Company,
Norcross, GA).
3.2 Experimental Methods
This work involved three basic types of experiments:
batch kinetic, batch equilibrium, and column experiments.
The two batch experiment types can be grouped under the
title bottle point experiments. The experiments were
designed to obtain the sorption and desorption parameters of
diuron on typical subsurface media.
UV absorption spectroscopy was chosen for this work.
It was used because of the relative ease of performing the
measurement with the chemicals chosen. The method of UV
absorption spectroscopy has been criticized for its lack of
criticism is a valid one in many instances due to the
characteristically broad and overlapping absorption bands of
many complex molecules. The broadness of the band results
from the large number of available energy transition levels
from the normal ground state and an even larger number of
vibrational and rotational sublevels giving rise to the
broad apparent continuvim around the energy transition level.
Despite these problems, UV absorption can be very useful in
the analysis of simpler molecules and those with widely
spaced energy transition levels. In addition modulation
spectroscopy methods such as derivative absorption
spectroscopy have been employed to further resolve complex,
overlapping spectra (Hawthorne et al., 1984; Cavinato et
al., 1990; Karstang and Kvalheim, 1991). Such techniques
would be required in field analyses of organic contamination
because of the presence of spectrally interfering natural
organic materials.
Ultraviolet absorption spectroscopy was chosen as the
appropriate technique for the analyses of diuron in the
aqueous phase because of the pesticide's relatively strong
absorbance peak at approximately 248 nm. Preliminary
studies were performed to confirm that this peak occurred at
approximately 248 nm with several different molar
concentrations of diuron. The XJV absorbance spectrum of
diuron from 230 nm to 300 nm is given in Figure 3-1. A
0.500
0.400
Z3<
CD
^ 0.300
o o en
< 0.200
CD > D CD
^ 0.100
O.OOQ
'230 244 258 272 286 300
, , „ Wavelength (nm)
types of experiments and a fiber optic spectrophotometer was
used for a batch kinetic study and several subsurface media
column experiments. The general methods for both the
conventional and fiber optic spectrophotometers are
described in Section 3.3.
3.2.1 Control Experiment
A short term bottle point sorption kinetic experiment
was carried out using sodium azide in buffer to confirm that
sodium azide did not exhibit significant sorption effects
with the Wagner soil. These experiments allowed the use of
sodium azide as a conservative tracer for use in the
subsurface media column experiments. The procedure for this
experiment was the same as that for the diuron sorption
experiments, which is described in detail below. The UV
absorbance spectrum of sodium azide from 230 nm to 300 nm is
2.000
1.600
D<^
CD O
1.200
aJD
i_ o
CO n
<
0.800
Q) >
*•+-ͣ
O CD
(Y
0.400
0.000_
'230
244 258 272 286 300
Wavelength (nm)
3.2.2 Sorption/Desoirption Batch Kinetic Experiments
These experiments were designed to approximate the
behavior of completely mixed batch reactors and were carried
out in two experimental configurations. The first
configuration used conventional 40-ml Kimax™, round bottom,
borosilicate glass, centrifuge bottles as the individual
batch reactors. The second configuration used custom
fabricated 39-ml Suprasil™ centrifuge bottles, which allowed
UV spectroscopic analysis directly in the bottle.
3.2.2.1 Conventional Configuration
The general procedure for sorption kinetic experiments
consisted of the following steps:
1. A predetermined mass of Wagner subsurface media
(usually 5.0 grams) was weighed and placed in each of a set
of the borosilicate centrifuge bottles.
2. A predetermined volume of buffer solution without
diuron (usually 12.5 ml) was pipetted into each of the
bottles. The bottles were then sealed with Teflon™ lined
caps and allowed to set overnight in order to completely wet
the soil.
3. The following day, the caps were removed and a
buffer solution (usually 12.5 ml) was added to each sample
bottle to attain the desired subsurface media to solution
ratio (grams of solid to ml of solution). The initial
concentration (C^) was determined from the known
concentration of delivered diuron in buffer and the total
volume of buffer solution in the centrifuge bottle. C was
also measured by UV spectroscopy. Each bottle was
considered a separate data point and a blank bottle was
carried for each data point. Blank bottles were made using
the same procedure as the sample bottles except when the
diuron in buffer solution was added to the sample bottles, a
pure buffer solution of the same volume was added to the
blank bottles instead. These blank bottles were used to
account for any noise in the measured UV absorption spectra
contributed by desorption of natural organic matter from the
Wagner soil.
4. All of the bottles were then re-sealed and packed
in a plastic tub which in turn was placed on a tumbler.
Using this arrangement, the bottles were turned end-over-end
at 4.05 rpm.
5. Two samples and their corresponding blanks were
removed from the tumbler at specific time intervals. The
time intervals were chosen to best characterize the sorption
rate behavior of diuron on the Wagner soil. The two samples
and two blanks were immediately centrifuged at 1565 times
separate the liquid and solid portions of the sample.
Approximately 10 ml of the supernatant was then removed from
each of the bottles, placed in four 25-ml borosilicate
sample vials (Pierce Chemical Company, Rockford, XL), and
saved for spectroscopic analysis performed at a later date.
Mass balance measurements performed on some of the samples
indicated that diuron sorption onto the glass vials was
minimal.
3.2.2.2 Suprasil* Configuration
The Suprasil™ bottle procedure was slightly different
than the borosilicate glass procedure described above.
Suprasil™ is a type of fused quartz that has high
transmission properties in the UV wavelength range.
Centrifuge bottles (eight) were made out of 24-mm diameter
Suprasil™ tubing by University Research Glassware Corp.
(Carrboro, NC). Six bottles were used in the experiment:
two bottles contained the diuron solution and soil; two
bottles contained buffer solution and soil; one bottle
contained no subsurface media and the diuron solution; and
one bottle contained no subsurface media and the buffer
solution. The two sample and two blank bottles were
prepared in the same manner as the conventional borosilicate
bottles, and the two remaining bottles without subsurface
diuron solution and sealed at the same time as the sample
and buffer bottles. The six bottles were sealed with
Teflon™ caps and comprised the batch reactor set. They were
tumbled as in the other batch kinetic experiments until the
prescribed measurement time. The bottles were then
carefully centrifuged at 1565 g's for 30 minutes and the
supernatant absorbance was measured directly through the
Suprasil™ bottle by both the Perkin Elmer and the Guided
Wave spectrophotometric instruments described below. The
bottles were then replaced on the tumbler until the next
measurement. This technique permitted non-destructive,
repetitive analysis of each sample. Measurements were made
weekly for the first 8 weeks and biweekly for the final two
sets. At no time were the seals on the bottles broken.
3.2.2.3 Desorption Experiments
Desorption rate experiments were configured with the
borosilicate centrifuge bottles only. The procedure for
performing a desorption experiment was the same as that for
the sorption experiment described above through step four.
Once all the bottles were tumbling, they were all allowed to
sorb for a determined length of time (2 weeks). The
following procedure was then used to continue the
1. All of the bottles were taken off of the tumbler
simultaneously and immediately centrifuged at 1565 g's for
30 minutes.
2. The bottles were then uncapped and a known volume
(22 ml) of supernatant was removed from each bottle and
saved for spectroscopic analysis.
3. A known volume (22 ml) of pure buffer solution was
then delivered to each bottle and the bottles were recapped
and replaced on the tumbler.
4. Two samples and their corresponding blanks were
removed from the tumbler at specific time intervals. The
time intervals were chosen to best characterize the
desorption rate behavior of diuron on the Wagner soil. The
two samples and two blanks were immediately centrifuged at
1565 g's for 30 minutes in order to separate the liquid and
solid portions of the sample. Approximately 10 ml of the
supernatant were then removed from each of the bottles,
placed in four 25-ml borosilicate sample vials, and saved
for spectroscopic analysis performed at a later date.
3.2.3 Sorption/Desorption Batch Equilibrium Experiments
These experiments were set up in the same manner as the
batch kinetic experiments, but, the initial diuron in buffer
concentrations delivered to the samples was varied. This
isotherm curve. At least two replicates of each fluid phase
concentration were carried and each sample had a
corresponding blank bottle with pure buffer, as in the rate
experiments. The results of the sorption rate experiments
gave the necessary time for the approach of the sorption
process to equilibrium. However, true equilibrium
conditions were not achieved. All of the bottles were
tumbled for this time and then removed from the tumbler and
spectroscopically analyzed similarly to the kinetic
experiments. The solid phase concentration was determined
from mass balance considerations. Since diuron is
conservative under these experimental conditions, the solid
phase concentration was found from the difference between
the initial and final fluid phase concentrations, as
follows:
g,-^(C,-Cj (3-1)
where q^ is the solid phase solute concentration at
equilibrium, V is the volume of fluid, M is the mass of
solid, C^ is the initial solute concentration in the aqueous
phase, and C is the solute concentration in the aqueous
cheeked by performing solid phase extractions of selected
samples.
3.2.4 Solid-phase Extraction
The solid phase diuron extraction procedure was as
follows:
1. A known volume of the supernatant (20 ml) was
removed from the sample and blank after centrifugation. This
supernatant was spectroscopically analyzed and the diuron
content determined. A known volume of methanol (10 ml) was
immediately added to the bottles containing the mostly
drained solid phase. The bottles were then resealed and
replaced on the tumbler. The diuron on the solid phase
desorbs into the liquid phase because of the large
partitioning driving force of the diuron from the solid
phase to the methanol.
2. After three days, the bottles were centrifuged and
the same volume of methanol that was added previously was
removed and stored in a volumetric flask. The same volume
of fresh methanol was then added to the bottles. The
bottles were then resealed and replaced on the tumbler as in
step 1. This step was repeated for a total of five methanol
additions and subsequent removals.
3. After the fifth removal of methanol from the
amount of additional pure methanol was added to the flask to
bring it to a known volume if necessary. The diuron in
methanol solution was assumed to contain all of the diuron
that was in the solid phase of the sample. This solution
was spectroscopically analyzed and mass balance was checked
based on a comparison with initial concentrations (C^) and
the measured aqueous phase concentrations prior to the
addition of methanol.
3.2.5 Column Experiments
A diagram of the column experimental apparatus is given
in Figure 3-3. Two reservoir flasks are shown in the
figure. One flask contained pure buffer solution, and the
other contained the buffer solution with diuron (or sodium
azide). The volume of the flasks chosen was dependent on
the flow rate and cumulative flow time chosen. A miniPump™
positive displacement pump (LDC Analytical, Riviera Beach,
FL) was used to maintain a constant flow of solution through
the column. All of the tubing in the set up was made of
regular grade 304 stainless steel (Supelco,Inc., Bellefonte,
PA). All of the materials in the apparatus were chosen to
minimize spurious sorption to the apparatus. The glass
columns were approximately 7.5-cm long, 2.4-cm internal
diameter; and equipped with threaded Teflon™ end caps. The
GUDEDWAVE
MONOCHROMATOR
FIBEROPTIC Deuterium
Source
n
GRABSAMPLE\
FIBEROPTIC
BUFFER
II
ft A A
SOLUTE
^1
C^
VALVE
mm
SUB SURFACE
MEDIA COLUMN
t
miniPump
Glassware Corp. (Carrboro, NC).
The columns were packed with the subsurface media in
the following procedure:
1. The buffer solution was pumped through the system
and slightly into the bottom Teflon™ endcap orifice at the
bottom of the column. A thin piece of silane treated glass
wool was placed over the orifice and a preweighed amount of
glass beads (McMaster-Carr Supply Company, Dayton, OH) was
carefully poured into the column over the wool. The beads
had a mean diameter of 0.38 mm and were included to disperse
the solution more evenly before it entered the Wagner
subsurface media. The sorption of diuron onto the glass
beads was assumed to be negligible in comparison to that of
the subsurface media. A preweighed amount of Wagner
subsurface media was then carefully poured on top of the
glass beads. The pouring of the glass beads and the
subsequent pouring of the subsurface media into the column
was done incrementally to enable the experimenter to pack
the media in the column by manually vibrating the column.
Sufficient fluid was allowed into the column to facilitate
this packing. A top layer of preweighed glass beads was
then carefully poured on top of the subsurface media and the
Teflon™ endcap screwed on. The top orifice of the end cap
was also covered by a piece of silanized glass wool. The
The fiber optic spectrophotometer sensing element was placed directly downstream of the column. Grab samples were taken approximately 20 cm after that.
Buffer solution was pumped through the column for at least 24 hours prior to the beginning of the experiment. This was done for two primary reasons: to adjust and
stabilize the flow velocity through the system, and to flush out easily removed NOM in the subsurface media and stabilize its release during the experiment. NOM contributes to the absorption measured at the diuron peak wavelength and
interferes with the accurate assessment of the diuron
concentration. It was found that flushing the system minimized this effect.
The experiment was initiated by switching the feed to the pump from the buffer reservoir to the diuron solution reservoir. Care was taken prior to this point to clear all fluid lines of air.
The diuron solution was pumped for 36 hours. During this time, grab samples were taken at appropriate intervals to describe the behavior of the sorption. Grab samples were taken every 15 minutes for the first four hours, every hour
for the next eight hours and every two hours for the rest of the sorption period. These grab samples were later analyzed
by a conventional UV-VIS absorption spectrophotometer. At a
flow rate of approximately 12 ml/hr, the minimum allowable
constrained by the volvune requirements of the conventional spectrophotometer and cuvette chosen. Wavelength scanned samples were also acquired at 15 minute intervals during the
sorption period by the fiber optic spectrophotometer. The
minimum time between samples allowed here is the time for a sample scan to be acquired. For the wavelength interval chosen for the first column, Col-1, (230 nm to 265 nm, .5 nm step), a scan was taken in approximately 30 seconds. The second column's (Col-2) wavelength interval was slightly different (230 nm to 300 nm, 1.0 nm step), and the scanning time was approximately 40 seconds.
At the end of the 36 hour sorption period, desorption was initiated by pumping buffer solution through the column. The desorption period was at least 36 hours. The same
sampling procedures described above were used for the desorption period.
After a relative equilibrium was attained for the
desorption portion of the experiment a conservative tracer
study was begun. This was achieved by replacing the diuron
solution with a solution of sodium azide. Switching the
The fiber optic spectrophotometer sampled and stored
data every 15 minutes for the diuron experiments and every
five minutes for the tracer experiments. The sample
consisted of the average of three continuous scans of a
wavelength range chosen to include the full absorption peak.
Grab samples of the effluent of the system were also
taken throughout the experiment and analyzed by conventional
absorption spectroscopy. Samples were collected in pre and
post weighed 25-ml borosilicate glass sample vials with
Teflon™ lined screw caps (Pierce Chemical Company, Rockford,
IL). The time interval of these samples was limited by the
amount needed to perform spectroscopy (4 ml). These samples
were taken to verify the performance of the fiber optic
spectrophotometer and to verify the flow rate of the
experiment. Influent samples of both reservoirs were taken
periodically and spectroscopically analyzed later.
The tracer tests were performed to determine the
dispersion in the column. Fiber optic scans were performed
every 5 minutes during both the step-up and step-down
periods. Sodium azide was chosen because it was determined
that an anionic inorganic solute would have little sorption
or ion exchange effects with subsurface media. This was
confirmed by a sodium azide batch sorption kinetic study
performed earlier.
Influent samples of the diuron, sodium azide, and
experiments and analyzed by conventional absorption spectroscopy.
3.3 Instrument Description and Measurement Procedure
Conventional UV absorption spectrophotometry was performed with one of two comparably performing
spectrophotometers. The first used was a Perkin Elmer Lambda
3 UV/VIS Spectrophotometer (The Perkin-Elmer Corporation,
Oak Brook, XL). This spectrophotometer was used until its source lamp output intensity had decreased to the point at
which the instrument's dynamic range was significantly
diminished. A Hitachi Model U 2000 (Hitachi Inc.) was then
used for the remainder of the experiments. The Hitachi was
found to perform with equal or better resolution than the Perkin Elmer. A Guided Wave Model 200 Optical Waveguide
Spectrum Analyzer (Guided Wave, Inc., El Dorado Hills, CA)
was used for a batch kinetic study and several subsurface
media column studies.
3.3.1 Conventional Spectrophotometry
The Perkin Elmer Lambda 3 UV/VIS and Hitachi
instruments are dual beam UV/VIS spectrophotometers, which
utilize a constant reference cell holding a cuvette that can
For nearly all experiments that were conducted here,
distilled, de-ionized (DDI) water was used in the reference cell. Methanol obtained from Fisher Scientific Company
(Norcross, GA) was used as received as the reference liquid for the remaining experiments. Both instruments have two available light sources: a tungsten bulb for visible and
near infrared, and a deuterium lamp for UV. The UV source
was used for all the experiments that were performed, the visible light source was used to initially align the cell holders for the experiments. Both instruments perform a
series of diagnostic self-checks on startup and constantly
correct for probe light variations by monitoring the output of the source lamp through the reference cell. The
instruments have a zeroing function that along with the previously mentioned features sets the dynamic range of the
instrument for a particular experiment. Both instruments have a reported accuracy below 0.001 absorbance units (Au).
The sample cuvette was filled with the reference liquid
and the wavelength set for 248 nm in order to zero the
instrument for all of the experiments. Both instruments had
a very stable and repeatable baseline for all of the experiments performed.
Two cell holders were designed and fabricated by the
UNC shop in addition to the standard l-cm pathlength cuvette
holders that came with the instruments. These cell holders