Water Adsorption at Hydrophobic Interfaces Revealed by NMR
Arjun Raghavan Faculty adviser: Prof. Yue Wu
UNC-Chapel Hill Department of Physics and Astronomy Honors Thesis
Acknowledgements
Abstract
Understanding the complex effects of hydrophobic interfaces is of central importance in analyzing numerous interactions in nature. Using nuclear magnetic resonance (NMR) techniques, water adsorption at hydrophobic interfaces is studied. The nucleus independent chemical shift (NICS) effect, caused by diamagnetic ring currents on the hydrophobic carbon surface, provides a sensitive measure of distance from interfaces. In porous activated carbon, it is found that during water adsorption, one NMR spectrum peak stays constant as the water loading level is increased, while the other peak shifts consistently. Hence, using NICS NMR and supplementary tests, it is concluded that in activated carbon, water adsorption occurs through the two
simultaneous processes of clustering on surface sites and cooperative bridging across pores. In sum, NMR techniques are utilized to analyze the dynamics of adsorption at hydrophobic
Introduction
Understanding the behavior of molecules near hydrophobic interfaces is of interest in a wide array of scientific problems and technical applications, from biological processes to energy conversion.1 The properties of molecules in these regions are, in many cases, substantially different from their properties in the bulk phase. This variation in behavior can be attributed in part to the introduction of the interface and in part to the intricate interplay of molecule-molecule and molecule-interface interactions.
Though analytical methods including atomic force microscopy, scanning tunneling microscopy, and x-ray photoelectron spectroscopy have previously been used to study the effects of interfaces, they are not ideally suited to study water adsorption in intricate porous networks due to their inability to provide information on the dynamics occurring inside the pores
themselves. The majority of corresponding computational investigations make use of Lennard-Jones potentials and associated water models.2
The present work uses a newly developed and powerful nuclear magnetic resonance (NMR) imaging method to look inside nanoscale pores and acquire structural and dynamic information of fluids at hydrophobic interfaces. This imaging capability is not based on applying an external magnetic field gradient as in conventional magnetic resonance imaging (MRI); instead, it makes use of a field gradient generated by the graphite-like carbon surface examined. The internal field gradient is extremely strong in close, nanoscale proximity to the carbon surface, giving rise to a substantial nucleus-independent chemical shift (NICS). Specifically, the
1 Chmiola, J.; Yushin, G.; Gogotsi, Y.; Portet, C.; Simon, P.; Taberna, P. L. Anomalous Increase in Carbon Capacitance at Pore Sizes Less Than 1 Nanometer. Science 2006, 313 (5794), 1760-1763.
nucleation and growth process of pure water in carbon derived from polyetheretherketone (PEEK) is studied.
The novelty of this study lies in its extensive use of NMR techniques for providing a direct local structural picture of nucleation and growth inside nanoscale pores. While the isotherm technique has been commonly used to examine adsorption in activated carbon, it is unable to capture the dynamics occurring inside the pores themselves. This work provides a glimpse of the possibilities for furthering the understanding of these phenomena by way of NMR.
Experimental and Theoretical Background
Sample Preparation
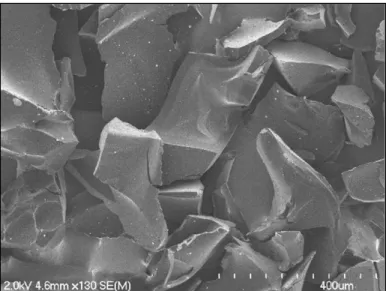
The methods of Song, et al. (2017) are used.3 An activated carbon derived from the high-temperature polymer, polyetheretherketone (PEEK) is studied. Preparation of the sample consists of two procedures, carbonization and activation. Firstly, during carbonization, 2 g of granulated Victrex PEEK is heated in an argon gas tube at 900 °C for 30 minutes. This results in the carbonized product, which is then cooled down to room temperature while in an argon environment. The sample is then ground into fine particles before activation. During the activation process, water steam is introduced, which enlarges the micropores created by carbonization. The finely ground sample is oxidized at 900 °C under the water steam, and is carried by an Ar gas flow, for varying time periods. The duration of these activation times allows for the creation of samples with different micropore sizes. During activation, mass is lost. In this
Figure 1. SEM image of PEEK60; the scale is 400 µm. Image courtesy (4).
study, the sample, labeled as PEEK-90, is heated until 90% of the mass is ‘burned off’; the value 90% gives the ratio between the mass of the sample after activation and the mass of the sample before activation, but after carbonization.3,4
NMR Methods
Historical Background: In 1924, Wolfgang Pauli postulated the quantum mechanical property of spin angular momentum. Prior to this, Gerlach and Stern had already
confirmed the existence of magnetic moments in nuclei. The groups of Purcell and Bloch, in 1946, completed the first successful solid-state NMR measurements, and in 1950, Hahn pioneered pulse excitation. The next year, Arnold obtained the first high-resolution spectra of proton chemical shifts, and in the following decade, Anderson and Ernst would use computer technology to advance NMR using Fourier transform calculations. The
1970’s brought rapid growth to the field of NMR as imaging techniques such as MRI scans were developed.5
Principles: Quantum mechanical spin is a fundamental property of all elementary
particles. It is a form of intrinsic angular momentum, and spins add in a particular manner to yield an overall spin for a nucleus. The formalism of quantum mechanics shows that spin is quantized and can take on only discrete values; moreover, the spin of an
elementary particle cannot be changed. Not all nuclei have a net spin; for example, the spin of the 12C nucleus is 0. The spin of the 1H nucleus, however, is ½, which is crucial in proton NMR. The classical analogy of spin angular momentum is an object rotating about its own axis; the analogy fails, however, because, for instance, electrons are point
particles.6 A spin in a magnetic field can be pictured as precessing around the field. For nuclear spins, the frequency of precession is known as the Larmor frequency.6 The formula for the Larmor frequency is given as ω0=-γB0, where ω0 is the Larmor
frequency, B0 is the magnetic field strength, and γ is known as the gyromagnetic ratio. The gyromagnetic ratio depends on the mass, charge, and the so-termed ‘g-factor,’ a quantum mechanical value derived from the interactions within the nucleus or properties of the fundamental particles involved. Spins are rotated by a radio-frequency (RF) pulse. The pulse, which is applied for a specified time based on the degree of rotation desired, is created by an oscillating electric current in a coil which creates a rotating radiofrequency field. Though this field is weaker than the static field, it rotates at the rate of the
5 Hank, J. Operating Manual for NMR Pulse Spectrometer PS 15. TEL-Atomic Incorporated. 2006.
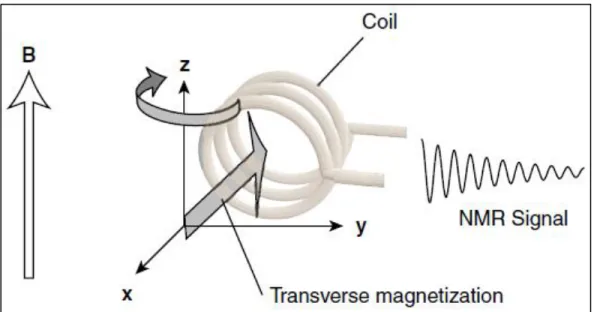
Figure 2. Elements of NMR experiment. The static ‘B’ field is set-up by the NMR spectrometer; the coil allows for the free-induction decay NMR signal to be measured. A radiofrequency pulse rotates the spins so the precessing transverse magnetization, perpendicular to the static field, can be measured. Image courtesy (6).
precession (Larmor) frequency. Hence, the effect accumulates and can rotate the spins to various degrees. The oscillating electric current which is induced by the precessing transverse magnetization, following a pulse sequence, for example, is termed the NMR signal, or free-induction decay. The free-induction decay (FID) is measured by the NMR spectrometer, which also is the device applying the large static field and the
radiofrequency pulses which rotate spins.6 FID signals are then converted form the time-domain to the frequency-time-domain NMR spectrum by Fourier transformation.7 Figure 2 shows certain essential elements of an NMR experiment.6
Experimental: The 1H magic angle spinning (MAS) NMR spectra are all measured at 400 MHz with a TECMAG APOLLO spectrometer and Chemagnetics 4 mm MAS probe at a
spinning speed of 8 kHz; the temperature is 296 K. Prior to NMR measurements, approximately 20 mg of the carbon sample is loaded into a 4 mm MAS NMR rotor. If necessary, the sample is dried at 90 °C in vacuum for 24 h to remove preadsorbed water. Then, a background 1H NMR spectrum of the pure carbon sample is first recorded, typically showing a weak, broad peak; in PEEK-90, for example, the full width at half-maximum of this background spectrum is approximately 40 ppm. This is then subtracted from all presented spectra. For water adsorption measurements, varying amounts of water vapor are added by placing the sample in a saturated water vapor system at room
temperature; for larger amounts of adsorbed vapor, the sample is immersed for a longer period, though the relationship is not consistently linear. The amount of water loaded is determined by finding the mass difference between the vapor-loaded sample and the initial, dry sample.3 A single-pulse excitation with a pulse duration of 5 µs and a 5 s relaxation delay is applied.
Chemical Shift Tests Theory: The nucleus independent chemical shift (NICS) is of critical importance in the present work. The theory, pioneered by Ditchfield (1974) begins by obtaining the electronic Hamiltonian which describes a closed-shell molecule in a magnetic field due to the cumulative effects of a uniform external field and the dipole fields which are consequences of nuclear magnetic moments.8 For a uniform external magnetic field H and dipole fields µ, with nuclei at positions RB, RD, etc., the form of the Hamiltonian, in atomic units, is as follows: H(H, µ) =
1
2∑ ((pj+( 1 c)A
'(r j))
2
j -2∑BZBrj,B-1)+∑j≠1∑rjl-1+∑B≠D∑ZBZDRBD-1 (Equation 1).
8Ditchfield, R. Self-consistent perturbation theory of diamagnetism I. A gauge-invariant LCAO
In Equation 1, c is the velocity of light, the sum over j sums over all electrons, and the sum over B sums over all nuclei. The second term represents the electron-nucleus
contributions, the third term represents the electron-electron contributions, and the fourth term corresponds to the nucleus-nucleus contributions to the potential energy. The vector potential A'(rj), describing the total magnetic field at the position of electron j is as follows: A'(rj) = 12H×rj+ ∑B(µB×rjB)rjB-3 (Equation 2). In Eq. 1 and Eq. 2, rj is the distance vector from an electron and R describes the distance vector from a nucleus; Z is the charge on a nucleus. Perturbation theory is then used to solve the Schrödinger equation to find the wavefunction describing a molecule. Density functional theory (DFT) is a computational quantum mechanical modelling method incorporating these theoretical principles. In the present study, the NICS effect occurs due to the ring currents from delocalized π electron orbitals in the graphite-like aromatic carbon surface
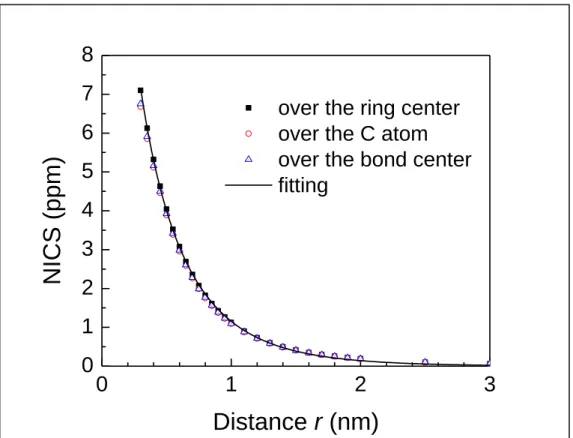
producing a diamagnetic response, and reducing the local magnetic field at the nucleus near the carbon surface. This, in turn, reduces the Larmor frequency measurement. Using DFT calculations, it has been shown in Xing, et al. (2014) that the NICS value of a nucleus will increase rapidly as the distance between the nucleus and carbon surface decreases, especially at dimensions close to one nanometer.4 The NICS value δNICS is given as a function of the distance r between the carbon surface (carbon atom center) and probe atom (probe atom center) as: δNICS (r) = Aexp((- r
r0)
β
)+ Aexp(-(d-r r0 )
β
Figure 3. The NICS effect in slit-shaped pores. The x-axis gives the distance in nm from the center of the carbon surface atoms. Figure courtesy (4).
0
1
2
3
0
1
2
3
4
5
6
7
8
over the ring center
over the C atom
over the bond center
fitting
NICS (pp
m)
Distance
r
(nm)
Isotherm Theory and Experimental Methods
An in-situ NMR-based method is employed to measure the water isotherm of the PEEK-90 sample. The vapor pressure of water is controlled by adjusting valves near the buffer
chambers, while the sample’s temperature was controlled by manipulating the airflow
temperature of the flow outside the quartz NMR tube. The NMR spectra were used to determine the amount of adsorption inside the sample. Free-induction decay (FID) signals were measured and the intensity of peaks was used to quantify adsorption, according to the method described in Chong, et al. (2015).9 T isotherm at 295 K is measured at the 1H frequency, 34.3 MHz. The PEEK-90 sample is first heated to 50 °C and evacuated for 24 h to remove any preadsorbed water. The 1H FID signal of the dry sample is acquired by single-pulse excitation with a pulse time of 8 µs. A broad peak of 750 ppm (full width at half-maximum) is observed in the
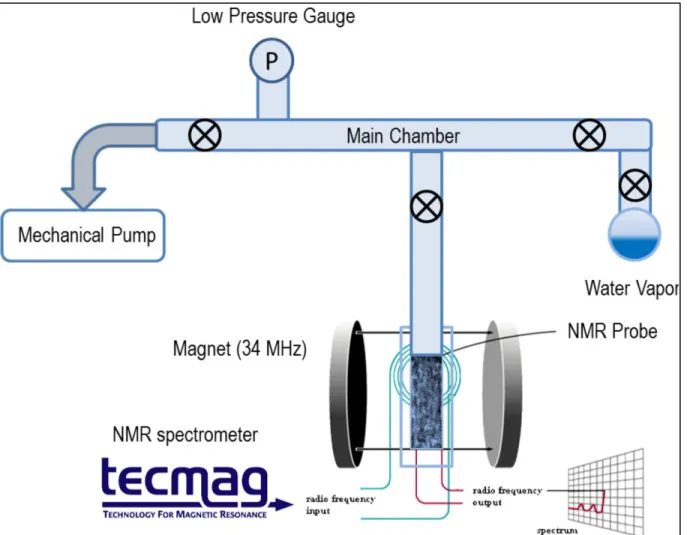
background spectrum and is subtracted from all spectra. Water vapor is loaded to the sample at different vapor pressures and the NMR spectra of the hydrated samples are measured. The loaded water mass at saturation is found by direct weighing, while pre-saturation masses are determined based on intensity; the adsorption isotherms are obtained by plotting the water-carbon mass ratios as a function of vapor pressure.3 The set-up is shown in Figure 4.10
9Chong, Y.; Kleinhammes, A.; Tang, P.; Xu, Y.; Wu, Y. Dominant Alcohol–Protein Interaction
via Hydration-Enabled Enthalpy-Driven Binding Mechanism. The Journal of Physical Chemistry B 2015, 119 (17), 5367-5375.
Figure 4. In-situ water loading system with NMR spectrometer. Isotherm measurements are made using this set-up. Image courtesy (10).
T1 Measurements Theory
Figure 5. T1 measurement inversion-recovery pulse sequence. Spins are rotated first by a π radiofrequency pulse. They relax to thermal equilibrium over different delay time durations τ. After this time passes, a second π/2 radiofrequency pulse is applied. The intensity of the Fourier transform peak of the resulting FID signal is measured. Image courtesy (6). The curve which results when the signal intensity is plotted against τ gives the T1 time. The corresponding equation is given as follows, with M giving the magnetization of the 1H nuclei and M0 signifying the equilibrium magnetization: M (t)
M0 =1-2 exp
(-t
T1) (Equation 4). For short delay
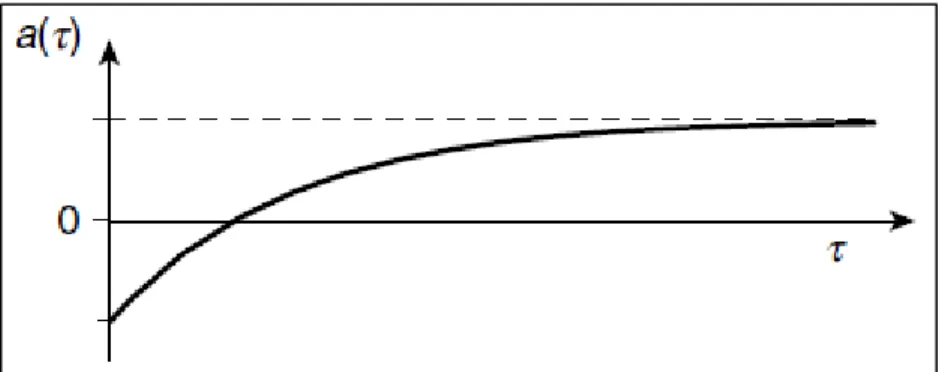
Figure 6. Magnetization intensity as a function of the delay time τ in the inversion-recovery pulse sequence. The value shifts from negative to positive as the delay times gets longer. The
characteristic time of the exponential fit of this curve is the T1 value. Image courtesy (6).
Given a model in which the 1H T1 relaxation process in water is dominated by the fluctuations of intramolecular proton-proton dipolar interaction, T1 is determined by:
1 T1=
3µ0γ4ħ2
160π2r6(
τ 1+ω02τ2+
4τ
1+4ω02τ2)(Equation 5), where γ is the gyromagnetic ratio of a proton, ħ is the
reduced Planck constant, r = 0.156 nm is the distance between the two protons in a water molecule, µ0 is the magnetic permeability of free space, τ is the rotational correlation time, and ω0/2π is the Larmor frequency, 400 MHz.11 Importantly, τ, the correlation time, gives the amount of time needed for a molecule, in this case H2O, to rotate by one radian. A small value of τ implies fast molecular motion, whereas large τ corresponds to slower motion.
Figure 7. The 1H MAS NMR spectrum is used to determine pore size distribution inside PEEK90 micropores. The left peak corresponds to water in the intergranular spaces and larger mesopores. The inset figure gives the pore size distribution based on the range of chemical shifts from the spectrum.
Results and Discussion3
Pore Size Distribution
The average pore size, analyzed using the results displayed in Figure 3, is then approximately 1.90 nm. Critically, the full width at half maximum (FWHM) is only 0.20 nm, suggesting that the pore size distribution of PEEK90 is relatively very uniform. This uniformity is important to be able to interpret shifts in NICS values as nucleation and growth processes inside micropores without confounding with filling of pores of different sizes at different filling levels leading to characteristic changes in chemical shift values.
While the NMR spectrum in Figure 7 shows a fairly small spread, to confirm the high level of uniformity in PEEK90, it needs to be ascertained that exchange between pores is not occurring on, or faster than, the NMR timescale. If such rapid exchange were happening, motional narrowing effects may alter the spectrum. Specifically, motional narrowing results when exchange is much faster than the NMR timescale such that spins have insufficient time to dephase at varying sites within an inhomogeneous environment. Hence, even if there were large differences between areas, it would not be reflected in the NMR spectrum9. This possibility can be confirmed or ruled out using two-dimensional (2D) NMR. In 2D exchange spectroscopy (2D-EXSY), an initial 90° pulse is followed by varying waiting times and a second 90° pulse. Then, a fixed mixing interval is allowed to pass before a third 90° pulse. The spectra in the two waiting times are recorded and plotted together, as shown in Figure 8. The presence of diagonal peaks and the absence of cross peaks shows that the chemical shift does not change despite the mixing interval.Since this trend is observed for short (5 ms), medium (30 ms), and long (50 ms) times, all longer than the NMR timescale of approximately 0.5 ms, it is evident that there is no
Figure 8. The 2D-EXSY tests show only diagonal peaks and no cross peaks at short (5 ms), medium (30 ms), and long (50 ms) mixing intervals. Since these intervals are all significantly longer than the NMR timescale of approximately 0.5 ms, the results confirm that there is no significant exchange between micropores on this timescale.
Chemical Shift Tests
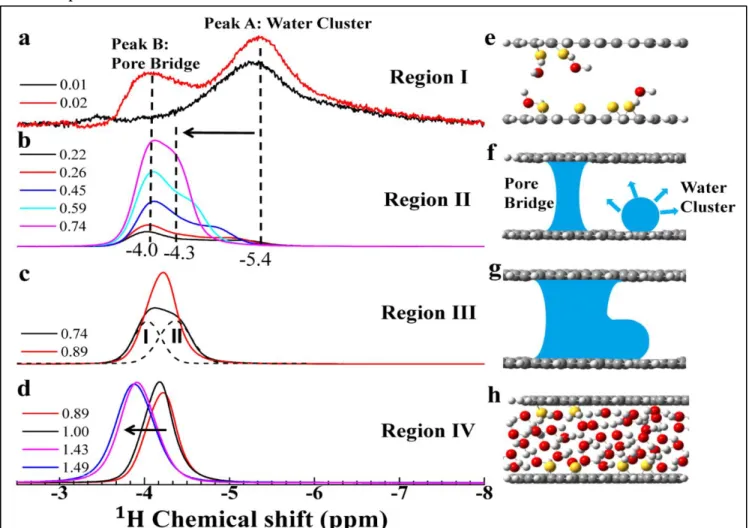
Figure 9 displays the critical results of the chemical shift tests for water adsorption, leading to an interpretation of the mechanism for nucleation and growth. At the lowest filling levels, θ = 0.01 and θ = 0.02, two peaks are visible, as seen in Figure 9(a). As more water is progressively added, from θ = 0.22 to θ = 0.26 and onwards to θ = 0.71, it is evident that the left peak remains at the same chemical shift value, near -4.0 ppm, while the right peak shifts with greater amounts of water (Figure 9(b)). Past θ = 0.74, the two peaks combine into one (Figure 9(c)), and as water is added until θ = 1.49, the single peak shifts to the left (Figure 9(d)).
Figure 9. (a), (b), (c), (d) show the chemical shift changes at increasing water loading levels in
PEEK90. Peak A shifts to less negative values as more water is added, suggesting a clustering building from the surface. Peak B stays constant from θ = 0.02 onwards, suggesting a bridge-like structure spanning the pore. The coalescence of these dual structures is eventually reached and the combined single peak shifts left, primarily due to horizontal filling across pores. (e), (f), (g), (h) show schematic representations of the nucleation and growth processes of water adsorption inside microporous PEEK90.
calculated to be 0.35 nm, in agreement with the literature value of monolayer water, 0.37 nm.12 Starting from this result, it is assumed that water molecules associated with Peak A are adsorbed directly on to the carbon surface. Since it is known that the surface itself is hydrophobic, these molecules likely bind to small, hydrophilic oxygen-containing surface functional groups by hydrogen bonding. The differences in environment at these surface sites contributes to the width of the peak.
Starting from θ = 0.02, Peak B becomes well-resolved, and is located near -4.0 ppm. As the filling is increased, Peak B stays markedly constant while Peak A shifts consistently until θ = 0.76. As shown and discussed, a less negative chemical shift corresponds to a greater distance from the diamagnetic effects of the carbon surface, suggesting a clustering growth process beginning at the surface, where the average distance from the surface slowly increases. In the meanwhile, the constancy of Peak A, along with the observation that the clustering NICS value eventually approaches that of Peak A, suggests the forming of a bridge-like structure spanning height of the pore. This formation is a cooperative process, similar to capillary condensation, which occurs due to distinct van der Waals interactions13 in a confined space, which, as supported by previous simulation work, is dependent on the localized density and positions of surface adsorption sites.14 It is also noted that while Peak A does not shift left or right, it does grow in intensity, signaling the formation of a larger number of pore bridges as the water loading level is increased. Continuing filling, at θ = 0.89, it is found that the center of the single peak is in the middle of the centers of the two peaks in the θ = 0.74 spectrum. Specifically, the centers of the peaks in the θ = 0.74 spectrum are -4.03 ppm and -4.36 ppm, whose average is -4.19 ppm, very close to the observed shift of -4.2 ppm of the θ = 0.89 peak. This combining of peaks suggests the coalescing of the pore bridges and water clusters. With more filling, until saturation
13 "Van der Waals forces." The Gale Encyclopedia of Science, edited by K. Lee Lerner and Brenda Wilmoth Lerner, 5th ed., Gale, 2014. Science in Context,
link.galegroup.com/apps/doc/CV2644032336/SCIC?u=unc_main&xid=56734eeb. Accessed 30 Mar. 2017.
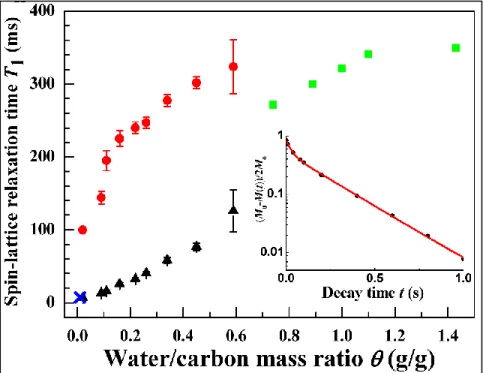
Figure 10. The 1H spin-lattice (T1) relaxation times are displayed, as a function of water loading level. The blue cross represents the initial point, the black triangles, with smaller T1 times, are from the growing surface clusters, and the red circles are from the pore bridges. The green squares are points which arise from the single peak region after coalescence occurs. Error bars for all data points are given by the standard deviation from T1 fitting. The inset figure gives a sample T1 fitting decay curve, with two components, for the loading level θ = 0.16.
at θ = 1.49, the single peak continues to shift to the left, farther, on average from the carbon interfaces, possibly through horizontal filling across and between pores.15
T1 Tests
As described above, and quantified in Equation 5, the T1 spin-lattice relaxation process in water is dominated by the intramolecular proton-proton dipolar interaction and can provide information on the dynamics of adsorption.
Until the green single peak region is reached in Figure 10, two primary T1 values are observed. The molecules in surface clusters are more tightly bound to the carbon interface, on average, and hence have smaller T1 values. Specifically, considering Equation 5, when the clusters are very close to the surface, the rotation time τ is large, making the T1 value smaller. As the clusters grow, the degrees of freedom increase, allowing for a span of T1 times increasing from 10 ms to 110 ms. Simultaneously, the water molecules in pore bridges have more separation, on average, from the carbon surface and hence have larger T1 values; they range between 100 ms and 330 ms. The inset decay curve in Figure 10 allows for fitting with a two exponential components (red line), which yields the two T1 values throughout this region; the fit correlation is high. When the pore bridges coalesce with surface clusters as displayed in Figure 9, only a single T1 value is extractable. This value levels off near 350 ms, close to the literature T1 value for water in fully filled micropores. The behavior found in the present study is corroborated by T1 results reported by Wang, et al. (2014)16 and Gogelashvili, et al. (2004)17.
16 Wang, H.-J.; Kleinhammes, A.; McNicholas, T. P.; Liu, J.; Wu, Y. Water Adsorption in Nanoporous Carbon Characterized by in Situ NMR: Measurements of Pore Size and Pore Size Distribution. The Journal of Physical Chemistry C 2014, 118 (16), 8474-8480.
Implications and Conclusions
In summary, the main results of this study involve the phenomena of water adsorption between interfaces on the nanoscale. The quantum mechanical property of spin angular momentum is manipulated using magnetic fields to develop the techniques of NMR. Ring currents from delocalized π orbitals at the interface cause ring currents which create a diamagnetic response. This affects the NMR spectra in a distinct distance-dependent manner yielding a chemical shift (NICS). The NICS effect is the primary tool used in this work.
Using NICS NMR, T1 pulse sequence tests, and 2D NMR results, it is found that water adsorption in micropores between hydrophobic activated carbon interfaces occurs by two
simultaneous processes. In parts, water molecules cluster onto surface site deformations while in other areas with a higher density and specific orientation of surface sites, cooperative bridging across the pores occurs. These mechanisms yield different patterns in NICS values, allowing the measurement of this process. Eventually, the pore bridges and clusters coalesce and the entire structure becomes filled.
Thus, nuclear magnetic resonance provides a powerful method for studying adsorption. The effects of interfaces in nanoscale confinement are very significant and the dynamics of liquids and solutions inside these spaces can be discovered with NMR. Applications of this work and the techniques used herein abound. In biology, medicine, climate science and energy
conversion, and other fields, the possibilities are innumerable and continued work improving on the precision of pulse sequences, expanding on the nuclei studied, and building on the
References
1. Chmiola, J.; Yushin, G.; Gogotsi, Y.; Portet, C.; Simon, P.; Taberna, P. L. Anomalous Increase in Carbon Capacitance at Pore Sizes Less Than 1 Nanometer. Science 2006, 313 (5794), 1760-1763.
2. Gregg, S.J.; Sing, K.S.W. Adsorption, Surface Area, and Porosity. Academic Press: 1982.
3. Song, Y., Chong, Y., Raghavan, A., Xing, Y., Ling, Y., Kleinhammes, A., Wu, Y. Nucleation and Growth Process of Water Adsorption in Micropores of Activated Carbon Revealed by NMR. Journal of Physical Chemistry C 2017, 121, 8504-8509.
4. Xing, Y.-Z.; Luo, Z.-X.; Kleinhammes, A.; Wu, Y. Probing carbon micropore size distribution by nucleus independent chemical shift. Carbon 2014, 77, 1132-1139. 5. Hank, J. Operating Manual for NMR Pulse Spectrometer PS 15. TEL-Atomic
Incorporated. 2006.
6. Levitt, Malcolm H. Spin Dynamics: Basics of Nuclear Magnetic Resonance. Chichester: John Wiley & Sons, 2001. Print.
7. Hank, J. Experimental Manual for NMR Pulse Spectrometer PS 15. TEL-Atomic Incorporated. 2006.
8. Ditchfield, R. Self-consistent perturbation theory of diamagnetism I. A gauge-invariant LCAO method for N.M.R. chemical shifts. Molecular Physics 1974, 27 (4), 789-807. 9. Chong, Y.; Kleinhammes, A.; Tang, P.; Xu, Y.; Wu, Y. Dominant Alcohol–Protein
Interaction via Hydration-Enabled Enthalpy-Driven Binding Mechanism. The Journal of Physical Chemistry B 2015, 119 (17), 5367-5375.
10. Wang, Haijing. "NMR Study of Water in Nanoscopic Confinement and at the Interface of Biomolecules." Thesis. University of North Carolina at Chapel Hill, 2011. Print.
11. Abragam, A. The principles of nuclear magnetism. Oxford University Press: 1961. 12. Xu, K.; Cao, P.; Heath, J. R. Graphene Visualizes the First Water Adlayers on Mica at
Ambient Conditions. Science 2010, 329 (5996), 1188-1191.
Mar. 2017.
14. Muller, E. A.; Rull, L. F.; Vega, L. F.; Gubbins, K. E. Adsorption of Water on Activated Carbons: A Molecular Simulation Study. The Journal of Physical Chemistry 1996, 100 (4),
1189-1196.
15. Talu, O.; Meunier, F. Adsorption of associating molecules in micropores and application to water on carbon. AIChE Journal 1996, 42 (3), 809-819.
16. Wang, H.-J.; Kleinhammes, A.; McNicholas, T. P.; Liu, J.; Wu, Y. Water Adsorption in Nanoporous Carbon Characterized by in Situ NMR: Measurements of Pore Size and Pore Size Distribution. The Journal of Physical Chemistry C 2014, 118 (16), 8474-8480. 17. Gogelashvili, G. S.; Vartapetyan, R. S.; Ladychuk, D. V.; Grunin, Y. B.; Khozina, E. V.