Abstract: This paper characterizes the relationship between public high school curricu-lum and financial literacy and then between financial literacy and financial behaviors through two discrete stages of examination. The first stage examines the relationship between edu-cation policy differences and the resulting assessment of financial literacy as determined by the score on a five-question survey. The second stage analyzes the impact that financial lit-eracy has on significant financial behaviors using a factor-by-factor analysis.The estimation sample includes only recent public high school graduates. The prevailing analysis suggests 1) that being financially literate pays dividends in the choices an individual makes and that 2) the provision of the financial education has minimal impact on an individual’s financial literacy. The paper concludes with a discussion of possible error points and sheds a new light on an important sub-category of labor economics, pertaining to the field of education economics. Ultimately this paper illustrates that the critical point that other factors because state requirements account for financial literacy and that financial literacy explains a decent amount of the variation in financial behavior outcomes.
Dedication and Thanks: This paper is dedicated to my mother and father. Special thanks to Professor Klara Peter and Professor William Parke for all their patience and in-valuable advice.
I
Introduction
Curriculum decisions are critical when realizing that educating the future is one the most critical parts of the economy. A well-educated work force has an immense influence on how well an economy can convert the raw materials and capital provided into salable goods and services. Providing children the right academic upbringing is essential and a well-documented need. However, equally important is the task of making sure that the future generation of authors, engineers, doctors, and lawyers can handle their own personal finances in an equally careful and informed matter. Nearly as essential to wellbeing as the ability to earn an income is the ability to budget and handle money. A viable argument could be made that knowing how to budget, plan, and execute personal financial tasks is one the most integral determinants of general wellbeing.
This paper offers some key contributions to the body of economic literature. My pri-mary contribution lies the in the data I am basing my analysis upon. No other paper has combined the National Financial Capability Study dataset and the Council on Economics Education’s Survey of the States into a single dataset. Further, few papers have used this time range and my measure of financial literacy is relatively unique. Finally, my paper uses a unique combination of financial behavior indicators; no other paper uses this particular calibration for positive and negative overall valences.
The bulk of this paper attempts to analyze the answers to two main puzzles that many other education economists have postulated answers to in perhaps other roundabout ways. The first question I am attempting to provide more light on is whether more substantive provisions of personal finance education have any significant impact on an individual’s fi-nancial intelligence. My hypothesis is that, as traditional education theory would dictate, more rigorous requirements and courses will increase scores on financial literacy exams. The second question I would like to answer is whether individuals with evidently higher objective financial literacy will exhibit more positive and fewer negative financial behaviors, ceteris paribus.By financial behaviors, I am primarily discussing the main determinants of financial literacy as determined by the Consumer Financial Protection Bureau (CFPB). The CFPB’s primary area of expertise deals with helping consumers make informed decisions about credit cards, private lending, and mortgage counseling.
I found little relationship between the level of financial education provided by each state and each region and the level of financial literacy observed on a small battery of finan-cial literacy questions. After regressing the level of finanfinan-cial literacy (or finanfinan-cial IQ) on the level of state program and a number of other control factors, like race, family income, family education, personal income, home setting, risk tolerance, marriage status, and insurance status, the coefficient for state program never reached any level of statistical significance. Furthermore, when examining the impact of financial literacy on a number of positive and negative financial behaviors, only before accounting for endogeneity and selection bias, was there even some slight causal relationship. Both of these perplexing results suggest a finding completely contrary to traditional economic theory.
finan-cial behaviors. In other cases, other economists have diligently looked at the impact of financial literacy in isolation, uninterested in the source and mechanics of the individual’s understanding. Klapperet al. (2013) and Gustmanet al. (2012) both assessed the role that an individual’s financial literacy and related, correlated measures of quantitative and verbal reasoning played. As expected, higher levels of financial abilities strongly implied a higher rate of saving, higher quality retirement planning, and sounder investing decisions.
For the first part of my model dealing the effect of a given state program on financial literacy, I use an ordinary least squares model with and without state fixed effects. In all cases, the major finding seems to be that in all three periods, at the state and regional level, the level of state program has very little impact on financial literacy. In the second part of my model dealing with with the impact of financial literacy on fiscal health, I utilized a linear probability model and a probit model to analyze 26 behaviors. Initially, my hypothesis was confirmed.
Educating the next generation is the single most important task that the generation in power has. Providing young adults with the the intellectual tools to allow them to safely and effectively accumulate capital and protect their assets should be a cornerstone of all public education programs. However, this may not the actual case. While literacy may have discernible impacts on financial behaviors, perhaps most of these behaviors are learned outside the classroom, as my research would suggest.
The structure of this paper is as follows. After establishing this paper’s place in the current context of recent literature, I then discuss the underlying theoretical model that captures the mechanisms that I believe are at work. The theoretical model then leads to the implications of the empirical model to be tested. This is done after discussing the two data sets that will be source of information that the empirical model analyzes. A brief section of analysis follows the empirical model which leads to some conclusions in the results section. The major findings of this investigation is that 1) other factors are more important financial literacy than the level of state education program and 2) financial literacy is not a great predictor of given observed financial behaviors.
II
Literature Review
Most literature on educational policy and welfare outcomes can be generally catego-rized as either education policy papers that focus on best practices for teaching students and maximizing outcome measures or economics articles that deal with examining how indi-viduals with different levels of financial literacy make decisions. Both types of papers have recently become more popular and worth examining due primarily to a major incident: the changing school curriculum. Research on the topic of financial literacy and financial edu-cation has increased given the increasing disparity in requirements of financial eduedu-cation as well as the changing utility derived from being financial literate (CEE 2015). Few papers were written on the topic before the 1980’s. Thereafter, researchers became interested in financial literacy and financial education. Researchers sought to understand the implications of curriculum changes on significant behavioral outcomes.
et al.’s paper The Impact of High School Financial Education: Evidence from a Large-Scale Evaluation employs a fairly straightforward model of dividing schools into either the treatment group (schools that introduced a financial program with follow-up) or the control (no financial program included). Similarly, other financial education papers take a meta-analysis approach like Klapper et al.’s Financial Literacy and Its Conse-quences (2013) and Gustman et al.’s Financial Knowledge and Financial Literacy at the Household Level (2012) that attempts to seek out correlations in existing survey data such as the potential relationships that can be revealed by examining the correlations between financial literacy and related behaviors. While such papers offer insight into the probable relationship that exists between financial literacy and outcomes, the suggestion of a causal relationship is less common in the literature.
For research that focuses on identifying the causal relationship between financial edu-cation requirements and wellbeing outcomes, the most-revealing strategy to date has been to employ some variation of an instrumental variable approach (Cole, Paulson, and Shastry 2014; Brown, Grigsby, van der Klaauw, and Zafar 2016) to estimate the treatment effect from changed financial education requirements. This approach provides a valuable way to gain further insight into the issue at hand by recognizing the issues with reverse causality and correlation with the error term. Cole, Paulson, and Shastry (2014) utilized a two-sample IV approach where change in the level of compulsory education is the primary instrumental variable. Brown, Grigsby, van der Klaauw, and Zafar (2016) used a similar approach the measure the impact of financial education on debt behavior with level of compulsory educa-tion again as the instrumental variable.
and 55 years olds and found that financial literacy and related cognitive abilities are posi-tively related with savings decisions and the strategic use of pension vehicles. In Financial Knowledge and Financial Literacy at the Household Level, they judged even minute gaps in understanding of numeracy could lead to significant outcome differences when ex-amining the decisions made about personal savings and use of Social Security funds. More literate or cognitively aware individuals were more likely to stick to their financial plans, allocate funds judiciously according to a budget, and retire with more than the less literate. A panel study examination by Bucks, Kennickell, and Moore (2006) discussed how financial decisions change after receiving different levels of financial education and found that in the long run, financial education accounted for a minimal amount of variance in financial deci-sions later in life; financial education, they determined, played a larger role in short term financial decisions than long term financial decisions, confirming a suspicion that knowledge degrades over time.
The economics of education contains a vast body of literature that offers a variety of insights into the nature of the connection between curricula, student performance, and behavior. However, when dealing with more specific disciplines, there are noticeably fewer papers dealing with financial education requirements as compared to mathematics and lan-guage requirements. This may be due to the obvious case that mathematics and lanlan-guage requirements are foundational; numeracy and literacy have discernible and direct conse-quences whereas proficiency in other fields may not be as vital to utility. I believe there is a small gap in the literature that aims to solve whether or not specific financial/economics education requirements have a discernible impact on wellbeing.
III
Theoretical Model
The theoretical model implemented is, for the most part, based off the base DCM developed by Professor Kenneth Train, an economist at Berkeley who wrote much of the technical details about the various key components of a discrete choice model with simula-tion (Train 2003). The basic assumpsimula-tion is that each choice agent makes a decision based on non-random and random components.
The first part of my research examines the relationship between the level of financial education provided and the amount of knowledge imparted to students. As such, the agent in this scenario is the State Department of Education (or related entity) in each of the 51 local-ities enumerated in the CEE and NFCS. This agent faces a simple choice set in binary form; the agent either 1. requires personal finance education an elemental requisite for graduation or 2. abstain from such a requirement completely and entirely (null one). In postulating this utility based framework, I naturally rely on established precepts of microeconomics whereby preferences are complete, transitive, continuous, reflexive, and strictly monotonic. One key assumption is that the agent will ostensibly reveal its preference by selecting the alternative that maximizes the agent’s utility. To be explicit, utility is the measurement of the given option’s ability to better the agent. Underlying this framework is the paramount economic assumption of complete, unbounded rationality. Another key assumption is that a random utilization model (RUM) is the underlying dynamic of policymaking.
random and non-random components. Let denote the random factors and V denote all the stated non-random factors. Together, these factors form the underlying basis of utility for each state such that
U =V + (1)
The two states of the world depend on the choice that the government administrator makes; this is either with financial literacy requirements (P) or without (F). The two possible outcomes for utility are summarized as follows.
Un,P=Vn,P +n,P (2)
In both cases, the current literature on curriculum theory more or less concludes that for any given topic of study,x, the main factors that are involved in deciding inclusion are the size of the state’s discretionary education budget, their explicit goals (what is enumerated in the state constitution or the organization’s mission statement), the size of system (usually numbers of students), priorities of taxpayers, and priorities of the students. I let non-random factor V be a factor of these and only these factors such that:
Vn,P=β1∗budget+β2∗stgoals+β3∗size+β4∗txgoals+β5∗stdgoals (3)
To be clear, stgoals means the goal differentiation for the state education administra-tors, size denotes the size the state, txgoals represents the general goals of the taxpayers and stdgoals stands for the goals of the students as espoused. For the decision-making event, RUM enters the equation such that the probability of the selection is weighted by the relative strength of those non-random and random components. One key element of discrete choice modeling is the idea that we cannot assume the random component to be small. Assuming the positive outcome, the odds of a given state (n) choosing to include financial education requirements can be stated as such:
P r(n, P) = P r(Un,P > Un,F ) (4) This can be rewritten in a more estimatable format by examining the probability of using financial literacy requirements as some type of probability distribution such as probit. This rewriting is as below:
P r(n, P) = Z
I(n,F −n,P < Vn,P−Vn,F, P 6=F∀n)d() (5) I is a given index function and f() determines the nature of the distribution function.
= (n,F )and= (n,P ) (6)
even if against the wishes of their leadership committee. As with all things nature, there is a component of randomness as well - the animal spirits of bureaucrats.
The second part of my theoretical model is nearly identical to the first in terms of structure. Another agent, at the individual level of organization, must contemplate each personal transaction. This agent (i) will be a current or recent high school graduate that is capable of or has already made several financial behaviors. The individual choice set is limited again to the simplified version of the world of only 2 options. The same rationale underlying the previous government theoretical model is again relevant here. The good behavior or utility-positive will be denotedG while the negative or utility-lowering behavior B. Again, I make the assumption of revealed preferences where agents mean what they say and say what they mean. Agents will consequently reveal preferences by selecting the alternative that maximizes his or her overall utility. A given agent will make a choice such that his or her welfare as determined by total utility will be highest under the possible states of the world:
P r(i, G) = P r(Ui,G> Ui,B) (7) I assume that the choice is such that their determinants of utils is based upon random, V, and nonrandom components, . We can rewrite each utility outcome to reflect these separate components:
Ui,G=Vi,G+i,G (8)
The same equation can be used to describe the situation for the B outcome. In this case, I assume that the main determinants of financial behaviors that are nonrandom or non-specified are current level of financial literacy, current income, and wealth (accumulated flow of earnings, this can also be considered a person’s savings). In both cases of good and bad behaviors, the following equation can summarize the components of nonrandom factors:
Vi,G/B =α+β1∗F inancialLiteracyScore+β2 ∗Y +β3
T X
t=1
Yt (9)
The Yi represents a given stream of income in a given year (it should be thought of a
flow) and therefore the coefficient, the summation on the third coefficient summation of Yt
represents wealth. As before, epsilon denotes all the random and unobserved characteristics that I believe and assume are much less significant in determination.
P r(i, G) = P r(Ui,G> Ui,B) (10) Again, this probability statement can be rewritten as an area function where I is a given index function with the deterministic distribution as the differential. I give the following treatment, as explicated in the previous section.
P r(i, G) = Z
error term follows the normal distribution. More formally,
f(i) =F(Zi) = φ(Zi) (12)
This section concludes the theoretical underpinnings and assumptions that I am basing my expectations upon.
IV
Data I: National Financial Capability Study
To gather information on financial behaviors and financial knowledge, I found FINRA’s 2015 National Financial Capability Survey. This expansive data set contains 81,219 observa-tions over three examination periods, starting in 2009. Key quesobserva-tions fall into the following categories: demographic indicators, income dynamics, saving dynamics, budgeting and plan-ning, expenditures, and financial literacy. In each response item, the respondent is typically given a number of response options that varies with the question type. For numerical out-comes, the respondent provides a range rather than exact figure.
For qualitative items, there are a mix of yes or no questions, agree/disagree continu-ums and complete the sentence passages. Another key point of the data set is that most respondents will not be eligible to answer the entire survey. There are several branch-off points within the data. For example, one part of the questionnaire is answered by only those currently serving or having served in the armed forces. Another section of the survey is designed to be answered by those who are currently retired or those who do not plan on returning to the workforce. There are also certain dependency path items. For example, item d11 asks whether or not the individual has determined his or her savings withdrawal limit. If the person responds anything other than ’yes’, the individual will not be asked items d12 through d14.
The FINRA study found respondents by using non-probability quota sampling from established online panels in each of the fifty states and the District of Columbia. After fil-tering respondents to get roughly 500 respondents in each state during each of the periods, FINRA included sampling weights to ensure that the samples accurately represented the states by surface-level diversity characteristics (age, gender, and ethnicity).
Elements of Quota Sampling, taken from explorabe.edu
• Divide population into exclusive groups (1:1 functional relationship)
• Identify the proportions of these subgroups in the population; reiterate in sampling process.
• Select subject from various subgroups, set proportions.
to those who answered affirmatively to behavioral questions eliminated another 1,762 obser-vations to arrive at the estimation sample of 8,916 obserobser-vations. I have chosen within each year the age group that would most likely be affected by changes. I decided that using actual high school students might not be the best option due to the low response rate to financial matters questions. Most individuals still in high school do not make significant financial decisions. However, recent graduates (18 to 22 year olds) are likely to be subjected to deter-mined graduation requirements as well as being more likely to be in charge of their personal financial matters. While this may seem to be a weak assumption in that college students are making many different kinds of financial decisions, it must be made given that the survey lacks the sufficient number of observations of individuals younger than 18. Fortunately, it appears that those in the estimation sample are exhibiting some key financial behaviors.
V
Data II: State of the States Survey
The first stage of my research revolves around understanding the amount of financial education that students are receiving as part of their public education. One group that pro-vides a good amount of data on current requirements is the CEE. The Council for Economic Education is an advocacy group that provides consultation services to school administrators and teachers whose goal is to help policymakers understand the current state of affairs on specific curriculum matters (CEE 2014). The CEE typically publishes their research on a two-year basis where they assess the literacy and educational climate of all United States public education programs. Part of their research documents is a fairly complete assessment of financial and economic education requirements in each of the states. Their methodology is essentially a state-by-state audit of graduation requirements and course offerings. Analysts at the CEE peruse the public documents and compile their findings in the Survey of States Report.
VI
Data III: Measurement of Essential Variables
I. Financial Literacy The focal point of paper relies heavily on the determination of financial literacy; it is the single most crucial part of my paper since both stages of the model rely on ascertaining a person’s financial knowledge. For the first stage, financial literacy is the left-hand side variable while, in the second stage, it is the most important right-hand side variable. I derived the financial literacy quotient from the responses to the five knowledge items (m6-m10) at the end of NFCS module. The coverage is highly correlated and representative of all the financial concepts a person could possibly know that matter in the realm of personal finance management. The topics covered in the five-question battery include:
• Inflation: Does the respondent understand that buying power typically varies over time?
• Simple Asset Pricing: In this case, does the respondent understand bond price - i - rate dynamics?
• Consumer Lending: Does the respondent understand basic lending terminology like amortization, interest, and principal payments?
II. Financial Behaviors There are about forty-seven different questions on a range of behaviors included in the NFCS dataset. Some of them were rather obscure and only tangentially related to personal finance while others were much more black and white in that there was not a significant amount ambiguity in responses. I restricted the indicator variables to those which I felt had a relatively clear and definable quality of positive or negative effect on a given individual’s behaviors. I break down the different indicators below.
1. Positive Indicators (binary)
• Comparison shopper: does the individual compare products before making the purchase decision?
• Adheres to a predetermined (not ex-post) budget
• Cash rich (high individual liquidity): does the individual have at least 3K in an accessible commodity?
• Full payments on credit cards
• Use of a brokerage account
• Use of savings accounts - college, retirement, slush
• Has a checking account
• Has a certificate of deposit 2. Negative Indicators (binary)
• Perceived financial hardship: does the individual feel highly at risk when it comes to financial decisions?
• Excessive debt: does the individual have a high amount of outstanding debt: from loans or credit card?
• Use of title (car or auto) loans: use of a dummy variable
• Extended periods of interest fee accumulation, capitalization of interest for 1 or more years
• Overage fee accumulation: has the individual built a large amount of over-extended credit?
• High-risk insurance: does the individual have to pay a high insurance premiums?
• Poor credit rating agency evaluation: does the individual have a sub-500 credit score?
• Transfer payment reliance: does the individual rely on SS or other government benefits program for income?
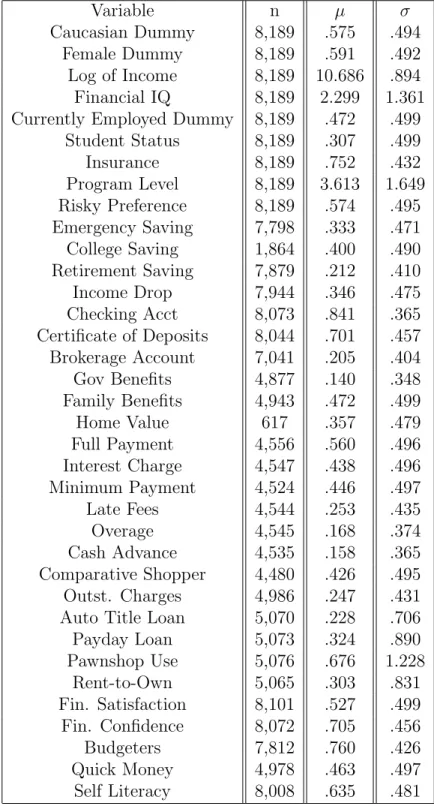
to advise the reader of this small modification of the dataset. I restricted my sample, as per my interest in the effect on recent high school graduates. Some of the key takeaways I find worth highlighting include the following. States with more and less financial education all cluster around the same average financial literacy score of a little under 2.25 questions correct. This is not very shocking. For reference, the general population was around 3.4. It is no great surprise that young adults know less, among other topics, about financial literacy than the rest of the population. Further the variance in financial behaviors is relatively low when breaking down results by level of state program and level of financial literacy. Further, the data seems to support the notion that there are relatively few differences in populations between states.
Before delving into technical econometric analysis, I decided to explore the data in a couple different way from a descriptive statistic perspective. One such analysis, predictive margins, hinted at one of the central issues of my data. I used the level of state program to try to predict the level of financial literacy of a given individual and found that the level of state program actually did quite a poor job; the confidence interval surrounding the predictor line is massive and unhelpful. In another case I looked at how given behavior varies by level of financial literacy. Again, the results showed little variance between the different levels of financial literacy which added some doubt to my methodology and research question.
Furthermore, I looked at the correlations between all the behaviors and the knowledge metrics to see whether or not I was making repetitive inquiries. A high correlation would mean that the bulk of my regression results were just repeating the same question of whether or not financial literacy mattered at all. In the sample correlation chart, which is included in the presentation graphics summary, the majority of the grid was a shade of red, orange, or yellow, indicating correlations under 0.25. The last analysis I conducted was looking at how different behaviors vary by a composite score or positive and negative behaviors. In this case, looking at an aggregate score (pscr and nscr) did in fact show variance by number of relevant behaviors. This idea gave me the confidence I needed to continue my investigation as postulated in the theoretical model.
VII
Econometric Models and Procedure
Education Policy and Literacy Outcomes
As described in the first part of my theoretical model, the first statistical model ex-amines the causal relationship between the level of personal finance education provided and resulting level of financial literacy. The model controls for all the demographic indicators provided in the actual survey; this is included in theX vector such as income, race, Currently Married Dummy, insured, student status, and employment status. Income had pretty low explanatory lower on financial IQ. Lastly I had information on individuals’ professed level of risk aversion and decided that this may have an impact on financial literacy (individuals who tolerate more risk in their risk-reward tradeoffs will be less financially literate). The model is as follows
The coefficient for the third beta denotes a control individual risk preferences while γ controls for time fixed effects. Lastly, u is the error term for the remaining unexplained variance. The goal with this equation is to see whether first beta, the coefficient for level of personal finance education, has any explanatory power for recent high school graduates’ financial literacy Y. Additionally, there is an assumption that the error term (u) is uncorre-lated with the other covariates.
Financial Literacy and Behaviors
The second part of my empirical model deals with the possible causal relationship be-tween financial literacy and observable financial behaviors. Each of the dependent variables is a given financial behavior that was asked about in the NFCS; I have simplified each of the responses down to a yes-no dichotomy (binary dependent variable) and the independent variable is a simple demographic vector. The key independent variable is financial literacy (finlitscore). The first of which is the linear probability model (LPM) This was the first model and alerted me to several econometric issues. The second related model, probit, is the more appropriate model since a lot of the behavioral questions are binary dependent variable. . The probit model, equation (14), and the linear probability model, equation (15) are shown below:
P r(Y = 1|X) =φ(β(XT)) (14)
Y =XTβ+ (15)
VIII
Results and Discussion
Education Policy and Literacy Outcomes
The first part of the results provide some reassuring evidence. In Table 3, there is an analysis of this question from the point of view that there are three types of education target policies. There are three mutually exclusive groups that a given state must be a part of: no coverage, partial/targeted coverage, or comprehensive coverage. In the first column there are all the states with the state program variable being the main independent variable. The regression is level of state program on financial literacy scores with the other specified covariates. The second column describes the results of a regression with a breakdown into targeted and comprehensive coverage. The results reinforce the efficacy of targeted cover-age. The second column regression results show that targeted coverage programs increase scores by 0.084 points which suggests that these programs are doing a decent job at pro-viding benefits for academically at-risk segments. It should be noted that the results of the second column reinforce an idea that I had not originally considered. This could imply that policymakers might be better off to avoid across-the-board education standards in favor of focused programs that teach the essentials to children who are not learning these concepts in the home. As is the case with attempts to determine causality, the omitted variable bias could be strong since the NFCS lacks all the covariates that could be helpful in explaining the impact of state education guidelines on financial literacy.
A strong argument could be made for the impact of class composition on the results. By this, it could be stipulated that those individuals who are taking a financial literacy class are in those classes for remedial education, where students are categorically deficient in this area of study. Students in these classes are likely lower-achieving students whereas the high-achievers are busy taking other courses. For the most part, college-bound, more intellectually talented students might select out of these financial literacy programs in favor of AP/IB courses. This means that the average caliber of a given student in one of these personal finance courses might reflect a non-representative sample of the entire student body. Students in these personal finance course might be lower-achieving and remedial-based. This might mean the scores are skewed and might violate the condition of homogeneity.
One curious thing to note is the fact that other controls were significant. Race (binary variable - white or other), level of income, insurance status, and employment status were all significant in each of the models which seems to confirm traditional understanding of finan-cial literacy. Those who invest in insurance, are currently employed and take home a decent wage tend to have higher levels of financial literacy. Reflecting on my original hypothesis, these results do seem to make sense. What one learns in school probably matters much less than an individual’s socioeconomic situation. Some other significant possible sources of error could include 1) migration patterns that went unaccounted, 2) battery validity: a low correlation between true financial intelligence (θ) and the five-question battery used to assess financial knowledge, or 3) the CEE’s categorization was arbitrary and made faulty assessments. All three cases seem equally likely and should be verified in future research.
Financial Literacy and Behaviors
summa-rize a great deal of information about each individual. This table examined the impact of financial literacy on the composite score of each person’s financial literacy indicators. The composite score is the sum of positive behaviors less the sum of negative financial behaviors. Both the simple and robust version of the regression suggest that there is a causal relation-ship between financial literacy score and the total financial behavior score which seems in line with my hypothesis that this would be the case even if some individual indicators are not significantly affected by financial literacy. Other papers show that financial literacy some-times trumps even the role of risk aversion and general intelligence in explaining particular financial behaviors.
Whereas the previous section documented the impact of financial literacy on an aggre-gate measure of financial health, this section will delve into the effect of financial literacy on individual behaviors. Table 5 provides an overview of the results for each of the behaviors in a compact system. The coefficient in the LPM and probit model is the value of the financial literacy coefficient from the results of Tables 6 and 7. As evidenced by the preponderance of significant coefficients, there is a causal link between an individual’s level of financial literacy. In each of these cases, as suggested by the results of Tables 6 and 7, financial literacy score is a significant explanatory factor behind one’s financial behaviors. This follows logically with what the current literature suggests. The most important implication of this finding from an over-arching, policy-fueled perspective is that financial literacy generates resiliency and can partially mitigate the impact of what are likely inevitable economic slowdowns called recessions and depressions.
Financial literacy actually does play an important role in determining financial behav-ior. Both the linear probability model and the probit model shared for around two thirds of the results the same sign and significance as traditional theory would dictate (positive behaviors would have a positive coefficient and vice versa). As evident in Tables 6 and 7 in the appendix, for a majority of the behaviors, the coefficient on the financial literacy score was significant indicating the importance of financial literacy as an explanatory factor. This seems to be in line with traditional thinking on the subject as the current literature already surmises. Most papers, as already explored in the current literature, conclude that individual financial literacy plays a large role, to a large extent, in the selection of positive and negative behaviors.
IX
Conclusion
policymakers could be wiser in choosing how to implement state education programs. To evaluate the impact of financial literacy on financial behaviors, some 26 indicators were regressed on individual financial literacy score. The second stage provided more support for the initial hypothesis that financial literacy mostly is an important factor in determining which behaviors an individual will exhibit since nearly all of the indicators had a positive and significant impact on the likelihood of having a certain behavior. These results seem promis-ing since most of the current literature seems to support my first hypothesis and my second hypothesis: more targeted financial education leads to higher literacy scores while higher financial literacy leads to healthier financial behaviors. To clarify, the predominant theme in the current literature more or less conclusively finds that higher education requirements lead to higher assessment scores and that higher financial intelligence leads to healthier financial behaviors.
[1] Bernheim, B. Douglas, Garrett, Daniel M., Maki, Dean M. Education and saving: The long-term effects of high school financial curriculum mandates. Journal of Public Eco-nomics 80, no. 3: 435-465. EconLit Accessed November 13, 2016.
[2] Bruhn, Miriam, Luciana de Souza Leao, Arianna Legovini, Rogelio Marchetti, and Bilal Zia. 2016. The Impact of High School Financial Education: Evidence from a Large-Scale Evaluation in Brazil American Economic Journal: Applied Economics 8:4 256-295. EconLit. Accessed November 5, 2016.
[3] Brown, Meta, John Grigsby, Wilbert van der Klaauw, Jaya Wen, and Basit Zafar. 2016. Financial Education and the Debt Behavior of the Young Review of Financial Studies 29:9 2490-2522. EconLit. Accessed November 5 2016.
[4] Bucks, B. K., A. B. Kennickell, and K. B. Moore. 2006. Recent changes in U.S. family finances: Evidence from the 2001 and 2004 survey of consumer finances Federal Reserve Bulletin 92:A1-38.
[5] Council of Economic Education Survey of the States. 2014. 2014 Review of Personal Ed-ucation. Retrived from http://councilforeconed.org/policy-and-advocacy/survey-of-the-states/
[6] Cole, Shawn, Anna Paulson, and Gauri Kartini Shastry. 2016. High School Curriculum and Financial Outcomes - The Impact of Mandated Personal Finance and Mathematics Courses Journal of Human Resources 51:3 656-698. EconLit. Accessed November 5, 2016. [7] FINRA Investor Education Foundation. 2015. National Financial Capa-bility Study Data file, codebook, and methodology log. Retrieved from http://www.usfinancialcapability.org/downloads.php.
[8] Fisch, Robin. Content vs. Skills: The Great Debate 2009. http://www.teachhub.com/content-v-skills-great-curriculum-debate
[11] Klapper, Leora, Lusardi, Annamaria, and Panos Georgios. Finan-cial literacy and its consequences - Evidence from Russia during the fi-nancial crisis Journal of Banking and Finance 37:10 2013. 3904-3923. http://www.sciencedirect.com/science/article/pii/S0378426613002847.
[12] Kramer, M. 1990. Curriculum reform: Rules of engagement. Change, 22(4), 54.
[13] Linder, Douglas. State v. Scopes: The Monkey Trial July 10, 2000. http://law2.umkc.edu/faculty/projects/ftrials/scopes/evolut.htm
[14] Schwartz, Shelly. US Schools Get Failing Grade for Financial Literacy Education January 28, 2016. http://www.cnbc.com/2016/01/28/us-schools-get-failing-grade-for-financial-literacy-education.html
Table 1
Independent Variable and Indicator Definitions
Financial Literacy Score Financial literacy score: number of questions answered correctly Caucasian =1 if individual is Caucasian
Currently Married =1 if currently currently Married
Female =1 if female
Currently Employed =1 if currently currently Employed Student =1 if currently full-time student
Currently Insured =1 if currently possessing health insurance Mid-Income approximate nominal annual earnings Level of Financial Education level of financial education program brokacc =1 if have a current brokerage account
budgetD =1 if individual maintained or underspent according to set budget ccdcomp =1 if compared multiple companies when looking for credit card cds =1 if have a certificate of deposit at a bank
checking =1 if have a checking account
csaving =1 if individual has an active savings account for future education
esaving =1 if have emergency funds usage
fullpmt =1 if always paid full credit card bill last year
rsaving =1 if saving for retirement
quikmonD =1 if individual can easily access 2,000 USD
atloanD =1 if individual has taken out car title loan in last year cashadv =1 if used credit card for cash advance in last year exdebtD =1 if individual perceives excessive debt pressure fbenefits =1 if received money from friends or family last year finhard =1 if difficult to cover expenses in typical month gbenefits =1 if received government transfer payments last year hmvalue =1 if owe more than current home market value incdrop =1 if had a drop in income last year
intchar =1 if paid interest on credit card last year latefee =1 if made a late payment in last year
Table 2 Summary Statistics
Variable n µ σ
Caucasian Dummy 8,189 .575 .494
Female Dummy 8,189 .591 .492
Log of Income 8,189 10.686 .894 Financial IQ 8,189 2.299 1.361 Currently Employed Dummy 8,189 .472 .499
Student Status 8,189 .307 .499
Insurance 8,189 .752 .432
Program Level 8,189 3.613 1.649 Risky Preference 8,189 .574 .495 Emergency Saving 7,798 .333 .471 College Saving 1,864 .400 .490 Retirement Saving 7,879 .212 .410
Income Drop 7,944 .346 .475
Checking Acct 8,073 .841 .365
Certificate of Deposits 8,044 .701 .457 Brokerage Account 7,041 .205 .404
Gov Benefits 4,877 .140 .348
Family Benefits 4,943 .472 .499
Home Value 617 .357 .479
Full Payment 4,556 .560 .496
Interest Charge 4,547 .438 .496 Minimum Payment 4,524 .446 .497
Late Fees 4,544 .253 .435
Overage 4,545 .168 .374
Cash Advance 4,535 .158 .365
Comparative Shopper 4,480 .426 .495 Outst. Charges 4,986 .247 .431 Auto Title Loan 5,070 .228 .706
Payday Loan 5,073 .324 .890
Pawnshop Use 5,076 .676 1.228
Rent-to-Own 5,065 .303 .831
Fin. Satisfaction 8,101 .527 .499 Fin. Confidence 8,072 .705 .456
Budgeters 7,812 .760 .426
Quick Money 4,978 .463 .497
Table 5
Summary Table of Second Stage Results
Note: Coefficient of Financial Literacy Score in Regressions Determining Financial Behavior
Financial Behavior LPM Probit Brokerage Account 0.028*** 0.100***
Budgeting 0.006 0.017
Comparative Shopper 0.017*** 0.043*** College Savings 0.000 -0.017 Full Credit Card Payments -0.006 -0.019 Fast Cash 0.035*** 0.094*** Retirement Savings 0.023*** 0.082*** Checking Account 0.033*** 0.163*** Emergency Savings 0.015*** 0.039*** Certificate of Deposit 0.035*** 0.118*** Auto-Title Loan -0.021*** -0.113***
Excessive Debt 0.013*** 0.029*** Financial Hardship -0.017*** -0.048*** Home Equity Negative -0.054 -0.120**
Rent-to-Own Goods -0.023*** -0.118*** Pawn-shop Usage -0.034*** -0.108
Payday Loan -0.025*** -0.124*** Minimum Payment -0.030*** -0.066*** Interest Charge 0.013*** 0.036***