Monitoring, Evaluation,
Accountability and Learning (MEAL)
6 Methods of data
collection and analysis
Keywords: Qualitative methods, quantitative methods,Introduction
The quality and utility of monitoring, evaluation and research in our projects and programmes fundamentally relies on our ability to collect and analyse quantitative and qualitative data. Monitoring and evaluation plans, needs assessments, baseline surveys and situational analyses are all located within a project cycle and require high-quality data to inform evidence-based decision-making and programmatic learning. To achieve this it is useful to reflect on research practices, which in a monitoring, evaluation, accountability and learning context refers to the systematic investigation of programmes. Although this session targets monitoring and evaluation specialists, it is framed by the research agenda and will build on your existing knowledge of using different data collection methods in your project work.
More specifically, we will discuss the process of identifying research questions and selecting appropriate methodologies, understanding the difference between quantitative and qualitative data, and associated benefits and limitations. We will give an overview of common methods and data analysis techniques for both quantitative and qualitative research and finally discuss the interpretation of findings using multiple data sources. The scope of this module is limited to concepts that will enable learners to gain a broad understanding of the subject area. However, we will include links to useful resources should learners wish to increase their knowledge on a particular topic.
Learning Outcomes for this Session
1 Developing research questions and linking them to study designs
We have all had questions and experienced a desire to know more about the impact and local impressions of our programmes as well as how people and culture influence our activities. This curiosity to question and learn is integral to our delivery of quality programmes. But how do we move from having an interest to knowing more about a particular area, through to developing a research question(s) and determining the right study design? The aim of this section is to guide you through the process of developing research questions, studying objectives and linking them to an appropriate study design.When you have studied this session, you should be able to:
1. Develop research questions and link them to study designs
2. Understand differences between quantitative and qualitative research and their application
3. Be familiar with different methods for collecting and analysing qualitative data
4. Be familiar with different methods for collecting quantitative data and basic concepts of probability sampling
5. Understand simple descriptive analyses for quantitative data 6. Interpret multiple sources of data and develop evidence-based
conclusions and recommendations
These learning outcomes will equip you to better understand the data collection methods and tools that are used within the overall MEAL system. For example, you will learn how to report on the mandatory global outcome indicators. Each of the mandatory global outcome indicators, as explained later in the module, have specific tools and methods for data collection – some qualitative, some quantitative.
Case study: Working Street Children in Karachi, Pakistan
Poverty is forcing more and more children to seek work on the streets of Karachi, enabling them to take an active role in sustaining themselves and their families. Whilst most children live with family or relatives, some children live on the street with no adult supervision and care.
Children are typically employed as street vendors, car washers,
shoe-shiners and as beggars and scavengers. Furthermore, large numbers of children are picked up on the street to do ad hoc domestic work, particularly girls, often performing physically-demanding tasks in situations where they face risk of abuse and exploitation behind the walls of private homes.
Regardless of the type of labour, working street children often miss out on regular schooling and on opportunities that would enable them to pursue their right to a ‘normal’ childhood and a dream to escape poverty. They are often required to engage in risky, heavy and age-inappropriate forms of labour, which, among other issues, can have serious consequences for their physical and emotional health.
In this session you will learn how to develop a ‘situation analysis’ study to understand the struggles and coping strategies of working street children in Karachi.
1.2 Developing research questions and study objectives
A key step in the planning of research is to be clear about its purpose and scope. The purpose of this study in part is to reflect gaps in existing knowledge and in part to inform future programmes. The scope of a research project is usually determined by time,
resources and staff constraints, so keep that in mind when you develop your research Picture by Olivia Arthur/Magnum Photos for Save the Children
In the process of developing a research question, you are likely to think of a number of different research questions. It is useful to continually evaluate these questions, as this will help you refine and decide on your final research question. You could, for example, ask:
• Is there a good fit between the study purpose and the research question? • Is the research question focused, clear and well-articulated?
• Can the research question be answered? Is it feasible – given time, resource and staff constraints?
Activity 1 (SAQ)
Here are examples of research questions relating to the case study. Which research question do you think is the most appropriate?
1. What is life like for working street children?
2. What are the struggles and coping strategies of working street children in Karachi, and what are the implications of these observations to development programmes?
3. How can Save the Children best support working street children in Karachi? The answer can be found at the end of this session.
To further help you define your investigation it is useful to develop a few study
objectives. These objectives should be specific statements that reflect the steps you will take to answer your research question. For the above case study, I would include the following objectives:
• Map out the struggles and coping strategies of working street children in Karachi • Determine how socio-economic status impacts on children’s struggles and coping
strategies
• Identify differences between boys and girls as well as the cause of these differences • Discuss the implications of these findings to development programmes.
By addressing these four study objectives, you will automatically begin to ‘paint a picture’ that answers your overarching research question.
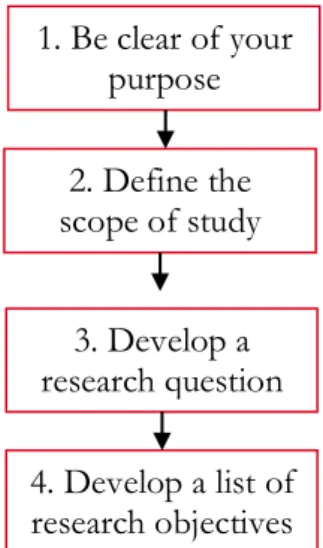
Figure 1 summarises key steps for you to establish a study focus.
Figure 1: ‘Steps’ to establish a study focus
1.3 Deciding on a study design
Once you are happy with your research question and study objectives you can begin to determine which study design is most appropriate to answer your question. There are many different kinds of study designs for monitoring, evaluation and research. They can either be exploratory and observational, meaning they try to explore and observe what is happening in a given context, or they can be experimental, which means they are aiming to test the impact of an intervention.
1. Be clear of your purpose 2. Define the scope of study 3. Develop a research question 4. Develop a list of research objectives
Activity 2 (SAQ)
Let’s say we are going to use the second research question: What are the struggles and coping strategies of working street children in Karachi, and what are the implications of these observations to development programmes?
To answer this question, do you need to develop a study design that is exploratory or experimental?
To help you answer this question, you can consider the following questions: • Do you need to develop an experiment and test different possibilities? Or is
your study more about exploring and developing an impression about local experiences?
• Will you need to compare and contrast populations with different outcomes? Will you need to follow a group of participants over a period of time (i.e. follow a cohort)? Or will you be exploring their perspectives at a specific point in time?
The answer can be found at the end of this session.
As your study seeks to describe some features (struggles and coping strategies) of a group of working street children at one specific point in time, you are in the process of
developing an exploratory study. Exploratory studies are useful for conducting situation analyses and benefit from drawing on both qualitative and quantitative methods. If you were developing a study to assess the impact of an intervention supporting working street children in Karachi, you would likely benefit from developing a study with a more
experimental design with a before and after intervention focus. For more detail on experimental evaluation designs, please consult Session 7.
1.4 Promoting ethical and participatory research
After having determined the design of your study, it is time to think about how you might best engage with the respondents of the study, many of whom will be children. You will, for example, need to consider the following questions:
What might be the social and ethical implications of the respondent’s engagement with you and the study? How can you best protect and safeguard their well-being and interests? What are ethical and safe ways to involve children in research?
These questions are important to consider and resonate with Save the Children’s child safeguarding policy. Broadly said, ethical research is about ‘doing good and avoiding harm’ to those participating in the research. This is achieved primarily by consulting communities of your areas of study and attaining answers and practical responses to the above questions. Make sure you follow up on their recommendations. You also need to familiarise yourself with existing toolkits and universal guidelines for conducting ethical research (see resources below) and use this information to develop informed consent forms, which include:
i. An information sheet in the local language, explaining: who you and Save the Children are, including your contact details; the purpose of the interview or exercise; whether they have to take part; what will happen if they do not want to participate; what will happen if they agree to participate; how long it will take; how confidentiality will be assured; what they will get out of it; risks associated with their participation; approximate data of completion and anticipation how the information gathered will be used. If you will be involving non-literate groups you need to think about how to communicate this information to them, for example in a group discussion and/ or with visual materials.
ii. A consent form that includes statements that the participant has understood what they will be involved in (e.g.,’ I understand that if I decide at any time that I don’t want to participate in this study, I can tell the researchers and will be withdrawn from it immediately. This will not affect me in any way’. Or, to take another instance: ‘I understand that reports from the findings of this study, using information from all participants combined together, will be published.
Confidentiality and anonymity will be maintained and it will not be possible to identify me from any publications’.
You need to prepare separate information consent forms for both children and adults. If children under the age of 18 are participating in your study, you also need to obtain informed consent from their guardians. Different data collection methods require different informed consent forms. So it is important you tailor your information sheets and consent forms to your specific study. More and more organisations, including Save the Children UK, are setting up internal ethics committees in place to support and guide staff to conduct ethical research. At the end of this session we have included some resources providing you with additional information.
How can you promote children’s participation in a study?
As Session 8 Children’s participation in MEAL demonstrates, Save the Children has a longstanding history of recognising children as social actors with a unique perspective and insight into their own reality. This recognition is borne out of an acknowledgement of the benefits of involving community members and children in research processes. In the spirit of promoting children’s participation, researchers can explore ways to use methods that bring forward children’s voices as well as identifying ways in which children can act as co-researchers (see resources below). This may include using drawings or disposable cameras (click
http://resourcecentre.savethechildren.se/sites/default/files/documents/3738.pdf for an example) or participatory action and learning tools (click
http://www.aidsalliance.org/includes/Publication/Tools_Together_Now_2009.pdf for an example) to promote children’s participation.
1.5 Differences between quantitative and qualitative research and their application
Research is a systematic investigation that aims to generate knowledge about a particular phenomenon. However, the nature of this knowledge varies and reflects your study objectives. Some study objectives seek to make standardised and systematic comparisons, others seek to study a phenomenon or situation in detail. These different intentions require different approaches and methods, which are typically categorised as either quantitative or qualitative. You have probably already made decisions about using qualitative or quantitative data for monitoring and evaluation. Perhaps you have had to choose between using a questionnaire or conducting a focus group discussion in order to gather data for a particular indicator.
1.6 Quantitative research
Quantitative research typically explores specific and clearly defined questions that
examine the relationship between two events, or occurrences, where the second event is a consequence of the first event. Such a question might be: ‘what impact did the
programme have on children’s school performance?’ To test the causality or link between the programme and children’s school performance, quantitative researchers will seek to maintain a level of control of the different variables that may influence the relationship between events and recruit respondents randomly. Quantitative data is often gathered through surveys and questionnaires that are carefully developed and structured to provide you with numerical data that can be explored statistically and yield a result that can be generalised to some larger population.
1.7 Qualitative research
Research following a qualitative approach is exploratory and seeks to explain ‘how’ and ‘why’ a particular phenomenon, or programme, operates as it does in a particular context. As such, qualitative research often investigates i) local knowledge and understanding of a given issue or programme; ii) people’s experiences, meanings and relationships and iii) social processes and contextual factors (e.g., social norms and cultural practices) that marginalise a group of people or impact a programme. Qualitative data is non-numerical, covering images, videos, text and people’s written or spoken words. Qualitative data is often gathered through individual interviews and focus group discussions using semi-structured or unsemi-structured topic guides.
1.8 Summary of differences
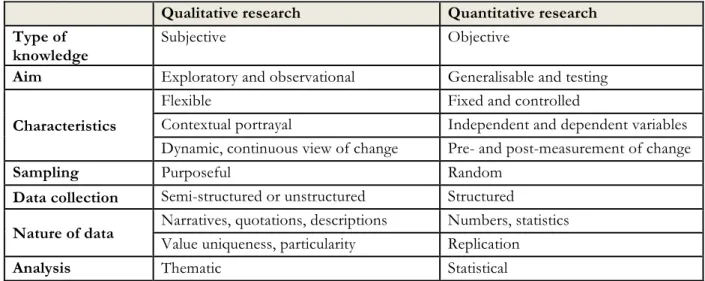
Table 1: Key differences between qualitative and quantitative research
Although the table above illustrates qualitative and quantitative research as distinct and opposite, in practice they are often combined or draw on elements from each other. For example, quantitative surveys can include open ended questions. Similarly, qualitative responses can be quantified. Qualitative and quantitative methods can also support each other, both through a triangulation of findings and by building on each other (e.g., findings from a qualitative study can be used to guide the questions in a survey).
Qualitative research Quantitative research Type of
knowledge
Subjective Objective
Aim Exploratory and observational Generalisable and testing
Characteristics
Flexible Fixed and controlled
Contextual portrayal Independent and dependent variables Dynamic, continuous view of change Pre- and post-measurement of change
Sampling Purposeful Random
Data collection Semi-structured or unstructured Structured
Nature of data Narratives, quotations, descriptions Numbers, statistics
Value uniqueness, particularity Replication
2 Methods for collecting and analysing qualitative data
This section starts off by introducing you to four commonly used qualitative data
collection methods. These collection methods and many others are also described in the Save the Children Evaluation Handbook, which also explain how to use them in
evaluation. It then explains how you may go about involving participants: this is also known as sampling. The section ends with a discussion of a couple of approaches to qualitative data analysis. You may have used some of these methods as part of your routine project monitoring activities, in a needs assessment or baseline or as part of an evaluation exercise.
2.1 Individual interview
An individual interview is a conversation between two people that has a structure and a purpose. It is designed to elicit the interviewee’s knowledge or perspective on a topic. Individual interviews, which can include key informant interviews, are useful for exploring an individual’s beliefs, values, understandings, feelings, experiences and perspectives of an issue. Individual interviews also allow the researcher to ask into a complex issue, learning more about the contextual factors that govern individual experiences.
2.2 Focus group discussions
A focus group discussion is an organised discussion between 6 to 8 people. Focus group discussions provide participants with a space to discuss a particular topic, in a context where people are allowed to agree or disagree with each other. Focus group discussions allow you to explore how a group thinks about an issue, the range of opinions and ideas, and the inconsistencies and variations that exist in a particular community in terms of beliefs and their experiences and practices. You should therefore purposefully (the adjective is ‘purposive’) recruit participants for whom the issue is relevant. Be clear about the benefits and limitations of recruiting participants that represent either one population (e.g. school going girls) or a mix (e.g. school going boys and girls), and whether or not they know each other.
2.3 Photovoice
Photovoice is a participatory method that enables people to identify, represent and enhance their community, life circumstances or engagement with a programme through photography and accompanying written captions. Photovoice involves giving a group of participant’s cameras, enabling them to capture, discuss and share stories they find
2.4 Picture story
The picture story method enables children, in a fun and participatory way, to
communicate their perspectives on particular issues through a series of drawings (story telling) they have made. The story telling can either be done in writing, depending on the child’s level of literacy, or verbally with a researcher. The picture story method is relatively quick and inexpensive, particularly if the draw-and-write technique is adopted. The
picture story method provides a non-threatening way to explore children’s views on a particular issue (e.g. barriers to girl’s education) and to begin to identify what can be done to address any struggles faced by children.
2.5 Identifying participants
Qualitative research often focuses on a limited number of respondents who have been purposefully selected to participate because you believe they have in-depth knowledge of an issue you know little about, such as:
• They have experienced first-hand you topic of study, e.g. working street children • They show variation in how they respond to hardship, e.g. children who draw on
different protective mechanisms to cope with hardship on the street and in the work place
• They have particular knowledge or expertise regarding the group under study, e.g. social workers supporting working street children.
You can select a sample of individuals with a particular ‘purpose’ in mind in different ways, including:
• Extreme or typical case sampling – learning from unusual or typical cases, e.g. children who expectedly struggle with hardship (typical) or those who do well despite extreme hardship (unusual)
• Snowball sampling – asking others to identify people who will interview well, because they are open and because they have an in-depth understanding about the issue under study. For example, you may ask street children to identify other street children you can talk to.
• Random purposeful sampling – if your purposeful sample size is large you can randomly recruit respondents from it.
Activity 3 (SAQ)
Imagine that you have arrived in Karachi to conduct the study detailed in the case study on working street children (see above). A local social worker introduces you to two former street working children and you learn that they still have lots of friends still working on the street. As a way to identify participants for your study, you ask the two former street working children if they can recommend and invite some of their friends on the street to participate in the study. You also ask them to spread word of the study in anticipation that their friends will also help you to identify potential participants. How would classify this kind of sampling?
1. Extreme or typical case sampling? 2. Snowball sampling?
3. Random purposeful sampling?
The correct answer can be found at the end of this session.
3 Qualitative data analysis
Qualitative data analysis is a process that seeks to reduce and make sense of vast amounts of information, often from different sources, so that impressions that shed light on a research question can emerge. It is a process where you take descriptive information and offer an explanation or interpretation. The information can consist of interview
transcripts, documents, blogs, surveys, pictures, videos etc. You may have been in the situation where you have carried out 6 focus group discussions but then are not quite sure what to do with the 30 pages of notes you collected during the process. Do you just highlight what seems most relevant or is there a more systematic way of analysing it? Qualitative data analysis typically revolves around the impressions and interpretations of key researchers. However, through facilitation, study participants can also take an active role in identifying key themes emerging from the data. Because qualitative analysis relies on researchers’ impressions, it is vital that qualitative analysis is systematic and that researchers report on their impression in a structured and transparent form. This is particularly important considering the common perception that qualitative research is not as reliable and sound as quantitative research.
Qualitative data analysis ought to pay attention to the ‘spoken word’, context, consistency and contradictions of views, frequency and intensity of comments, their specificity as well
3.1 The process of reducing your data
There are two ways of analysing qualitative data. One approach is to examine your
findings with a pre-defined framework, which reflects your aims, objectives and interests. This approach is relatively easy and is closely aligned with policy and programmatic research which has pre-determined interests. This approach allows you to focus on
particular answers and abandon the rest. We refer to this approach as ‘framework analysis’ (Pope et al 2000). The second approach takes a more exploratory perspective,
encouraging you to consider and code all your data, allowing for new impressions to shape your interpretation in different and unexpected directions. We refer to this approach as thematic network analysis (Attride-Stirling, 2001). More often than not, qualitative analysis draws on a mix of both approaches.
Whichever approach guides you, the first thing you need to do is to familiarise yourself with your data. This involves reading and re-reading your material (data) in its entirety. Makes notes of thoughts that spring to mind and write summaries of each transcript or piece of data that you will analyse. As your aim is to condense all of this information to key themes and topics that can shed light on your research question, you need to start coding the material. A code is a word or a short phrase that descriptively captures the essence of elements of your material (e.g. a quotation) and is the first step in your data reduction and interpretation.
To help speed up your coding you can, after having read through all of your data, develop a coding framework, which consists of a list of codes that you anticipate will be used to index and divide your material into descriptive topics. If you are approaching your data following the deductive framework approach, your coding will be guided by a fixed framework (and you index your material according to these pre-defined codes). If,
however, you are following the more inductive thematic network approach, you are likely to add new codes to your list as you progress with the coding, continually developing your coding framework. Coding is a long, slow and repetitive process, and you are
encouraged to merge, split up or rename codes as you progress. There is no fixed rule on how many codes you should aim for, but if you have more than 100-120 codes, it is advisable that you begin to merge some of your codes.
Once you have coded all of your material you need to start abstracting themes from the codes. Go through your codes and group them together to represent common, salient and significant themes. A useful way of doing this is to write your code headings on small pieces of paper and spread them out on a table: this process will give you an overview of the various codes and will also allow you to move them around and cluster them together into themes. Look for underlying patterns and structures – including differences between types of respondents (e.g., adults versus children, men versus women) if analysed
together. Label these clusters of codes (and perhaps even single codes), with a more interpretative and ‘basic theme’. Take a new piece of paper, write the ‘basic theme’ label, and place it next to your cluster of codes. If, for example, the codes ‘Torn uniform’ and ‘No school books’ appear in your interview transcripts with working street children, they can be clustered together as ‘Working street children lack school materials’ (see Figure 3).
You may find that not all of your codes are of interest and relevance to your research question and that you choose to only cluster 60 of your codes into ‘basic themes’ that help shed light on your question. Let us say, for arguments sake, that through this process you identify 20 ‘basic themes’. Repeat this process with your basic themes. Examine your ‘basic themes’ and cluster them together into higher order and more interpretative
‘organising themes’. Let us say, again for arguments sake, that this process reduces your 20 ‘basic themes’ to four ‘organising themes’, two of which represent struggles faced by working street children (as exemplified by Figure 4) and two which give detail to their coping strategies. Figure 4 also illustrates how you can transparently show how you went from having descriptive codes to focusing on a few distinct, interpretative and networked themes that you can use to begin answering parts of your research question.
4 Quantitative data and methods
Quantitative data is numerical and can be collected in a number of forms. The most common forms of quantitative data used in Save the Children are shown below.
• Units: number of staff that have been trained; number of children enrolled in school for the first time
• Prices: amount of money spent on a building, or the additional revenue of farmers following a seed distribution programme
• Proportions/percentages: proportion of the community that has access to a service
• Rates of change: percentage change in average household income over a reporting period
• Ratios: ratio of midwives or traditional birth attendants to families in a region • Scoring and ranking: scores given out of ten by project participants to rate the
quality of service they have received.
Statistical analysis is used to summarise and describe quantitative data and graphs or tables can be used to visualise present raw data. This section will review the commonly used methods/sources of quantitative data and the techniques used for recruiting participants.
4.1 Quantitative methods
Quantitative data can be collected using a number of different methods and from a variety of sources.
1. Surveys and questionnaires use carefully constructed questions, often ranking or scoring options or using closed-ended questions. A closed-ended question limits respondents to a specified number of answers. For example, this is the case in multiple-choice questions. Good quality design is particularly important for quantitative surveys and questionnaires.
2. Biophysical measurements can include height and weight of a child
3. Project records are a useful source of data. For example, the number of training events held and the number of participants attending
4.2 Sampling for quantitative methods
Commonly in our research or programmatic data collection, it is not possible or even desirable, to collect data from a whole target group or population. This could be
extremely difficult and expensive. Through accurate sampling of a subset of the population we can reduce costs and gain a good representation from which we can infer or generalise about the total population.
Accurate sampling requires a sample frame or list of all the units in our target population. A unit is the individual, household or school (for example) from which we are interested in collecting data. A sample frame for a household survey would include all the households in the population identified by location or, in the case of our case study, all of the working street children in Karachi.
4.3 Bias
The process of recruiting participants for quantitative research is quite different from that of qualitative research. In order to ensure that our sample accurately represents the
population and enables us to make generalisations from our sample we must fulfil a number of requirements.
Sampling bias can occur if decisions are made about sample selection that mean that some individuals have a greater chance of being selected for the sample than others. Sample bias is a major failing in our research design and can lead to inconclusive, unreliable results. There are a many different types of bias. For example, tarmac bias relates to our tendency to survey those villages that are easily accessible by road. We may be limited in our ability to travel to many places due to lack of roads, weather conditions etc. which can create a bias in our sample.
Self-selection or non-response bias is one of the most common forms of bias and is difficult to manage. Participation in questionnaire/surveys must be on a voluntary basis. If only those people with strong views about the topic being researched volunteer then the results of the study may not reflect the opinions of the wider population creating a bias.
Activity 4 (SAQ)
From the three examples below, select which sample selection is not biased.
A. A government official with good knowledge of the area identifies schools to be included in the sample
B. You wait at the market on a Monday morning and interview every third person that comes through the gates
C. From an accurate list of children enrolled in a school you pick children’s names out of a hat.
The answer can be found at the back of the session.
4.4 Simple random sampling
A simple random sample is the simplest way to select participants from a population. Pulling names out of a hat or using an online random number generator such as
www.random.org can create a random sample. Using these methods means that each individual in the population has the same chance of being selected for the sample.
4.5 How many? Sample size calculation
Calculating the most appropriate sample size is an important step in the research process. A larger sample provides a more precise estimate of the ‘real’ situation but the benefits of increased sample size get smaller as you near the total population. Therefore, there is a trade-off between sample precision and considerations of optimal resource use.
There are no ‘rules of thumb’ when determining sample size for quantitative research. It is not possible to say whether 10% of the population, for instance, would provide an adequate sample, as this will be affected by a number of factors. You should be wary of sample plans in research or evaluations that suggest sample size can be calculated using a percentage of the population without further clarification or rationale for this.
Statisticians will calculate sample size using a range of different equations, each of which are appropriate for different research situations and contexts. It is important to discuss the objectives of your research, expected results, data types, resources and context with a statistician or technical advisor at the design stage of your research in order to calculate an appropriate sample.
The confidence interval is the acceptable range in which your estimate can lie. For example, if you were using a sample to collect data estimating the percentage of street children in Karachi who are engaged in harmful work you might set your margin of error at 10%. This would mean that if, following the collection of your data you found that 75% of children in your sample are engaged in harmful work, you would know that the real number for the population would be plus or minus 10% i.e. anywhere between 65% and 85%.
If you are carrying out before and after intervention analysis to determine whether your work has contributed to a change you will need to consider what size of effect you anticipate occurring before you calculate your sample size. For example, if you are carrying out a project which expects to reduce the number of children working on the street from 75% to 70% you would not want to use a confidence interval of 10% as your estimate would not be precise enough to detect this change.
The level of confidence determines how sure you want to be that actual percentage (of children engaged in harmful work for example) falls within your selected confidence interval. As we are using a sample and not asking every single child individually we are always making an estimate of the real value and we can never be 100% confident. A level of confidence of 95% is commonly used, which means that there is a 5% chance that the actual percentage will not lie between the confidence interval selected.
When deciding on what confidence interval to use in your sample size calculation it is important to remember that whilst a larger range gives you a smaller sample size, a smaller range gives you greater precision in your results. Selecting a lower level of confidence will also give a smaller sample size but also decrease the reliability of the data. Unfortunately there is no simple answer and you need to review the values used on a case-by-case basis. Remember, however, that if the sample is too small then this will lead to inconclusive results, which cannot provide us with the information that we need. If the sample is too large, however, it may be impossible to collect and resources will be wasted.
4.6 Sampling methods
Stratified sampling: Stratified sampling is used when individuals in a population can be split into distinct, non-overlapping groups. These groups are called ‘strata’. Common strata are village, district, urban/rural etc.
5 Quantitative analysis
The methods we have described above help us to collect quantitative data, but is the collection of data our end goal?
No, of course not! A large set of data sitting in a spreadsheet does not help us to understand the characteristics of the population we are working with or describe the changes brought about by our projects. We need to use the data to create information. In our case study example, we may have interviewed children working on the street in Karachi and collected all the data together in a spreadsheet; however, we need to analyse and summarise the data to answer our research questions. We need to understand what percentage of children are involved in different work types. For instance, we may want to understand if girls and boys carry out similar tasks or are exposed to similar risks.
Statistics help us turn quantitative data into useful information to help with decision-making. We can use statistics to summarise our data, describing patterns, relationships and connections. Statistics can be descriptive or inferential. Descriptive statistics help us to summarise our data whereas inferential statistics are used to identify statistically significant differences between groups of data (such as intervention and control groups in a
randomised control study). During this module our focus will be on descriptive rather than inferential statistics: this will also help to give a short introduction to the most common descriptive statistics.
5.1 Data structure
We generally collect data from a number of individuals or ‘units’. These units are most often the children or adults that we are working with. However, our units could also be hospitals or schools, for example. The different measurements, questions or pieces of information that we collect from these individuals are the variables.
5.2 Variables
There are two types of variables, numerical and categorical. It is important to distinguish between these two types of variables, as the analysis that you do for each type is slightly different.
Categorical variables are made up of a group of categories. Sex (male/female) is a categorical variable, as is quality of training (good; bad; average).
Numerical variables are numbers. They can be counts (e.g. number of participants at a training) or measures (e.g. height of a child) or durations (e.g., age, time spent)
This information is presented using a frequency table. The frequency table shows us how many participants fall into each category. We can also then represent this as a percentage or proportion of the total. Figure 5 shows an example frequency table for the different types of work carried out by children working on the street in Karachi.
Type of work Number of children
Street vendor 87 Car washing 92 Shoe-shiner 67 Scavenging 98 Begging 110 Domestic work 45 Other 28 TOTAL 527
Figure 5. Type of work for street children in Karachi
Frequency tables can be used to present findings in a report or can be converted into a graph for a more visual presentation.
A proportion describes the relative frequency of each category and is calculated by dividing each frequency by the total number.
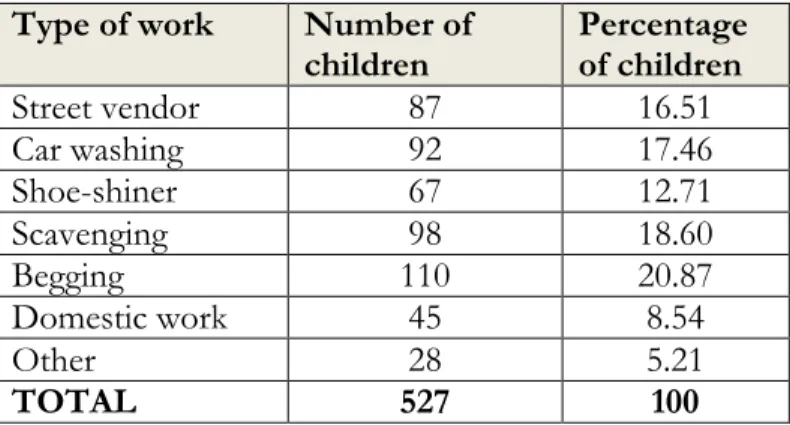
Percentages are calculated by multiplying the proportion by 100. Proportions and percentages can be easier to understand and interpret than examining raw frequency data and are often added into a frequency table (see figure 6).
Figure 6. Types of work for street children in Karachi Type of work Number of
children Percentage of children
Street vendor 87 16.51 Car washing 92 17.46 Shoe-shiner 67 12.71 Scavenging 98 18.60 Begging 110 20.87 Domestic work 45 8.54 Other 28 5.21 TOTAL 527 100
5.4 Analysis of numerical variables
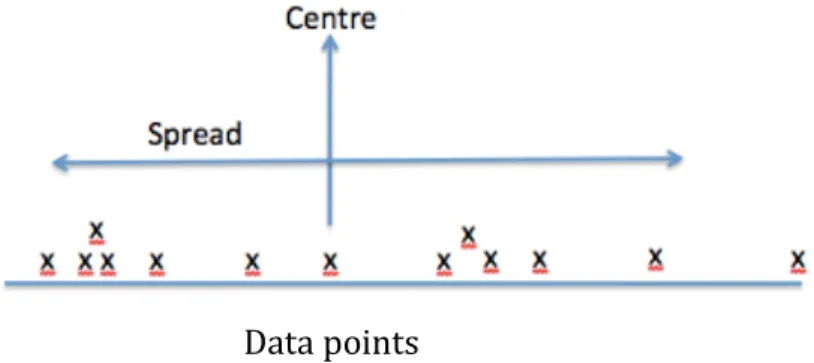
Two statistics – the centre and the spread – commonly describe numerical data. The centre describes a typical value and the spread describes distance of data from the centre.
Figure 7 Diagram showing centre and spread for a set of data points
The most common statistics used to describe the centre are the mean (commonly known as the average) and the median. The median is the middle value in a data set, half the data are greater than the median and half are less. The mean is calculated by adding up all the values and then dividing by the total number of values.
Using our case study example – if you were to interview 23 street children and record their age you might get a set of data as below. Each number is the age of an individual child and the ages have been arranged in order.
3 3 4 4 5 7 7 8 9 10 10 11 12 12 12 13 13 14 14 15 15 15 16
Figure 8 Mean and median age of children
The mean and the median would be different for this dataset. To calculate the median you need to arrange the children in order of age and then find the mid-way point. In this example, 11 children are below the age of 11 and 11 children are above the age of 11. To calculate the mean you need to add up all the ages and then divide by the number of
Data points
Median = 11 Mean = 10.08
Spread is most easily described using the range of the data. This is the difference between the minimum and maximum. The range of the example data above would be 13 years (minimum = 3, maximum = 16).
Other statistics describing spread are the interquartile range and standard deviation. The interquartile range is the difference between the upper quartile and lower quartile. A quarter (or 25%) of the data lie above the upper quartile and a quarter of the data lie below the lower quartile.
The standard deviation shows the average difference between each individual data point (or age of child in our example) and the mean age. If all data points are close to the mean then the standard deviation is low, showing that there is little difference between values. A large standard deviation shows that there is a larger spread of data. Calculating the standard deviation yourself is a little complex but this can also be done easily in Microsoft Excel (see Computer Assisted Statistics Textbook for details on how to calculate standard deviation).
Activity 5 (SAQ)
Examine the frequency table and answer the following true/false and multiple-choice questions
Age Group Frequency Proportion
0-5 years 56 0.24
6-10 years 93 0.39
10 + years 87
TOTAL 236
Figure 9. Frequency table showing the ages of children working on the street in Karachi 1. Age group is a numerical variable
2. Which value is the proportion of 10+ year old children in the sample A. 0.4
B. 37 C. 0.37
6 Discussing results and drawing conclusions
The final stage of the research process is to interpret the findings, making conclusions and recommendations. When drawing conclusions you should review and summarise your findings looking for explanatory patterns or relationships that help answer your research questions.
Questions to consider when interpreting your findings:
• Did the research methodology and data collected answer the research question? Do the findings support our hypotheses (quantitative)?
• How do the different findings interact? Do they explain each other or are there contradictions?
• Can we triangulate the data from a number of different sources (different stakeholders, different methodologies, external sources of information)? • What were the limitations of the study and how do they affect the results? • Are there any areas that require further research or follow up?
6.1 Mixed methods and triangulation
If you have collected both quantitative and qualitative data you should compare and contrast these findings when interpreting your work. The integration of quantitative and qualitative research can give us a broader understanding of our research subject. Quantitative research can describe
magnitude and distribution of change, for instance, whereas qualitative research gives an in-depth understanding of the social, political and cultural context. Mixed methods research allows us to triangulate findings, which can strengthen validity and increase the utility of our work.
You should also reflect on your findings in comparison to other research or evaluation work in the area and consider whether findings were similar.
6.2 Limitations
Triangulation is when we compare a number of different data sources and methods to confirm our findings. For example, we could compare the perspectives of teachers,
students and parents on the quality of schooling.
Triangulation can bring strength to our conclusions or identify areas for further work.
It is also important that conclusions and recommendations are based on the data
collected rather than personal opinions. When reporting quantitative or qualitative data, you can only make valid conclusions on the topics researched and for which you have supporting evidence.
6.3 Displaying and reporting on your qualitative and quantitative data
Any research report must be guided by the transparency of the process through which conclusions have been drawn. A report must therefore include:
• An ‘Introduction’ that argues for the importance of exploring a particular research question, highlighting the gaps in, and limitations of, existing evidence. • A ‘Methodology’ section that justifies your sampling strategy and the research
methods to be used to answer your research question: this gives detail to the process through which data was collected and analysed.
• A ‘Findings’ section that presents key findings emerging from the analysis that answers the research question. If, for example, your qualitative data analysis generated two ‘global themes’, they could each represent a findings chapter, with ‘organising themes’ representing sub-headings, under which the ‘basic themes’ are discussed and supported by plenty of quotations, which are extracted from your codes. For quantitative data you may present frequency tables or graphs of
variables of interest. When presenting qualitative findings, it is important that you do not only discuss and present a single and dominant view, but also acknowledge contradictions and disagreements within the data. Please note that when
presenting qualitative data, you cannot claim causality and association. You are presenting people’s perceptions and experiences of a phenomenon. As such, you have to be careful about how you present a finding. You can for example say ‘some respondents felt …’, ‘a common opinion was …’, ‘The perception of some adults was …’, ‘this suggests a possible relationship between …’ and so forth. A ‘Discussion’ section that highlights how the findings emerging from the study either corroborate, contradict or build on existing evidence as well as giving detail to the limitations of the study.
Summary of this Session
This session has taken you through the process of identifying research questions and selecting appropriate methodologies. You now hopefully have a better understanding of the difference between quantitative and qualitative data collection methods and associated benefits and limitations. We also introduced you to some common methods and
techniques of data analysis for both quantitative and qualitative research.
We hope you found this session useful and will draw on it to develop systematic
investigations that can be used to improve the quality, impact and accountability of our programmes. Best of luck!
Useful resources
Ethical research with children
UNICEFs Technical note on Ethical Research with Children [http://www.unicef.org/evaluation/files/TechNote1_Ethics.pdf]
The Ethics of Social Research with Children and Families in Young Lives: Practical Experiences
[http://resourcecentre.savethechildren.se/sites/default/files/documents/6312.pdf] Ethical Principles, Dilemmas and Risks in Collecting Data on Violence against Children. A review of available literature
[http://resourcecentre.savethechildren.se/sites/default/files/documents/6777.pdf]
Children’s participation in research guides:
Children in focus: A manual for participatory research with children
[http://resourcecentre.savethechildren.se/sites/default/files/documents/5412.pdf] So you want to involve children in research? A toolkit supporting children's meaningful and ethical participation in research relating to violence against children
[http://resourcecentre.savethechildren.se/sites/default/files/documents/2437.pdf] Guide on Participatory Monitoring and Evaluation Methodologies for Working with Children and Youth
Quantitative Data Analysis
Computer Assisted Statistics Textbooks (CAST) [http://cast.massey.ac.nz/collection_public.html]
Statistical Services Centre, University of Reading (2006) Writing up research, a statistical perspective.
[http://www.reading.ac.uk/ssc/n/resources/Docs/Writing up research - a statistical perspective.pdf]
Sampling
Statistical Services Centre, University of Reading ‘Some basic ideas of sampling’ (2000) [http://www.reading.ac.uk/ssc/n/resources/Docs/Some_Basic_Ideas_of_Sampling.pdf] Wilson, I. Some practical sampling procedures for development research.
[http://www.reading.ac.uk/ssc/n/resources/Docs/Some_practical_sampling_procedure s.pdf]
References
Attride-Stirling J. (2001). ‘Thematic networks: an analytic tool for qualitative research’. Qualitative Research, vol. 1, no. 3: pp. 385–405 [Online]. Available at
http://goo.gl/VpQeQJ (retrieved on 2 January 2014).
Pope, C., Ziebland, S., and Mays, N. (2000). ‘Analysing qualitative data’. British Medical Journal, 320 : pp. 114–116 [Online]. Available at
http://www.ncbi.nlm.nih.gov/pmc/articles/PMC1117368/pdf/114.pdf (retrieved on 2 January 2014).
Self-Assessment Questions (SAQ) answers
Activity 1
The second question is probably the most appropriate research question. It is clear, focused and gives an indication of what the study sets out to do. The first question is too simple and can incorporate anything. The third question is unclear. It does not give any indication of what you will be studying and assumes children need support.
Activity 2
To answer your research question, you will need to develop an exploratory study design.
Activity 3
The answer is: 2. Snowball sampling
You may think that in qualitative research, any sampling technique is acceptable. In a way it is, as long as your sampling technique reflects your research question and that you declare what sampling technique you adopted.
Activity 4
The correct answer is C. This is why:
• Answer A: In this answer we do not know what criteria the government official is using to select the schools for the sample. S/he may be selecting the
well-organised schools to reflect positively on the government or in fact selecting poorly run schools to bring more money into the area. The decision to include the schools is subjective rather than objective.
• Answer B: You are not giving all members of the population an equal chance to be selected for the sample. Perhaps some people arrive late to the market or visit on a different day.
• Answer C: This method should give a random sample, as long as the list of children is accurate.
Activity 5
Glossary items
Research – To study (something) systematically, gathering and reporting on detailed and accurate information.
Randomisation – A method based on chance alone, by which study participants are assigned to a study.
Sampling – A process through which study participants, or locations, are recruited to take part in a study.
Triangulation – Is when we compare a number of different data sources and methods to confirm our findings. For example, we could compare the perspectives of teachers,
students and parents on the quality of schooling. Triangulation can bring strength to our conclusions or identify areas for further work.
Findings – Summaries, impressions or conclusions reached after an examination or investigation of data.
Bias – A tendency to yield one outcome more frequently than others, often as a result of having or showing an unfair tendency to select some people or locations over others. Infer – Deduce or conclude (information) from evidence and reasoning rather than from explicit statements.
Generalise – The ability to make statements and draw conclusions that can have a general application.