ISSN: 2147-611X
www.ijemst.com
An Investigation of Students’ Attitudes to
Science, Mathematics and the Use of
Technology
in
Lower
Secondary
Education
Niamh Burke O’Connell, Majella Dempsey, Ann O’Shea Maynooth University, Ireland
To cite this article:
Burke O‟Connell, N., Dempsey, M., & O‟Shea, A. (2019). An investigation of students‟
attitudes to science, mathematics and the use of technology in lower secondary education.
International Journal of Education in Mathematics, Science and Technology (IJEMST),
7(4), 319-334.
This article may be used for research, teaching, and private study purposes.
Any substantial or systematic reproduction, redistribution, reselling, loan, sub-licensing,
systematic supply, or distribution in any form to anyone is expressly forbidden.
Authors alone are responsible for the contents of their articles. The journal owns the
copyright of the articles.
Volume 7, Number 4, 2019
ISSN: 2147-611X
An Investigation of Students’ Attitudes to Science, Mathematics and the
Use of Technology in Lower Secondary Education
Niamh Burke O’Connell, Majella Dempsey, Ann O’Shea
Article Info
Abstract
Article History
Received: 08 June 2019
This paper explores lower secondary school students‟ attitudes to mathematics and science, to the teaching and learning of these subjects and the use of technology in the classroom. The data analyzed in this paper were obtained as part of an international project, Formative Assessment in Science and Mathematics Education (FaSMEd), which examined whether technologically enhanced formative assessment practice could improve the attitude and attainment of learners in science and mathematics at lower secondary level. This paper is focused on data from a survey and Q sort activities which investigated students‟ viewpoints in the context of mathematics and science classes in Ireland. The analysis showed that in general students have a positive attitude and self-image about learning science and mathematics, however the science students had a significantly more positive view of the subject, of their ability, and of the use of technology than their mathematics peers. The Q sort data showed that students who preferred to work alone tended to find technology less helpful than students who liked to work collaboratively. Students who saw the value of technology were often persistent and liked working with others. This has implications for the integration of technology in science and mathematics classes.
Accepted: 20 September 2019
Keywords
Affective variables Technology
Formative assessment Q methodology
Introduction
This paper explores students‟ attitudes to the teaching and learning of mathematics and science, and in particular to the use of technology in the lower second level classroom. This study is part of an international project, Formative Assessment in Science and Mathematics Education (FaSMEd), that examined the impact of technologically enhanced formative assessment practice on the attitudes and attainment of learners. FaSMEd partners created and adapted research-informed formative assessment (FA) activities and developed resources, processes and technological tools to create learning environments to encourage students to learn complex concepts and use technology to enhance and support that learning. By introducing technology, the project aimed to create environments which enhanced connectivity and feedback in the learning process. We will focus in this article on the views of lower level secondary students in Ireland on mathematics, science and the use of technology in classrooms. The data on which our analysis is based comes from a questionnaire completed by all participating students (n=267) and interviews with a sample of students (n=24) while they participated in a Q study.
Students’ Attitude to Mathematics and Science Learning
Attitude is a complex construct that contains many sub-constructs, among which are interest, enjoyment, motivation, self-related beliefs, emotional factors and perceived difficulty (see for example OECD, 2004, Chapter 3; Hannula et al, 2016). Di Martino and Zan (2011) identified three main dimensions to attitude toward mathematics, emotional dispositions towards mathematics, view of mathematics, and perceived competence in mathematics. Similarly, Yoon, Suh and Park found experience, perceptions and knowledge of science to shape attitudes toward learning and doing science (2014).
are confident in their own ability in relation to STEM subjects and who hold a positive image of these subjects are more likely to study them at university level, and furthermore these students often make their career choice while at secondary school. Thus, information about students‟ attitudes and what shapes them is valuable. Factors that have been found to have an influence on students‟ perceptions of school science include gender, classroom environment and teaching and learning pedagogies, with positive attitudes in science being promoted by active student engagement in learning tasks during science classes (Yoon et al., 2014; Savelsbergh et al., 2016). Murphy and Beggs (2003) observed that there was a declining interest in school science due to the content heavy nature of the curriculum as well as ineffective teacher pedagogy and the perceived difficulty of school science. According to Osborne, Simon and Collins (2003) the quality of science teaching is essential to promoting students‟ positive attitudes toward the subject, and technology has a role to play in the teaching and learning environment (Irving, 2006; Hennessy, Ruthven and Brindley, 2005; Quellmalz, 2013). This can be achieved through high levels of student involvement in lessons, personal support for students, positive relationships with classmates, differentiated teaching practice and a variety of learning activities (Myers & Fouts, 1992). Osborne et al. contend that science appears to be „a love-hate subject that elicits strong feelings in pupils‟ (2003, p. 1059) and developing interest in the subject therefore appears to be a real challenge. This seems to be the case for mathematics also; some people may hold the view that mathematics is only for those who have inherited ability, while others perceive mathematics to be a numbers game consisting of “numbers, rules and formulae” (Crawford, Gordon, Nicholas, & Prosser, 1993, p. 213) leading to a surface approach to tackling mathematics problems.
At primary level, it has been shown that motivation is important for learning, and that students‟ mathematics anxiety is negatively correlated with achievement (Gunderson, Park, Maloney, Beilock and Levine, 2018). On the other hand, Mutodi and Ngirande (2014) have highlighted the positive impact on pupils‟ perceptions of mathematics of the support they receive during lessons from both the teacher and the material available to them. With this in mind, the FaSMEd project aimed to facilitate the use of formative assessment (FA) techniques through technology. There are positive affordances with using technology for mathematics and science teaching in general (Hennessy, Ruthven and Brindley, 2005) and using formative assessment strategies has potential to enhance these affordances (Quellmalz, 2013). FA practices have been evidenced to impact on student learning (Wiliam & Leahy, 2015) and FA is seen as integral to teaching and learning (Black and Wiliam, 2009).
The use of technology in the classroom has grown immensely over the last 20 years and studies have been carried out on students‟ attitudes in relation to technology. Students in science classes often report that they appreciate the importance of technology in their lives, but sometimes feel that they lack knowledge or fluency with it (Incantalupo, Treagust, & Koul, 2014). Fabian, Topping, and Barron (2016) carried out a meta-analysis of 60 papers relating to the effect of the use of mobile technology on students‟ attitudes to mathematics. They found that students appreciated the use of technology but that the effect on attitudes to mathematics and achievement was not always positive. Studies have shown that technology in the collaborative learning situations can sometimes be a distraction and serve to increase the disengagement of students (Heflin, Shewmaker, Nguyen, 2017), so it is important to carefully consider how technology should be introduced to formative assessment activities.
Given the importance of students‟ attitudes to the successful implementation of teaching and learning pedagogies, we will focus in this article on the research questions:
What are the attitudes of lower secondary school students to the teaching and learning of science and mathematics?
What are the attitudes of lower secondary school students to the use of technology in the classroom?
Our research questions focus on the students‟ attitude to the teaching and learning of science and mathematics, rather than to the subjects specifically. However, we acknowledge that attitude to both are relevant to this research.
The FaSMEd Project
academic year. Following professional development, classroom observation (n=30) was undertaken to determine the extent technology and formative assessment strategies were being utilized. For more information see https://microsites.ncl.ac.uk/fasmedtoolkit/
Partners developed the FaSMEd framework (see Aldon et al. 2017) as a conceptual tool to represent the three main dimensions which characterize technologically enhanced FA processes: (1) the five key strategies of FA introduced by Wiliam and Thompson (2007); (2) the three agents that intervene in the FA processes and that could activate these strategies, namely the teacher, the student and the peers; (3) the functionalities of technology which were:
o sending and displaying where students and teachers shared work using technology
o processing and analysing where technology was used to collect data and analyze it in real time using technology such as sensors in science
o providing an interactive environment where students could use technology to draw graphs, to comment on each other‟s work and to get feedback from the teacher.
This framework for analyzing classroom interactions has proved robust, Cusi and colleagues used it to look at the use of digital worksheets within a connected classroom environment and found that all five FA strategies were supported by technology with the involvement of the three main agents (Cusi, Morselli and Sabena, 2017). The Irish intervention supported teachers using an online platform where they could share students‟ work and provide feedback to the class and to individuals. In the mathematics classrooms, technology was used to enhance discussion and mathematical talk in the classroom (Stein et al, 2008). In the science classrooms students used digital sensors to gather data and develop graphs in real time so that they could discuss scientific concepts. The focus was on getting students and teachers to send and display in the first instance (students uploaded their work onto the platform, making their work visible) and then to move on to processing and analyzing (students uploaded and worked on data in real time) and finally to providing an interactive environment (teachers and students discussed work samples and self-assessed and peer assessed work).
Methodology
The Irish FaSMEd team designed a Q sample of 48 statements relating to science and mathematics teaching, learning and assessment to use in questionnaires and a Q sort activity. These statements were finalized after a concourse of 91 statements developed by all FaSMEd partners were examined and the final 48 statements were chosen based on their comprehensiveness to model the larger process being examined (Brown, 1993) and taking the classification of Di Martino and Zan (2011) and the work of Yoon et al. (2014) into account. A set of between 40 and 80 statements are considered satisfactory in a final Q sample (Shinebourne, 2009). We considered the group of 48 statements and classified them into six categories: view of science/mathematics (VOS/VOM, nine statements), use of technology in learning (UOT, 12 statements), perceptions of examinations (POE, three statements), the usefulness of science/mathematics (UOS/UOM, seven statements), ideas about science/mathematics teaching and learning (STL/MTL, 12 statements), and the nature of science/mathematics (NOS/NOM, five statements). A full list of themes and their statements is included in Appendix A. This set of statements was used in both the questionnaire and in the Q sort activity. In the questionnaire, the students were asked to rate their agreement with the statements on a five-point Likert scale with strongly agree coded as 1 and strongly disagree coded as 5. During the Q sort students sorted statements onto a placemat (Figure 1) and were also interviewed about their perceptions of science/mathematics and their views of the activities they had participated in throughout the research project. The statements in the categories UOT, POE, and STL/MTL included references to formative assessment, to interactions between teachers, students and peers, and to how technology was used and thus reflected the three dimensional conceptual framework developed by the FaSMEd team.
technology noted that „very few research efforts went beyond the use of questionnaires‟, so we decided to use a combination of questionnaires and the Q method in order to strengthen our findings in this research project.
Q Sort Procedure
Students completed the Q sort activity on an individual basis with the interviewer asking the student questions about their view on science/mathematics teaching and learning as they sorted their statements and after their final sorting. At the beginning of the interviews, students were asked to arrange the 48 statements into two groups: statements they agreed with and statements they disagreed with. The student had the opportunity to ask the interviewer about any statements they were unclear about or needed relevant examples of. The student then had to rank the statements in a quasi-normal distribution by arranging them from strongly agree to strongly disagree, this is known as the condition of instruction (Brown, 1993) in a Q method activity (Figure 1). While the students were sorting statements, they were questioned and encouraged to comment on statements and their rankings which helped in the interpretation of the sorting configurations (Shinebourne, 2009). The activity took on average twenty minutes with students having the opportunity to move and swap statements if they felt necessary however it was emphasized that they had to place the statements in the quasi-normal shape producing a forced distribution of the statements. After the activity a photo was taken of each Q sort placemat for later analysis. The activity was also audio recorded and transcribed for data analysis.
Figure 1. Placemat in fixed quasi-normal distribution. Ranking values range from -4 to +4. Numbers in brackets indicate the number of items that can be assigned to any particular rank. A total of 48 items can be sorted in the
distribution illustrated.
Q Sort Analysis
Data analysis proceeded with quantitative factor analysis of the completed Q sorts. PQ method software (Schmolck and Atkinson, 2002) commonly applied in Q methodology facilitated the factor analysis. Due to the exploratory nature of our Q study, a principal components analysis (PCA) followed by a varimax rotation with eigenvalues greater than 1.00 determined what factors would emerge. PCA is a determinant form of factor analysis (Brown, 1993) and commonly used within a Q study (Akhtar-Danesh, 2016). Varimax rotation is a simple and reliable method of analysis and maximizes the amount of variance explained by the extracted factors (Watts and Stenner 2005, p.81). The analysis is used to identify groups or clusters with similar ranking patterns. The rankings of participants within a cluster were then combined to form a representative sort (or factor exemplar) for the viewpoint related to that factor (McKeown and Thomas, 2013). The data for the Mathematics and Science groups were analyzed separately and we found two factors (or viewpoints) within the mathematics group and three within the science group. These factors are named numerically. In the results section, we will describe the distinguishing features of each factor using the Q sort analysis and the interview data.
Rasch Analysis
Mathematics Education; for example, it is the model used to analyse results of the OECD PISA tests (OECD, 2014). The Rasch model focusses on the measurement of a single trait or construct at a time with the aim of producing an interval measure so that relationships between traits or groups of participants can be studied. For each construct (such as View of Science/Mathematics) we asked students a number of questions and used Winsteps (Linacre, 2009) to convert their responses into a single measure. Rasch analysis computes weighted and un-weighted mean square statistics (called the infit and outfit statistics respectively) for each item. These fit statistics give information on how well an item is contributing to the overall construct measure. As we can see in the analysis below, any items which have unacceptable infit or outfit statistics should be removed from the scale and should not contribute to the final measure. We also used the software to test the reliability and validity of our measures
Results and Discussion
Analysis of Questionnaire Data
The questionnaire given to students (n=141 mathematics and n=126 science students) had 48 statements presented in a random order so that questions from each scale were spread throughout the instrument. The questions were the same for the Science and Mathematics groups with the word „science‟ or „maths‟ inserted appropriately. [Students in Ireland usually use the word „Maths‟ to refer to mathematics.] Using Rasch Analysis, we investigated whether these scales measured a single construct or not. We will give full details of the analysis of the first scale, and summary data for the remaining ones. Note that we also carried out this analysis for the Science and Mathematics groups separately but the results were very similar to those of the whole group together and so we will report on the combined dataset.
View of Science/Mathematics
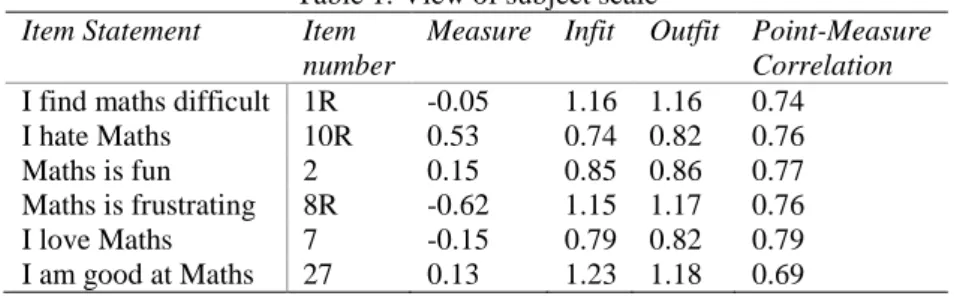
The first scale was View of Science/Mathematics. The questions that were included were: 1R, 2, 4, 7, 8R, 10R, 27, 34. (We reversed the coding on any negatively worded statements such as Questions 1, 8 and 10 here. These questions are labelled with the suffix R in order to distinguish them from the original questions.) The Rasch analysis indicated that Q4 and Q34 were not behaving like the other questions (Q34 Infit 1.39, Outfit 2.02; Q4 Infit 1.8, Outfit 1.92). When we removed both questions from the scale, all other items behaved well. Bond and Fox (2007 p.243) recommend that infit and outfit statistics for this type of data should lie between 0.6 and 1.4. Table 1 below has the items, their measures, infit and outfit statistics, plus point-measure correlations. The measures here describe how difficult the item is to disagree with (because we coded strongly agree as 1 and strongly disagree as 5) or equivalently how easy it is to agree with. So Q10R is the easiest to agree with, while 8R is the hardest to agree with.
Table 1. View of subject scale
Item Statement Item
number
Measure Infit Outfit Point-Measure
Correlation I find maths difficult 1R -0.05 1.16 1.16 0.74
I hate Maths 10R 0.53 0.74 0.82 0.76
Maths is fun 2 0.15 0.85 0.86 0.77
Maths is frustrating 8R -0.62 1.15 1.17 0.76
I love Maths 7 -0.15 0.79 0.82 0.79
I am good at Maths 27 0.13 1.23 1.18 0.69
For our View of Science/Mathematics scale (without Q4 and Q34) the item reliability was 0.94, the person reliability was 0.81 and the Cronbach alpha was 0.878. We concluded that this scale works well and we created measures for each person.
Technology
worked well together. The person reliability index was 0.77 and the item reliability index was 0.86. The Cronbach alpha was 0.839. We computed measures for this scale for each participant.
Usefulness of Science/Mathematics
Here we used questions 3, 5, 11R,17, 18R, 23, 24 The fit statistics looked good for all items. The Item reliability was 0.87, the person reliability was low at 0.48 but the Cronbach alpha was good at 0.785. We created a measure for this scale.
Exams
This scale has only three questions – 31R, 32, and 33 The items had good infit and outfit and the person reliability was 0.58 and Cronbach alpha was 0.686. The item reliability was 0.99. High scores on this scale indicate that students see value in exams (either as a motivator or as an indicator).
Other scales
We used Rasch analysis to investigate the Nature of Science/Mathematics scale and the Science/ Mathematics Teaching and Learning scale but neither were reliable and so we did not compute measures for students for these scales.
Comparison of the Mathematics and Science Groups
In general, both groups of students were positive about themselves and about their subjects; for example, 62% of Mathematics students and 68% of Science students agreed with the statement „I am good at Maths/Science‟. There were no significant differences in the mean measures of the Science and Mathematics groups on the Usefulness or Exam scales. There was a statistically significant difference on the View of Mathematics/Science and the Technology scales (t-test, p<0.001 in both cases). In both scales the Mathematics groups had significantly higher means which signifies that the Science group had a better view of themselves in relation to the subject and a more positive view of technology. The Technology measure is not significantly correlated with the Exam measure, but otherwise the measures are all significantly correlated (at the 0.01 level) with each other. Students were asked questions about learning and preferences, and even though the responses to these questions did not allow us to create a reliable scale, it is interesting to compare the answers that the groups gave. Differences were apparent in the responses to the statements „I learn Maths/Science best when I work on my own‟ and „The best way to learn Maths/Science is by working with others‟; the answers to both questions were not independent of groups (Chi-squared tests, p=0.032 and p=0.01 respectively) with Mathematics students agreeing more frequently than the Science students with the first statement and less frequently with the second. However, a large proportion of both groups of students seemed unsure of their answers to these two questions (between 20% and 30% in both questions for both groups).
We note that there was a significant difference between the Mathematics and Science groups in relation to the statement „We use a lot of technology in our maths/science classes‟. A chi-square test showed that the answers to this question were not independent of subject (p=0.004) with students saying that they saw more technology in the Science classrooms. The Science students were also more likely to agree with the statement „Using technology helps me understand maths/science better‟ than their peers in the Mathematics classes; 60% of the Science students agreed with this statement but only 38% of the Mathematics students did (chi-squared test, p=0.006). This may relate to how students in the science classes used the technology for processing and analysing rather than just sharing. The responses to the statement „Technology helps me find out for myself how I am doing in a maths/science activity‟ are not independent of the groups (chi-squared test, p=0.009). We see that Science students are more likely to agree here than their Mathematics counterparts (59% versus 37%). The majority of both groups (65% in Mathematics and 52% in Science) agreed with the statement „I prefer to talk to the teacher, rather than find out myself with technology‟.
the Mathematics Group. We also see differences in work methods, with the Mathematics students being less likely to value group work than their Science counterparts. The Science group is also more positive about the formative assessment aspects of the use of technology in their classrooms.
Q Sort Analysis: Mathematics
The Q method interview data give us information which allowed us to look deeper into the results arising from the surveys. The Q sort analysis revealed two factors in the mathematics data; six students were associated to the first factor and four to the second. The factor scores (such as those given in Table 2) for each statement are computed using weighted sums of Q sort scores (the weights are determined by factor loadings) for each participant in a given factor which are then scaled to give a Q score in the range -4 to +4. (Details of this process can be found in Chapter 4 of McKeown and Thomas, 2013). Because of the way that the data were coded, more positive Q scores here indicate disagreement and negative Q scores indicate agreement.
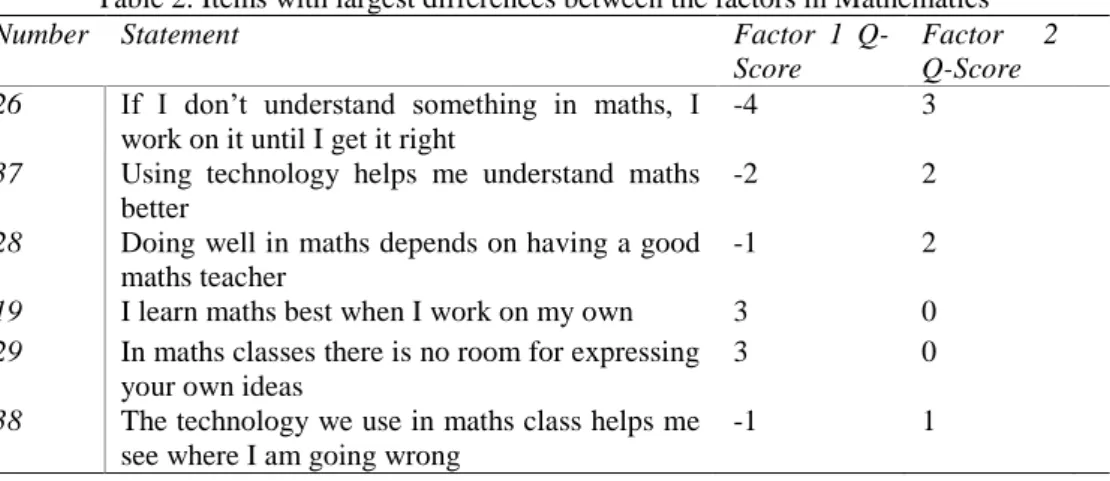
Before we look at the two factors in detail, let us consider the areas of consensus between them (Deignan and Browne, 2016; Newman and Ramlo, 2010). There was a high level of agreement between the two factors on about half of the items. These were (in order of agreement) items 34, 27, 23, 24, 16, 10, 45, 47, 35, 33, 7, 48, 21, 11, 40, 25, 15, 14, 32, 18, 1, 17, 4, 2. The participants in both factors showed that they had a relatively positive self-image with regard to mathematics and had a positive view of the usefulness of mathematics, this corresponds to the data from the questionnaires. Both viewpoints see the use of technology in mathematics as useful, and do not see technology as frustrating or difficult to use. It is informative to look at the statements which distinguish between the two factors (Table 2). The biggest difference between the viewpoints represented by the factors was in the response to the statement „If I don‟t understand something in maths, I work on it until I get it right‟ it seems as if the Factor 1 students are more persistent. There was also a significant difference between the factors‟ responses to the statement „I learn maths best when I work on my own‟. In this case the Factor 1 students disagreed strongly with the statement while the Factor 2 students were neutral. Similarly, Factor 1 students agreed strongly with the statement „The best way to learn maths is by working with others‟ while the Factor 2 viewpoint was neutral. The responses to these statements point to a greater preference for working in groups for the Factor 1 students. This more social view of learning held by Factor 1 students is also evident in the responses to the statement „In maths classes there is no room for expressing your own ideas‟. There was a significant difference between the two factors here with the Factor 1 group disagreeing strongly with the statement while the Factor 2 group was neutral. Two of the statements that distinguished between the factors concerned technology. Factor 1 group agrees that technology used in the mathematics classroom helps students understand mathematics and also see where they have difficulties, in contrast the Factor 2 group disagree with both of these sentiments. We will now consider the viewpoints represented by the two factors.
Table 2. Items with largest differences between the factors in Mathematics
Number Statement Factor 1
Q-Score
Factor 2
Q-Score 26 If I don‟t understand something in maths, I
work on it until I get it right
-4 3
37 Using technology helps me understand maths better
-2 2
28 Doing well in maths depends on having a good maths teacher
-1 2
19 I learn maths best when I work on my own 3 0
29 In maths classes there is no room for expressing your own ideas
3 0
38 The technology we use in maths class helps me see where I am going wrong
-1 1
Factor 1 Interpretation
Table 3. Statements that the mathematics factor 1 students strongly agreed with
Number Statement Theme
Q-Score 26 If I don‟t understand something in maths I work on it until I get it right MTL -4 21 It is easier to learn maths by doing practical activities MTL -4 30 The best way to learn maths is by working with others MTL -4
4 Maths is something everybody can learn NOM -3
5 Maths is used in everyday life UOM -3
This cohort of students had very strong opinions about the usefulness of mathematics outside of the classroom (Q5, 18, 24), they prefer their mathematicss lessons to be active (Q21), and to use technology (Q37) in preference to reading a textbook. When asked about using technology in the classroom one student said:
I think using the book is a lot harder, um I prefer to watch things and to look at things and to try to work it out in my head. (XMB_S24)
Table 4. Statements that the mathematics factor 1 students strongly disagreed with
Number Statement Theme Q-Score
18 I can do without maths UOM 4
20 You can learn maths best with just a textbook MTL 4
22 The best way to learn maths is by doing loads of exercises from the book MTL 4 24 Maths is only for the maths classroom and has nothing to do with real life UOM 3 29 In maths classes there is no room for expressing your own ideas MTL 3
Other students expressed the view that everyone is already used to using technology like smart phones or tablets and that using similar technology in class was „cool‟ (XMA_S15). We can also see that the Factor 1 group sees the value of formative assessment using technology in learning mathematics (Q38, 43). The students in this factor feel that their learning benefits from participation in group work (Q19, 30). For example, during interviews, these students commented that working with others is very important when it comes to learning:
If there‟s someone with a problem and you can explain it to them, you understand it better as
well. (XMB_S4)and
I think that it‟s better to interact with people when doing maths because it‟s easier to understand and other people can explain it rather than the teacher, because they actually know how you‟re feeling because they probably went through it. (XMB_S24)
The students in this factor are more also more persistent with mathematics than the students in Factor 2 (Q26).
Factor 2 Interpretation
The four remaining mathematics students loaded on Factor 2; the majority of students came from mathematics class B (S1, S6 and S17) and the other student was a member of class A (S5). Tables 5 and 6 display the students‟ strongest opinions about the given statements.
Table 5. Statements that the mathematics factor 2 students strongly agreed with
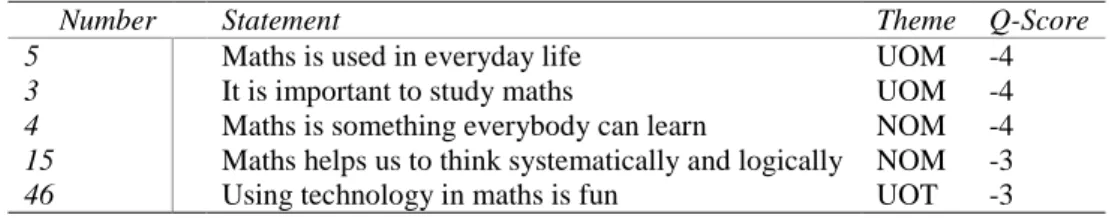
In this group the students‟ opinions about the usefulness of mathematics in the wider world (Q5, 24) and the importance of learning mathematics are very strong (Q3, 11, 18) and they convey their familiarity with the use of technology during mathematics lessons (Q44, 46). However, this group of students seem to be less persistent (Q26) than the students in factor 1. When explaining why they disagreed with statement 26 one student said:
Number Statement Theme Q-Score
5 3 4 15 46
Maths is used in everyday life UOM -4
It is important to study maths UOM -4
Maths is something everybody can learn NOM -4 Maths helps us to think systematically and logically NOM -3
Sometimes when I don‟t understand something I just don‟t, and then you have to do it again and I just hate it. (XMB_S1).
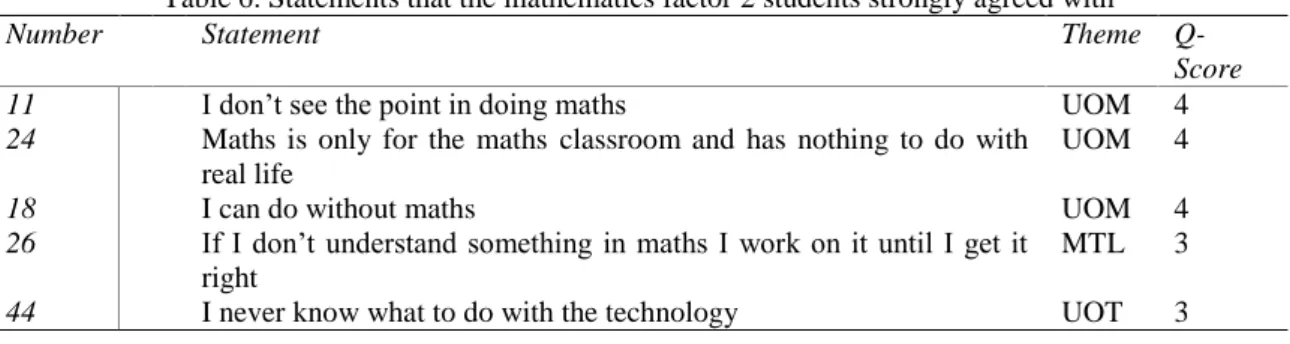
Table 6. Statements that the mathematics factor 2 students strongly agreed with
Number Statement Theme
Q-Score
11 I don‟t see the point in doing maths UOM 4
24 Maths is only for the maths classroom and has nothing to do with real life
UOM 4
18 I can do without maths UOM 4
26 If I don‟t understand something in maths I work on it until I get it right
MTL 3
44 I never know what to do with the technology UOT 3
This group was also less positive about working in groups than the students in factor 1 (Q 19, 30). One student explained that they found group-work distracting (XMB_S1). The students did not seem to use technology in a formative manner but preferred to look to the teacher for validation:
The best thing to help you understand the maths better is your teacher because she‟s there to teach you the maths so that‟s personally I think the teacher is the best person to help you. (XMB_S6)
This reliance on external help demonstrated by the Factor 2 students strongly links to a lack of student autonomy in this factor. When asked about what they do if they don‟t understand something in mathematics, one student commented that:
If you don‟t understand something, like if you have no idea what it means, if there‟s no one there to help you with it you‟re never going to get it. (XMA_S5)
This was not the opinion shared by the Factor 1 students as their opinions about mathematics conveyed their internal motivation to learn and keep working on a problem until they find the solution for themselves. The Factor 2 students seem to enjoy using technology however they do not seem to value it as a tool to help understand mathematics better.
Q Sort Analysis: Science
Three factors emerged from the analysis of the Science data which captured the opinions of the students participating in this project. Analysis was carried out by the same means as the mathematics data. Factor interpretation is as outlined in the following subsections. The consensus items for the Science group (Q 31, 4, 29, 9, 24, 20, 16) indicate that the group as a whole feels that everyone can learn Science and that it is useful in real life. The items where the largest disagreements between the three factors were evident are shown in Table 7. We can see that the Factor 1 group are the most positive about the use of technology in the classroom, the Factor 2 group are the most persistent in Science and are the only group who prefer to work alone, while the Factor 3 group do not seem to like using technology in the Science classroom and do not see themselves as persistent.
Table 7. Items of greatest disagreement between the factors in science
Number Statement Factor 1
Q-Score
Factor 2 Q-Score
Factor 3 Q-Score 26 If I don‟t understand something in science I work on it until
I do
-1 -4 3
19 I learn science best when I work on my own 1 -4 3
15 Science helps us to think systematically and logically -3 -3 3
48 I do not like using technology in science 3 -1 -3
46 Using technology in science is fun -3 0 3
Factor 1 Interpretation
Nine out of the 14 students interviewed were classified as being within this factor. The majority of students from school X were represented in this factor (S1, S20, S18) while three students came from school Y (S17, S5, S3) and the final three from school Z (S8, S9, S20). Tables 8 and 9 display the statements that this viewpoint most strongly agrees and disagrees with respectively. The strong opinions of this perspective on the usefulness of science outside of the classroom and the benefits of using technology for learning in science class were evident.
Table 8. Statements that the science factor 1 viewpoint strongly agreed with
Number Statement Theme Q-Score
5 Science is used in everyday life UOS -4
3 It is important to study science UOS -4
17 Science helps us to understand the world around us better UOS -4 15 Science helps us to think systematically and logically NOS -3
23 Science makes sense in the real world UOS -3
These students have very positive views of science. They can clearly see the importance of the subjects outside of the classroom and highlight how technology is important in their learning. One student commented that:
I do like using technology in science because it makes it more fun and easier for people to interact and ask questions rather than just studying by only using the book. (XSA_S20)
Furthermore, students could see the relevance of technology in teaching and learning and were very aware of how the technology they used in class had improved their teachers‟ ability to communicate feedback to them effectively. While discussing the technology the students realized that apart from examinations, it is very difficult for a teacher to monitor how they are doing in class however they believed that technology aided greatly in this:
Well they can see what we‟ve done better, it‟s hard to explain, if we do stuff on technology they can save it they, can see it…it‟s hard for them to know how we‟re getting on except by exams. (YSA_S3)
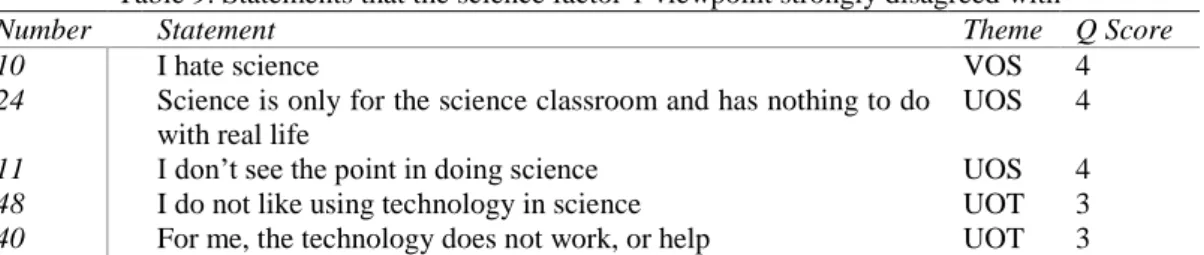
Table 9. Statements that the science factor 1 viewpoint strongly disagreed with
Number Statement Theme Q Score
10 I hate science VOS 4
24 Science is only for the science classroom and has nothing to do with real life
UOS 4
11 I don‟t see the point in doing science UOS 4
48 I do not like using technology in science UOT 3
40 For me, the technology does not work, or help UOT 3
These students have very positive views of science. They can clearly see the importance of the subjects outside of the classroom and highlight how technology is important in their learning. One student commented that:
I do like using technology in science because it makes it more fun and easier for people to interact and ask questions rather than just studying by only using the book. (XSA_S20)
Furthermore, students could see the relevance of technology in teaching and learning and were very aware of how the technology they used in class had improved their teachers‟ ability to communicate feedback to them effectively. While discussing the technology the students realized that apart from examinations, it is very difficult for a teacher to monitor how they are doing in class however they believed that technology aided greatly in this:
Factor 2 Interpretation
Three students in total were loaded on this factor from schools Y (S6) and Z (S18 and S3). Tables 10 and 11 present data on the statements that this viewpoint had strongest opinions on.
Table 10. Statements that the science factor 2 students strongly agreed with
Number Statement Theme Q-Score
19 I learn science best when I work on my own STL -4
26 If I don‟t understand something in science, I work on it until I get it right
STL -4 33 Doing exams motivates me to work harder in science POE -4 32 I like exams because the results show me how I am doing POE -3
3 It is important to study science UOS -3
Students loaded on this factor put a lot of emphasis on the importance of examinations to gauge success in science class (Q32, 33), they are also very persistent and will work until they understand something (Q26). All students who were classified in this viewpoint spoke about their preference to work independently rather than in a group (Q19, 30). For example, Student YSA_S6 likes to work on their own because „you can concentrate more‟ and Student ZSB_S18 said:
I don‟t like sharing my ideas with other people …. I enjoy [group work] but it‟s like a bit
annoying when everyone, when we don‟t come to an agreement or people don‟t work together for a certain plan. (ZSB_S18)
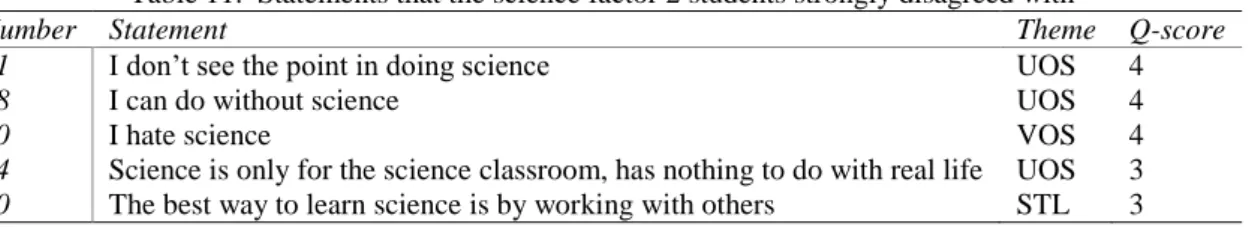
Table 11. Statements that the science factor 2 students strongly disagreed with
Number Statement Theme Q-score
11 I don‟t see the point in doing science UOS 4
18 I can do without science UOS 4
10 I hate science VOS 4
24 Science is only for the science classroom, has nothing to do with real life UOS 3 30 The best way to learn science is by working with others STL 3
This viewpoint was mostly neutral to negative on the benefits of using technology in the Science classroom (Q38, 39, 44, 45, 46). Student ZSB_S18 worried that using technology could lead to learners missing out on gaining certain skills and student ZSB_S3 said
It‟s not always good to use technology in science because sometimes it‟s better to use your head and think about something. (ZSB_S3)
Student YSA_S6 likes using technology in a group setting but finds it distracting:
I think technology doesn‟t really make sense to me, there‟s a lot of things happening around me, usually I like to focus on one thing and then there‟s probably some other people around me talking and I could get distracted and sometimes technology just, it brings me away from actually hearing things so if I‟m focussing on what to do or how to work the app or whatever it is that I‟m doing with technology it‟s a bit harder because I‟ll have to keep asking what‟s going on.
(YSA_S6)
Factor 3 Interpretation
Discussion and Conclusion
We have presented two types of data on student attitudes to teaching and learning in mathematics, in science, and to the use of technology in the classroom in this article. The questionnaire enabled us to compare the mathematics and science groups and the Q sort data gives us a deeper insight into the situation outlined by the survey data. We found that our method of data collection and analysis was effective in gaining an insight into students‟ perceptions of how teaching and learning plays out in the classroom. The quantitative nature of the Q methodology allowed for robust results to emerge while the data gathered from interviews during the activity provided the means for triangulation of these data. The current study advances the Q methodology as a valid and reliable tool for measuring participants‟ perceptions, views and opinions.
Using the survey data, we found that the majority of students hold positive attitudes towards their subjects and towards their own ability in these subjects, and this was confirmed in the Q sort data. Beliefs in ability are closely linked to attitudes to mathematics according to Hannula and colleagues (2016). We also found that the Science students had a significantly more positive view of the subject, of their ability, and of the use of technology than their mathematics peers. The Q-Method allowed us to identify two viewpoints in the mathematics group and three in the science group. The two viewpoints that emerged from the mathematics group were characterized by their attitudes to group work and to technology and by their level of persistence. Similarly, in the science group, the first factor was positive about the use of technology in the classroom and also about group work, the second group seemed to be very persistent, like to work independently and were not very positive about the use of technology in the classroom. The third group were not very confident in their own ability and seemed to depend on the teacher more than the other groups.
In general, results of this study suggest that the majority of students are very aware of the usefulness of both of these subjects outside of the classroom in the wider world. Statements such as „Maths/science is used in everyday life‟ were observed in the strongly agree section of three out of the five emergent factors. Other statements, for example „I can do without maths/science‟ and „I don‟t see the point in doing maths/science‟ were common in the strongly disagree sections in the majority of science and mathematics factors. These results are similar to findings from Jeffes et al. (2013) who noted the applicability that mathematics has outside of the classroom. This bodes well for these students‟ future attitude to STEM subjects and their willingness to continue studying these subjects (Maltese & Tai, 2011; Yoon et al., 2014).
The analysis of the questionnaire data showed that both the mathematics and the science students felt confident in expressing themselves in class, while working in groups was more favored by the science students. This was an important issue also in the Q sort data. The mathematics findings generally indicate that participating in practical activities during mathematics lessons is important for students when it comes to learning, corroborating the results of Myers and Fouts (1992). The Factor 1 mathematics students held strong opinions about doing practical activities in class, participating in group work and avoiding repeated use of the textbook during mathematics lessons. Although this was not as evident among the Factor 2 students, this cohort strongly agreed with the statements „Using technology in maths is fun‟ signifying their enjoyment of using alternative teaching and learning methods during class. However, the Factor 2 students also displayed a lack of persistence and of autonomy in learning with comments from interviews demonstrating how they rely on help from the teacher to figure out a problem.
It seems from the survey data, that the science students felt that they used technology more frequently than the mathematics students did. This may suggest that technology might be easier to implement in science teaching than in mathematics. However, we saw that there was no significant difference between the groups in their responses to the statement „Our maths/science teacher always uses some kind of technology in class‟. From our observations of these classrooms, we know that technology was in use both in mathematics and in science classes. It is possible that students made a distinction between the teachers‟ use of technology and of their own. From the Q sort data, we were able to see that the factors in both mathematics and science with the most positive views on technology also valued active learning methodologies and working in groups. We saw that some students found that working with others or with technology could be distracting, which echoes the results of Helfin et al. (2017).
increase the effectiveness of the use of technology in Education. Although the effect of using technology on student interest, motivation and attitude has been studied (Higgins et al. 2019), it would be interesting to further explore the influence of these affective variables on engagement with technology in future work.
Acknowledgements
This research was funded by the European Community‟s Seventh Framework Programme fp7/2007-2013 under Grant Agreement No (612337).
References
Akhtar-Danesh, N. (2016). An Overview of the Statistical Techniques in Q Methodology. Operant Subjectivity: International Society for the Scientific Study of Subjectivity 38(3–4): 29–36.
Aldon, G., Cusi, A., Morselli, F., Panero, M., & Sabena, C. (2017). Formative Assessment and Technology: Reflections Developed through the Collaboration between Teachers and Researchers. In G. Aldon, F. Hitt, L. Bazzini & U. Gellert (eds) Mathematics and technology: A CIEAEM source book. Advances Mathematics Education (pp. 551–578). Dordrecht: Springer.
Brown, S. (1993). A Primer on Q Methodology. Operant Subjectivity, 16(3/4), 91–138.
Bakker, A. (2018). Design Research in Education. A practical guide for early career researchers. London: Routledge.
Bond, T. G. & Fox, C. M. (2007). Applying The Rasch Model: Fundamental Measurement in the Human Sciences, second edition. Lawrence Erlbaum Associates publishers, New Jersey.
Cobb, P., Confrey, J., diSessa, A., Lehrer, R., & Schauble, L. (2003). Design Experiments in Education Research. Educational Researcher, 32(1), 9–13.
Crawford, K., Gordon, S., Nicholas, J., & Prosser, M. (1993). Learning mathematics at university level: initial conceptions of mathematics. In Sixteenth Annual Conference of the Mathematics Education Research Group of Australia, MERGA. Brisbane.
Cusi, A., Morselli, F., & Sabena, C. (2017). Promoting Formative Assessment in a Connected Classroom Environment: Design and Implementation of Digital Resources. ZDM Mathematics Education. doi: 10.1007/s11858-017-0878-0.
Di Martino, P., & Zan, R. (2011). Attitude towards mathematics: A bridge between beliefs and emotions, ZDM – The International Journal on Mathematics Education, 43(4), 471-482.
Fabian, K., Topping, K.J. & Barron, I.G. (2016). Mobile technology and mathematics: effects on students‟ attitudes, engagement, and achievement. Journal of Computers in. Education 3: 77. https://doi.org/10.1007/s40692-015-0048-8
Gunderson, E.A., Park, D., Maloney, E.A., Beilock, S.L., & Levine, S.C. (2018). Reciprocal Relations between Motivational Frameworks, Math Anxiety, and Math Achievement in Early Elementary School. Journal of Cognition and Development, 19, 21-46.
Hannula, M.S., Di Martino, P., Pantziara, M., Zhang, Q., Morselli, F., Heyd-Metzuyanim, E., Lutovac, S., Kaasila, R., Middleton, J.A., Jansen, A., Goldin, G.A. (2016). Attitudes, Beliefs, Motivation and Identity in Mathematics Education. ICME – 13 Topical Surveys.
Hennessy, S., Ruthven, K., & Brindley, S. (2005). Teacher Perspectives on Integrating ICT into Subject Teaching: Commitment, Constraints, Caution, and Change, Journal of Curriculum Studies, 37:2, 155-192, DOI: 10.1080/0022027032000276961
Heflin, H., Shewmaker, J. & Nguyen, J. (2017). Impact of mobile technology on student attitudes, engagement, and learning. Computers & Education, 107, 91-9937(2), 155-192.
Higgins, K., Huscroft-D‟Angelo, J., & Crawford, L. (2019). Effects of Technology in Mathematics on Achievement, Motivation, and Attitude: A Meta-Analysis. Journal of Educational Computing Research, 57(2), 283–319.
Incantalupo, L., Treagust, D.F.,& Koul, F. (2014) Measuring Student Attitude and Knowledge in Technology-Rich Biology Classrooms. Journal of Science Education and Technology. 23:98–107 DOI 10.1007/s10956-013-9453-9
Irving, K. I. (2006). The Impact of Educational Technology on Student Achievement: Assessment of and for learning. Science Educator, 15(1), 13‒20.
Maltese, A. V. & Tai, R.H. (2011). Pipeline Persistence: Examining the Association of Educational Experiences with Earned Degrees in STEM among U.S. Students. Science Education Policy. DOI: 10.1002/sce.20441
McKeown, B. & Thomas, D. B. (2013). Q Methodology, Second Edition. Thousand Oaks, CA: Sage.
McKenney, S., & Reeves, T.C. (2019). Conducting Educational Design Research. 2nd Edition. London: Routledge.
Murphy, C., & Beggs, J. (2003). Children‟s Perceptions of School Science. Social Science Review, 84(308), 109–116.
Mutodi, P., & Ngirande, H. (2014). The Influence of Students` Perceptions on Mathematics Performance. A Case of a Selected High School in South Africa. Mediterranean Journal of Social Sciences, 5(3), 431– 445.
Myers, R. E., & Fouts, J. T. (1992). A Cluster Analysis of High School Science Classroom Environments and Attitude Toward Science. Journal of Research in Science Teaching, 29, 927–937.
OECD, (2014). PISA 2012 Technical Report. Paris.
Osborne, J., Simon, S., & Collins, S. (2003). Attitudes Towards Science: A review of the Literature and its Implications. International Journal of Science Education, 25(9), 1049–1079.
Potvin, P., & Hasni, A. (2014). Interest, Motivation and Attitude towards Science and Technology at K-12 levels: A Systematic Review of 12 years of Educational Research, Studies in Science Education, 50:1, 85-129.
Quellmalz, E. (2013). Technology to support next-generation classroom formative assessment for learning. San Francisco: WestEd.
Reyes, L. H. 1984. Affective Variables and Mathematics Education. The Elementary School Journal, 84, 558-581.
Savelsbergh E.R., Prins, G.T., Rietbergen, C, Fechner, S., Vaessen B.E., Draijer J.M., & Bakker, A. (2016). Effects of innovative science and mathematics teaching on student attitudes and achievement: A meta-analytic study. Educational Research Review 19, 158-172.
Schmolck, P., & Atkinson, J. (2002). PQMethod (version 2.35). Web published: Retrieved from http://schmolck.userweb.mwn.de/qmethod/downpqmac.htm
Shinebourne, P. (2009). Using Q method in Qualitative Research. International Journal of Qualitative Methods, 8(1), 93–97.
Stein, M. K., Engle, R. A., Smith, M. S., & Hughes, E. K. (2008). Orchestrating productive mathematical discussions: Five practices for helping teachers move beyond show and tell. Mathematical Thinking and Learning, 10(4), 313–340.
Tytler, R., & Osborne, J. F. (2012). Student attitudes and aspirations towards science. In B. J. Fraser, K. Tobin, & C. J. McRobbie (Eds.), Second international handbook of science education (pp. 597–625). Dordrecht, Netherlands: Springer.
Watts, S., & Stenner, P. (2005). Doing Q Methodology: Theory, Method and Interpretation. Qualitative Research in Psychology 2, 67–91.
Wiliam, D., & Leahy, S. (2015). Embedding Formative Assessment. Florida: Learning Science International. Wiliam, D., & Thompson, M. (2007). Integrating assessment with instruction: What will it take to make it
work? In C. A. Dwyer (Ed.), The future of assessment: Shaping teaching and learning (pp. 53–82). Mahwah, NJ: Erlbaum.
Yoon, S. Y., Suh, J. K., & Park, S. (2014). Korean Students‟ Perceptions of Scientific Practices and Understanding of Nature of Science. International Journal of Science Education, 36(16), 2666–2693.
Author Information
Niamh Burke O’Connell Maynooth University Co. Kildare
Ireland
Majella Dempsey Maynooth University Co. Kildare
Ireland
Ann O’Shea Maynooth University Co. Kildare
Ireland
Appendix A. Themes and Statements
Scale Statement Number
View of Maths/ Science (VOM)
I find maths/science difficult. 1
I hate maths/science. 3
Maths/science comes naturally to some people. 7
Maths/science is fun. 14
Maths/science is frustrating. 16
I love maths/science. 19
I am good at maths/science. 35
I pick things up quickly in maths/science. 45
Using technology in maths/science is useful. 26
Use of
Technology in
Learning (UOT)
Using technology helps me understand maths/science better. 6 I do not like using technology in maths/science. 11 Our maths/science teacher has a better idea of how we are doing when s/he uses the technology to record our answers.
24
For me, the technology does not work, or help. 29
I never know what to do with technology. 30
Using technology in maths/science is fun. 31
When we work together, it makes sense to use the technology. 32 Technology helps me find out for myself how I am doing in a maths/science activity.
34 Our maths/science teacher always uses some kind of technology in class. 39
Using technology in maths/science is difficult. 43
The technology we use in maths/science class helps me see where I am going wrong.
44 Using technology in maths/science is frustrating. 46
Perceptions of
Examinations (POE)
Exams are boring. 4
I like exams because the results show me how I am doing. 12 Doing exams motivates me to work harder in maths/science. 28
Usefulness of
Maths/
Science (UOM)
Maths/science is used in everyday life. 5
Maths/science makes sense in the real world. 21
Maths/science is only for the maths/science classroom, has nothing to do with real life.
22
I can do without maths/science. 25
Maths/science helps us to understand the world around us better. 36
I don‟t see the point in doing maths/science. 8
It is important to study maths/science. 38
Ideas about
Maths/
Science Teaching
and Learning
(MTL)
The best way to learn maths/science is by doing loads of exercises from the book.
9 If I don‟t understand something in maths/science, I work on it until I get it right.
10 You can learn maths/science best with just a textbook. 13 In maths/science classes there is no room for expressing you own ideas. 15 I learn/understand maths/science best when I work on my own. 18 Doing well in maths/science depends on having a good maths/science teacher.
In maths/science we‟re always doing the same exercises over and over again.
40 The best way to learn maths/science is by working with others. 42 I prefer to talk to the teacher, rather than find out myself with the technology
2 We use a lot of technology in our maths/science classes. 27 The Nature of
Maths/
Science (NOM)
Maths/science means exploring and experimenting. 17
In maths/science the answer is either right or wrong. 23 Maths/science helps us to think systematically and logically. 41
Maths/science means seeing connections. 48