Drivers of redistribution of fishing and non-fishing effort after
the implementation of a marine protected area network
Reniel B. CaBRal,1,4 Steven D. GaineS,1 BRett a. JohnSon,2 tom W. Bell,3 anD CRoW White2 1Bren School of Environmental Science and Management, University of California, Santa Barbara, California 93106 USA2Biological Sciences Department, California Polytechnic State University, San Luis Obispo, California 93407 USA 3Earth Research Institute, University of California, Santa Barbara, California 93106 USA
Abstract. Marine spatial planning (MSP) is increasingly utilized to sustainably manage
ocean uses. Marine protected areas (MPAs), a form of spatial management in which parts of the ocean are regulated to fishing, are now a common tool in MSP for conserving marine biodiversity and managing fisheries. However, the use of MPAs in MSP often neglects, or sim plifies, the redistribution of fishing and non-fishing activities inside and outside of MPAs fol lowing their implementation. This redistribution of effort can have important implications for effective MSP. Using long-term (14 yr) aerial surveys of boats at the California Channel Islands, we examined the spatial redistribution of fishing and non-fishing activities and their drivers following MPA establishment. Our data represent 6 yr of information before the imple mentation of an MPA network and 8 yr after implementation. Different types of boats responded in different ways to the closures, ranging from behaviors by commercial dive boats that support the hypothesis of fishing-the-line, to behaviors by urchin, sport fishing, and recre ational boats that support the theory of ideal free distribution. Additionally, we found that boats engaged in recreational activities targeted areas that are sheltered from large waves and located near their home ports, while boats engaged in fishing activities also avoided high wave areas but were not constrained by the distance to their home ports. We did not observe the expected pattern of effort concentration near MPA borders for some boat types; this can be explained by the habitat preference of certain activities (for some activities, the desired habitat attributes are not inside the MPAs), species’ biology (species such as urchins where the MPA benefit would likely come from larval export rather than adult spillover), or policy-infraction avoidance. The diversity of boat responses reveals variance from the usual simplified assump tion that all extractive boats respond similarly to MPA establishment. Our work is the first empirical study to analyze the response of both commercial and recreational boats to closure. Our results will inform MSP in better accounting for effort redistribution by ocean users in response to the implementation of MPAs and other closures.
Key words: California Channel Islands; ecosystem-based management; fisheries management; fishing behavior; fishing strategy; fishing-the-line; ideal free distribution; marine protected area; marine reserve; marine spatial planning; marine protected area network.
intRoDuCtion of MPAs (Agardy et al. 2011), or poaching inside an
MPA may negate benefits from protection (Guidetti et al. Our oceans are increasingly managed spatially.
2008, Davis et al. 2015). Optimizing MPA site selection Implementation of marine protected areas (MPAs) is has received considerable attention, but primarily from now common (Gaines et al. 2010, Edgar et al. 2014), and
the perspective of the characteristics of the target species spatial management is further developing into a more (e.g., habitat, population distribution, biodiversity, and comprehensive approach, marine spatial planning
connectivity; Margules and Pressey 2000, Possingham (MSP), that covers a broad class of uses, including aqua- et al. 2000, Airamé et al. 2003, Leslie et al. 2003, Parnell culture, energy production, and shipping (Douvere 2008,
et al. 2006, Klein et al. 2008, Watson et al. 2011, White Foley et al. 2010). et al. 2013b, Cabral et al. 2015). By contrast, little is
Marine spatial planning identifies areas to be
pro-understood about how different resource user groups tected, but historically MPAs have been established in an respond to new spatial regulations. As a result, some have ad hoc, opportunistic basis (Agardy et al. 2011). Successful
argued that the main source of uncertainty in fisheries MPA design depends on resource users’ responses to new management is not the dynamics of the exploited spatial rules. Displacement of fishing effort due to MPA
resources, but the behavior and decision-making pro-establishment may exacerbate conditions in areas outside cesses of resource users (Hilborn 1985, Fulton et al. 2011). More specifically, accurate characterization of fishers’ Manuscript received 16 December 2015; revised 25 July 2016;
accepted 31 August 2016. Corresponding Editor: Paul K. Dayton. decision-making and behavior is rare (but see Parnell
4E-mail: [email protected] et al. 2010, Guenther et al. 2015), despite its critical role
in developing realistic expectations of the outcomes of
existing and proposed marine spatial plans (Smith and Wilen 2003, Charles 2010).
Of particular concern are the consequences of reallo cation of fishing effort in response to the implementation of MPAs where fishing may be regulated. The spatial dis tribution of fishing effort obviously plays a crucial role in affecting fish resource exploitation (Murawski et al. 2005, Cabral et al. 2010, Parnell et al. 2010, Kay et al. 2012, Miller and Deacon 2014). Spatial restrictions can concen trate effort, potentially leading to overharvesting and negative biodiversity impacts, at least in the short term. Also, closing valuable or easily accessible areas may impact fishery profits (Smith and Wilen 2003, Chollett et al. 2015). Furthermore, redistribution of effort may be a function of various social and cultural factors and not economically optimal, especially during the first few years after displacement from the MPA (Stevenson et al. 2013). With increased use of MPAs in ocean management, and calls to determine their effects on fisheries, fish pop ulations, and ecosystem health, there is a clear need for understanding the redistribution of fishing effort.
Models of the spatial distribution of fishing effort range from simple assumptions that MPAs eliminate effort to behavioral models that redistribute effort in relation to system-wide patch attributes. Importantly, in the context of MPA design and evaluation, these models typically estimate long-term outcomes without regard for short-term redistribution patterns over the initial years following MPA establishment (e.g., White et al. [2012], but see White et al. [2013b]). Consequently, such models may misinform expectations of the ecological and socio economic effects of spatial closures, particularly during the initial post-implementation years that are most con troversial to society (Weitzman 2001, White et al. 2013a).
A practical example of fishing effort displacement is occurring in California with the implementation of a state-wide network of MPAs through the Marine Life Protection Act (DFW 2013). Understanding the dynamics of this displacement will benefit the comprehensive reviews of MPA impacts that must occur every five years post-implementation for each coastal region (DFW 2013). These reviews represent the first formal evaluation of the effects of the network of MPAs. Their results relative to scientific and societal expectations of the network’s impacts will influence policy and public sentiment on the maintenance, management, and development of California’s current and future MPAs. It is critical that we enter these reviews with a realistic understanding of the MPAs’ effects to date.
Here, we used a long-term monitoring data set (14 yr) in the California Channel Islands to identify factors affecting the redistribution of fishing and non-fishing activities in the years immediately following MPA establishment. We used spatially explicit empirical data on the distribution of fishing and non-fishing activities (i.e., where boats are fishing) and factors hypothesized to affect effort distribution (e.g., habitat distribution, distance to port, weather risk, and dis tance to MPA borders), in relation to the establishment of
13 MPAs in California’s Northern Channel Islands, eleven of which are no-take reserves. Established in 2003, surveyed extensively before and after establishment, and consisting of replicate MPAs spread across a relatively finite study domain, the Northern Channel Islands MPAs provide an ideal case study for our analysis.
methoDS Study site
The Channel Islands National Marine Sanctuary (CINMS) includes the waters surrounding five of the Channel Islands off the coast of Southern California, USA (Fig. 1). The island group consists of San Miguel, Santa Rosa, Santa Cruz, and Anacapa Islands to the north and Santa Barbara Island to the south. The CINMS waters extend approximately six nautical miles (11.11 km) away from the mean high tide line on each island and encompass a total of 1470 square miles (3807 km2). The state of California has jurisdiction in waters within three nautical miles (5.56 km) of the shore, while the federal government has jurisdiction from 3 to nautical 200 miles (5.56–370.40 km).
Fly-over data
The Channel Islands National Marine Sanctuary insti tuted an aerial survey program called the Sanctuary Aerial Monitoring and Spatial Analysis Program (SAMSAP) in June 1997 with the goal of characterizing and monitoring changes in marine mammal distributions and human use patterns. Aerial surveys of the entire sanctuary were con ducted on a weekly basis (weather and aircraft mainte nance permitting), with about five flight hours per survey (Waltenberger and Pickett 2001; Appendix S1: Fig. S1). The survey transects were flown at around 1000 feet in ele vation ([1 foot = 0.30 m] Sanctuary Integrated Monitoring Network 2016; mean = 997.25 feet and median = 1000.66 feet, see Appendix S1: Fig. S2). Two transect surveys were conducted on separate days due to the dis tance of the islands from each other: a double figure-eight transect on the four northern islands (Anacapa, Santa Cruz, Santa Rosa, and San Miguel) and a double spiral at Santa Barbara Island (Waltenberger and Pickett 2001, see Fig. 2; Appendix S2 for the transects). For the northern islands, an inner loop was flown one-half nautical mile (0.93 km) from island shorelines and an outer loop was flown four nautical miles from the islands’ shorelines (Sanctuary Integrated Monitoring Network 2016).
FiG. 1. The California Channel Islands National Marine Sanctuary. The 13 black polygons are the marine protected areas in the Channel Islands. 1 mile = 1.6 km. (Color figure can be viewed at wileyonlinelibrary.com.)
taBle 1. The 15 boat types used in this study.
Category and type of boat Commercial consumptive
1 Commercial fishing
2 Lobster boat
3 Squid harvest boat
4 Squid light boat
5 Trawler
6 Urchin boat
Commercial non-consumptive
7 Commercial dive boat†
8 Freighter
9 Island support vessel
10 Whale watch
Recreational consumptive 11 Fishing (head boat)
12 Sport fishing
Recreational non-consumptive
13 Kayak†
14 Recreational boat†
15 Sail boat†
Notes: Boats are categorized as either commercial or recre ational and consumptive or nonconsumptive.
†These boat categories are also known to engage in recre ational fishing activities.
in the Channel Islands fishery, conducted the boat classi fication (U.S. Department of Commerce, National Oceanic and Atmospheric Administration, and National Marine Sanctuary Program 2008). SAMSAP recorded 26 categories of vessels, but only the 15 most frequently recorded vessel types are presented here (Table 1, Fig. 3). Over the course of 14 years (July 1997–February 2010), a total of 210 SAMSAP surveys were conducted. The data gives us 6 yr of information prior to the implementation of the California Channel Islands MPA network in 2003 and 8 yr after implementation. Based on the consistency of the tallied vessel locations and the recorded flight path in the SAMSAP data set, we extracted 199 consistent surveys for use in our analysis (see Fig. 2; Appendix S2 for the 199 flight paths along with the data points that indi cated the boat locations along the flight path). Surveys were conducted both during business and nonbusiness days, including holidays (nonbusiness days defined as Saturdays and Sundays as per Parnell et al. 2010) although surveys were more frequent on certain business days (Appendix S1: Fig. S3). The survey distribution during the before vs. after periods is relatively constant, with the exception of Sunday. The total number of surveys con sidered for before and after are about the same, enabling direct comparison of the survey data between the periods. The majority of the surveys were performed on days with clear weather (0–10% cloud cover, with and without haze) (Appendix S1: Fig. S4).
Habitat
Habitat information for the study site, categorized into hard bottom and soft bottom, was derived from the Pacific Coast Ocean Observing System (PaCOOS;
FiG. 3. Photos of different types of activities from the Sanctuary Aerial Monitoring and Spatial Analysis Program (SAMSAP) aerial surveys. The first panel contains boat types other than sail boats. Photos courtesy of the Channel Islands National Marine Sanctuary. (Color figure can be viewed at wileyonlinelibrary.com.)
Appendix S1: Fig. S5; data available online).5 We used percent hard bottom per grid cell or management unit as our independent variable. Although a fishing area is targeted because it has high fish biomass, spatial and temporal fish biomass information at sufficient resolution
for most species at different depths and habitats are lacking. Furthermore, fish move and have cyclical abun dance patterns and snapshot data of fish biomass may not capture the site-selection strategy of fishers. Habitat, on the other hand, is constant and commonly targeted.
Distance from harbors
Three harbors are within the vicinity of Channel Islands: Santa Barbara Waterfront and Harbor (34.405795° N, 119.691344° W), Ventura Harbor (34.249137° N, 119.26 4921° W), and Channel Islands Ventura County Small Boat Marina (34.165358° N, 119.224472° W) (Appendix S1: Fig. S1). Distance was computed using the “Vincenty Ellipsoid” method (Vincenty 1975) in the geosphere package in R (Hijmans et al. 2015).
Significant wave height
Data from the Coastal Data Information Program’s (CDIP) nowcast wave-propagation model were used to generate spatially explicit mean significant wave height values (Hs; mean height of the one-third highest waves) for the Southern California Bight (data available online).6 The CDIP model provided hourly estimates of Hs at a depth of 10 m from February 1998 to December 2014 for the entire domain at 800-m spatial resolution (e.g., Appendix S1: Fig. S6). The model simulates waves from long period (>8 s) offshore waves measured at the Harvest buoy, located approximately 50 km offshore of Point Conception, California. These hourly estimates were averaged temporally and outputted as monthly raster files, and then spatially averaged over the management area of our study site (i.e., each management unit has a corresponding mean SigWaveMean and standard devi ation SigWaveStd of significant wave height before and after MPA establishment). Across the entire data set, the maximum value of binned Hs is 4.07 m, and the minimum is 4.08 × 10⁻⁵ m.
Management unit
For our analysis we partitioned the SAMSAP survey domain into 1 by 1 nautical mile (1.85 × 1.85 km) grid cells or management units (Appendix S1: Fig. S7). The majority of the boat sightings (~99%) were within 0.5 nautical miles of the plane’s position (Appendix S1: Table S1). Our binning size accounts for the uncertainty in boat locations caused by oblique sightings. All dependent and independent variables were binned using the management zone grids.
Independent and dependent variables
The number of boats of a specific category within a management unit was the dependent variable. We limit
6 http://cdip.ucsd.edu/
our independent variables to factors that can be spatially allocated (e.g., habitat and wave height). Season is an example of a factor that cannot be added to grids, but the sampling was distributed evenly throughout the seasons and seasonality thus should not affect the before-and-after analysis (Appendix S1: Fig. S8). We used the following independent variables: the percent of the substrate that is hard (FractionHard, Appendix S1: Fig. S5), distance from the MPA borders (DistMPABorder, Appendix S1: Fig. S7), distance from the three nearest harbors in the area (Santa Barbara, DistPortSB; Ventura, DistportVentura; Channel Islands, DistPortChannelIs; Appendix S1: Fig. S1), and significant wave height (mean, SigWaveMean; standard deviation, SigWaveStd). These variables were chosen based on the following hypotheses: (1) ideal free distribution, which predicts that effort should redistribute according to resources, i.e., fishers should distribute their effort proportional to habitat availability (Gillis 2003, Branch et al. 2006); (2) distance from the MPA border, which would indicate if “fishing-the-line” occurs after MPA implementation, i.e., fishers prefer to fish near the MPA borders (Murawski et al. 2005, Kellner et al. 2007, Parnell et al. 2007, 2010); (3) distance to port, a proxy for steam time or travel time, which is one economic driver that could affect fishing behavior (Smith and Wilen 2003); and (4) significant wave height, an indicator of ocean con ditions that corresponds to fisher safety (Prince and Hilborn 1998).
Statistical analysis
FiG. 4. Correlation among independent variables. Inde pendent variables are percent hard substrate (FractionHard), distance from the Marine Protected Area (MPA) borders (DistMPABorder), distance from harbor (DistPort), and signi ficant wave height (mean, SigWaveMean; standard deviation, SigWaveStd). Colors and the shapes represent the strength of correlation (correlation coefficients, linear shape more highly correlated) and the inclination represents the trend of the correlation, e.g., areas near the harbors correlate with low wave areas. (Color figure can be viewed at wileyonlinelibrary.com.)
Costa et al. (2013) used a generalized additive model to address a similar question in Portugal, but their methods specified only the nonlinearity of the trends, not the factors describing the observed trends.
Since we included fishing-the-line as part of our hypothesis, we implemented two sets of analyses. In the first, we removed the points (boats) inside the MPA loca tions for the entire data set (Appendix S1: Fig. S10). In the second, we included all the data points and assigned dis tances from the MPA borders of zero to all boats located inside the MPAs. The results of the former assumption are presented below and the results of the latter assumption are shown in Appendix S1: Tables S2 and S3.
Statistical analysis was conducted using R (R Core Team 2014), while the shapefiles and parameters were processed using ArcGIS (v. 10.2.2, Environmental Sys tems Research Institute, Redlands, CA, USA), Python (v. 2.7.5, Python Software Foundation, Beaverton, OR, USA), Matlab (2012, The MathWorks, Inc., Natick, MA, USA), and R (R Core Team 2014).
ReSultS
No significant variable determined the spatial pattern of commercial dive boats prior to MPA establishment (Table 2). After MPA establishment, however, distance to MPA borders became a significant explanatory var iable with a negative coefficient, indicating that more dive boats were found close to the MPA borders (Table 3).
Distance to port influenced the spatial distribution of commercial fishing boats before MPA establishment (Table 2). Commercial fishers preferred areas near Santa Barbara Harbor and away from the Channel Islands Harbor. After MPA establishment, commercial fishers tended to prefer sites away from the MPA borders and
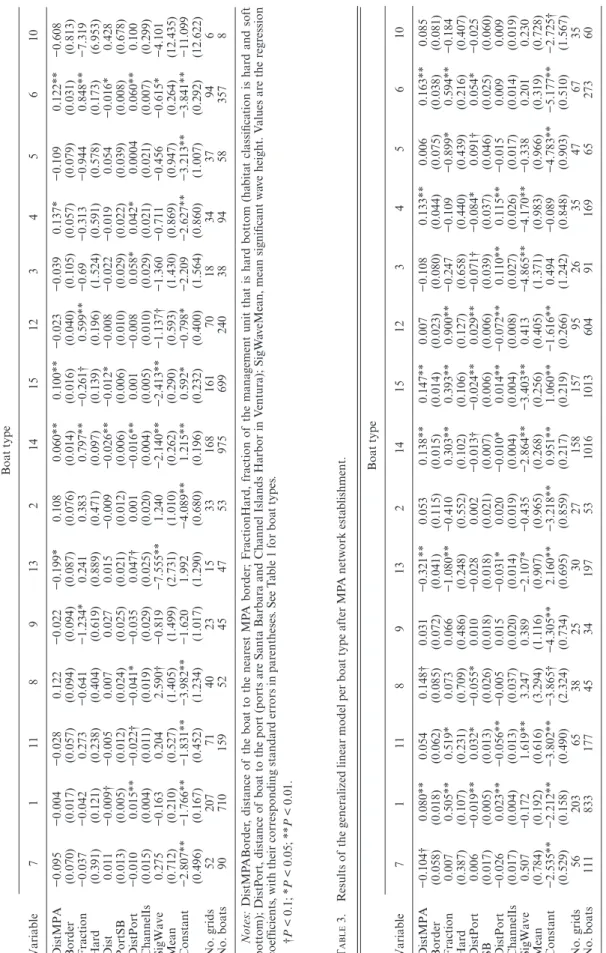
t aBle 2. R esults of the gener aliz
ed linear model per boa
t type bef
or
e Marine Pr
otected Ar ea (MP A) netw or k esta blishment. Boat type Variable 7 1 11 8 9 13 2 14 15 12 3 4 5 6 10 DistMPA −0.095 −0.004 −0.028 0.122 −0.022 −0.199* 0.108 0.060** 0.100** −0.023 −0.039 0.137* −0.109 0.122** −0.608 Border (0.070) (0.017) (0.057) (0.094) (0.094) (0.087) (0.076) (0.014) (0.016) (0.040) (0.105) (0.057) (0.079) (0.031) (0.813) Fraction −0.037 −0.042 0.273 −0.641 −1.234* 0.241 0.383 0.797** −0.261† 0.599** −0.69 −0.313 −0.944 0.848** −7.319 Hard (0.391) (0.121) (0.238) (0.404) (0.619) (0.889) (0.471) (0.097) (0.139) (0.196) (1.524) (0.591) (0.578) (0.173) (6.953) Dist 0.011 −0.009† −0.005 0.007 0.027 0.015 −0.009 −0.026** −0.012* −0.008 −0.022 −0.019 0.054 −0.016* 0.428 PortSB (0.013) (0.005) (0.012) (0.024) (0.025) (0.021) (0.012) (0.006) (0.006) (0.010) (0.029) (0.022) (0.039) (0.008) (0.678) DistPort −0.010 0.015** −0.022† −0.041* −0.035 0.047† 0.001 −0.016** 0.001 −0.008 0.058* 0.042* 0.0004 0.060** 0.100 ChannelIs (0.015) (0.004) (0.011) (0.019) (0.029) (0.025) (0.020) (0.004) (0.005) (0.010) (0.029) (0.021) (0.021) (0.007) (0.299) SigWave 0.275 −0.163 0.204 2.590† −0.819 −7.555** 1.240 −2.140** −2.413** −1.137† −1.360 −0.711 −0.456 −0.615* −4.101 Mean (0.712) (0.210) (0.527) (1.405) (1.499) (2.731) (1.010) (0.262) (0.290) (0.593) (1.430) (0.869) (0.947) (0.264) (12.435) Constant −2.807** −1.766** −1.831** −3.982** −1.620 1.992 −4.089** 1.215** 0.592* −0.798* −2.209 −2.627** −3.213** −3.841** −11.099 (0.496) (0.167) (0.452) (1.234) (1.017) (1.290) (0.680) (0.196) (0.232) (0.400) (1.564) (0.860) (1.007) (0.292) (12.622) No. grids 52 207 71 40 23 15 33 168 161 70 18 34 37 94 6 No. boats 90 710 159 52 45 47 53 975 699 240 38 94 58 357 8 Notes: DistMP ABor der
, distance of
the boa
t to the near
est MP A bor der ; F ractionHar d, fr action of the mana
gement unit tha
t is har
d bottom (ha
bita
t classifica
tion is har
d and soft
bottom); DistP
ort, distance of
boa
t to the port (ports ar
e Santa Barbar
a and Channel Islands Harbor in V
entur
a); SigW
av
eMean, mean significant w
av
e height. V
alues ar
e the r
egr
ession
coefficients
, with their corr
esponding standar
d err
ors in par
entheses
. See T
ab
le 1 f
or boa
t types
.
†P
< 0.1; *
P
< 0.05; **
P < 0.01. t aBle 3. R esults of the gener aliz
ed linear model per boa
t type after MP
A netw or k esta blishment. Boat type Variable 7 1 11 8 9 13 2 14 15 12 3 4 5 6 10 DistMPA −0.104† 0.080** 0.054 0.148† 0.031 −0.321** 0.053 0.138** 0.147** 0.007 −0.108 0.133** 0.006 0.163** 0.085 Border (0.058) (0.018) (0.062) (0.085) (0.072) (0.041) (0.115) (0.015) (0.014) (0.023) (0.080) (0.044) (0.075) (0.038) (0.081) Fraction 0.007 0.505** 0.519* 0.073 0.066 −1.080** −0.410 0.303** 0.393** 0.900** −0.247 −0.109 −0.899* 0.594** −0.184 Hard (0.387) (0.107) (0.231) (0.709) (0.486) (0.248) (0.552) (0.102) (0.106) (0.127) (0.658) (0.440) (0.439) (0.216) (0.407) DistPort 0.006 −0.019** 0.032* −0.055* 0.010 −0.028 0.002 −0.013† −0.024** 0.029** −0.071† −0.084* 0.091† 0.054* −0.025 SB (0.017) (0.005) (0.013) (0.026) (0.018) (0.018) (0.021) (0.007) (0.006) (0.006) (0.039) (0.037) (0.046) (0.025) (0.060) DistPort −0.026 0.023** −0.056** −0.005 0.015 −0.031* 0.020 −0.010* 0.014** −0.072** 0.110** 0.115** −0.015 0.009 0.009 ChannelIs (0.017) (0.004) (0.013) (0.037) (0.020) (0.014) (0.019) (0.004) (0.004) (0.008) (0.027) (0.026) (0.017) (0.014) (0.019) SigWave 0.507 −0.172 1.619** 3.247 0.389 −2.107* −0.435 −2.864** −3.403** 0.413 −4.865** −4.170** −0.338 0.201 0.230 Mean (0.784) (0.192) (0.616) (3.294) (1.116) (0.907) (0.965) (0.268) (0.256) (0.405) (1.371) (0.983) (0.966) (0.319) (0.728) Constant −2.535** −2.212** −3.802** −3.865† −4.305** 2.160** −3.218** 0.951** 1.060** −1.616** 0.494 −0.089 −4.783** −5.177** −2.725† (0.529) (0.158) (0.490) (2.324) (0.734) (0.695) (0.859) (0.217) (0.219) (0.266) (1.242) (0.848) (0.903) (0.510) (1.567) No. grids 56 203 65 38 25 30 27 158 157 95 26 35 47 67 35 No. boats 111 833 177 45 34 197 53 1016 1013 604 91 169 65 273 60 Notes: V aria bles ar
e as in T
ab
le 2. V
alues ar
e the r
egr
ession coefficients
, with their corr
esponding standar
d err
ors in par
entheses
. See T
ab
le 1 f
or boa
t types
.
†P
< 0.1; *
P
< 0.05; **
P
with hard bottoms, while their spatial relationship to the
distance to port did not change (Table 3). The change of the sign of the coefficient for both distances to MPA borders and habitat types indicates a strong signal for a change in fishing strategy following MPA establishment. Fishing head boats, a form of recreational activity where several anglers fish on a chartered boat, preferred areas near Channel Islands Harbor before MPA establishment. After MPA establishment, they still preferred areas near the Channel Islands Harbor but with an additional pref erence for areas with hard bottoms and higher waves. Local knowledge indicates that commercial lobster boats deploy their traps along the MPA borders, yet no factor explained their distributions before and after MPA establishment. Similarly, no factor explained the distribution of whale watching boats. Island support vessels seemed to avoid hard bottom waters before MPA establishment. After MPA establishment, no significant variable determined the spatial pattern of island support vessels (Tables 2 and 3).
Distance from MPA borders, distance to port, and wave height determined the spatial pattern of kayaks before MPA establishment. They preferred areas near the present location of MPA borders, low wave areas, and areas away from the Channel Islands Harbor. After MPA estab lishment, kayaks still preferred areas near the MPA borders and low wave areas, with additional preferences for sandy areas and areas near the Channel Islands Harbor. All of the factors (distance to MPA borders, habitat type, distance to port, and wave height) determined rec reational boat distribution both before and after MPA establishment. In both times, these boats preferred hard bottom, low wave areas that were far from the MPA borders and near to both Santa Barbara and Channel Islands Harbors.
All of the factors except distance from Channel Islands Harbor determined sailboat distribution before MPA establishment. Before MPA establishment, they pre ferred soft bottom areas, areas near Santa Barbara Harbor, low wave waters, and areas away from the MPA borders. After MPA establishment, all factors became significant determinants. The preference was the same as before, except that sailboats now preferred hard bottom areas, with additional preference for areas away from the Channel Islands Harbor.
Habitat and wave height determined sport fishing dis tribution. Sport fishers preferred hard bottom and low wave areas. After MPA establishment, they still preferred hard bottom areas, but waves became an insignificant factor. Distance to ports became a significant factor after MPA establishment, with coefficients indicating that sport fishers were concentrated near the Channel Islands Harbor and away from Santa Barbara Harbor.
Squid harvest boats, which generally use purse seines, preferred areas away from the Channel Islands Harbor before MPA establishment. After MPA establishment, distances to ports and wave height determined the spatial distribution of squid harvest boats. Squid harvest boats preferred to fish near Santa Barbara Harbor, away from
the Channel Islands Harbor, and in low wave areas. Squid light boats, which use lights to lure squids to the surface, have almost the same preference as squid harvest boats as they usually moved together when fishing.
No factor explained the spatial patterns of trawlers before MPA implementation. After MPA implemen tation, trawlers preferred soft-bottom areas that were away from Santa Barbara Harbor.
All factors determined the fishing patterns of urchin boats before MPA establishment. They preferred fishing areas that were away from the MPA borders, hard bottom areas, low wave areas, near Santa Barbara Harbor, and away from the Channel Islands Harbor. After MPA establishment, urchin fishers still preferred areas that were away from the MPA borders with hard bottom and away from Santa Barbara Harbor.
The significant constants/intercepts in the models indicate that the mean value of the dependent variable (number of fishers) is significantly greater than zero when all of the predictors are set to zero. The analysis in which all boats were included and boats inside the MPAs were given a distance from the MPA border of zero showed the same general trends as the first analysis (Appendix S1: Tables S2 and S3), with the exception of kayaks: the majority of kayaking activities occurred inside MPA boundaries (Appendix S1: Table S4). A sensitivity analysis for the top five boat types (in terms of number of data points), wherein the data were divided into business days and holidays and analyzed separately, indicates that the results appear to be robust although there are cases where patterns for holidays deviate from business days (Appendix S1: Table S5).
DiSCuSSion
target habitats (e.g., hard bottom reefs may be protected within the MPA, but they do not extend beyond the MPA boundaries). Furthermore, during the first few years post-MPA establishment, spillover benefits from fishing the-line may not manifest or be expected by fishers.
We did not find any significant variable influencing the spatial pattern of fishing effort for lobster fishers before or after MPA establishment. Congruent with Guenther et al. (2015), we did not find support for fishing-the-line. Although substantial nightly movement patterns by lobster generate an incentive for lobster fishers to fish the line (Withy-Allen and Hovel 2013), Guenther et al. (2015) attributed their findings to the lack of continuity of habitat near MPA borders where spillover can occur (but see Parnell et al. 2007, 2010), as well as to the potentially large fines that lobster fishers can incur when their traps drift inside the boundaries of the MPA. These factors dis incentivize lobster fishers from fishing-the-line. However, local knowledge contradicts this hypothesis: lobster fishers in the Channel Islands have often been observed deploying their traps near the MPA borders (J. Caselle,
personal communication, see also Parnell et al. (2007,
2010) for similar case studies in La Jolla, San Diego). The fly-over data set used in this study may not be appro priate to detect exploitation patters of fixed gears such as traps and gillnets, because boats can deploy these gears and leave them buoyed in the water for some time.
Horta e Costa et al. (2013) found that target species’ habitats drive fishers’ choices of alternative fishing sites. In our analysis, urchin boats, which primarily target the red sea urchin (Mesocentrotus franciscanus), consistently preferred hard bottom areas, where kelp forests often occur and urchins feed (Parnell et al. 2006, Hamilton and Caselle 2015), both before and after MPA implemen tation. Urchin boats also preferred areas away from the MPA borders both before and after MPA implemen tation, indicating that their fishing patterns were not affected by MPA establishment. M. franciscanus is a rel atively sedentary species, restricted to locations where their food occurs (Mattison et al. 1976); any MPA ben efits to this fishery would likely come from larval export rather than adult spillover. Furthermore, hard-bottom and kelp forest areas are more extensive outside the MPAs, as are urchins (California Department of Fish and Game, PISCO, CINMS, and Channel Islands National Park 2008); this may explain the urchin boats’ preference for areas away from the MPA borders before and after MPA implementation.
Sport fishing and recreational boats also exhibit a pref erence for hard bottom areas before and after MPA establishment and do not exhibit fishing-the-line. Thus, urchin fishing, sport fishing, and recreational boats all support the theory of ideal free distribution (Fretwell and Lucas 1969), where effort distribution is proportional to habitat attributes indicative of a location’s value. Parnell et al. (2010) also did not find evidence of fishing-the-line for vessels in the commercial sea urchin fishery or recrea tional anglers in their study in La Jolla, San Diego,
California. They found habitat attributes to be the main driver of site selection in these fisheries.
Before MPA establishment, no factor determined the spatial pattern of trawlers. After MPA establishment, habitat became an important variable: they avoided hard-bottom areas. This response can be explained by the estab lishment of MPAs in 2003 along with several other fisheries regulations, including the implementation of Cowcod Conservation Areas (2001), Rockfish Conservation Areas (2003 and 2005), and a ban on spot prawn trawling in state waters in 2003 (Office of National Marine Sanctuaries 2009). Cowcod, rock fishes, and spot prawn prefer hard-bottom areas (e.g., Love and Yoklavich 2007, Yoklavich et al. 2007).
The negative coefficients of habitat variables for squid harvest boats and light boats before and after MPA establishment indicate that squid boats preferred sandy habitats. Although none of the coefficients were signif icant, the results support the general understanding that the commercial squid fishery in Southern California uses seine and brail gear combined with attracting lights to capture aggregations of adult squid spawning in the shallow waters over sandy bottoms that is the preferred habitat of spawning squid (Young et al. 2011, Zeidberg et al. 2012, CDFW 2015).
Gornik et al. (2013) analyzed the behavior of private recreational boats in the Channel Islands and found that recreational boats prefer areas with high biodiversity and fish abundance, which are usually associated with hard bottomed areas (Dunn and Halpin 2009, Karpov et al. 2012). Consistent with their study, we found that most recreational activities (both consumptive and non-consumptive, Table 1) preferred hard bottomed areas (Tables 2 and 3).
In general, there is little evidence that distance to port constrains the spatial pattern of commercial fishing activ ities. On the other hand, distance to port appears to con strain recreational activities. In particular, recreational boats and sail boats consistently prefer areas near the mainland harbor. These activities aggregate near Anacapa Island and east of Santa Cruz Island, the two islands closest to both Santa Barbara and the Channel Islands Harbors. This makes sense as the value for recre ational activities might be almost uniform across the dif ferent islands in the Channel, and distance to the home port drives site preferences.
It is unclear whether dive boats are primarily drawn to the MPA itself or just to the boundaries. Commercial dive boats can, but do not necessarily always, engage in fishing activities. Counting the number of dive boats that were excluded from the analysis, because they were inside the MPAs, revealed that few dive boats were actually excluded from the analysis (Appendix S1: Table S4). This indicates that dive boats are attracted to MPA borders and not just MPA interiors. Dive boats target MPA boundaries, because they can engage in both diving and fishing on the edges of MPAs.
The general trends of our results remained the same, except for kayaks, when all boats were considered in the analysis (Appendix S1: Tables S2 and S3) and those that were inside MPAs were given a distance from the MPA border of zero. Most of the excluded boats were kayaks, thus explaining the difference observed for kayak distri butions in the two methods (Appendix S1: Table S4).
Private recreational boats, including kayaks, engage in a range of activities, both consumptive and non-consumptive. These boats might still be drawn to MPAs as some of them engage in non-consumptive diving, snor keling, and sometimes fishing. Although the SAMSAP data do not identify which recreational boats engage in fishing activity and which do not, a survey conducted in 2006–2007 found that 51% of private recreational boaters engage in consumptive activities (LaFranchi and Pendleton 2008). About 16% of recreational boaters described consumptive activities as the most important factor when choosing an anchorage site, while the remaining (84%) cited environmental factors or non-consumptive activities (LaFranchi and Pendleton 2008). One of the weaknesses of this work is our inability to fully define the activity of each boat. In particular, recre ational fishing boats may perform both fishing and non-fishing activities and the fly-over data do not distinguish between these activities. However, for many of the boat types that we analyzed, the activities are unambiguous or less uncertain (e.g., fishing boats). Several types of uncer tainties would obscure both the kind of activity that boats perform and the spatial locations of boats but the biggest contributors to uncertainties are (1) combining groups with different responses into a single group (e.g., recreational boats), and (2) combining positions that are meaningful (i.e., fishing locations while they fish and any reef location while they are engaged in non-consumptive recreation) with positions that are not meaningful (e.g., transit locations).
The overflight data indicated that some of the boats are inside MPAs. Unfortunately, the overflight data cannot discriminate what activities boats are engaged in. Poaching, particularly by recreational boats, may be dif ficult to identify. A small amount of poaching by experi enced anglers can reduce or even negate the success of MPAs, especially for some residential species (e.g., Francini-Filho and de Moura 2008, Cudney-Bueno and Basurto 2009). Failure to regulate poaching and protect the reserves through precautionary management may
weaken stakeholders’ support for MPAs as the burden of proof in favor of conservation rests on MPA managers.
Recreational boats, sailboats, kayaks, and dive boats are the boat categories that are also known to engage in recreational fishing activities. Recreational boats and sailboats appear to distribute themselves similarly to urchin and sport fishing boats, which follow an ideal free distribution, and not similarly to commercial dive boats, which showed fishing-the-line behavior, or kayaks, which have a consistent preference for low wave areas and areas near the MPA borders. This suggests that recreational boats and sailboats behave more like full-time fishing boats than full-time non-consumptive recreational boats. This result may be driven by the fact that a substantial proportion (i.e., ~50%) of recreational private boaters partake in fishing activity (LaFranchi and Pendleton 2008). Kayakers and other casual recreational fishers behave consistently with the expectation that they will gravitate to areas where others are not fishing. Presumably, if we were able to parse out recreational boats and sailboats into fishing and non-fishing activities, the ones fishing would be expected to follow the pattern shown by other fishing boats even more strongly, and perhaps the non-fishing ones would follow the pattern shown by the commercial dive boats. Also, since recrea tional boats on average fish half of the time, their strat egies may be the superposition of recreational and fishing boat strategies.
The uncertainty pertaining to transit locations will be largely noise that can obscure the patterns in fishing loca tions. SAMSAP surveyors reported that about 1% of the boats were in transit. Although small, this may still potentially diminish our power of detecting patterns in the fishing locations. The lack of observed patterns in site-selection strategies of some types of boats may be because our independent variables do not influence their site-selection strategies. For example, whale watching may be explained by thermoclines, haloclines, or other current-induced features, rather than habitat, waves, dis tance to MPA, or distance to harbor.
Our sensitivity analysis indicates that the day on which surveys were conducted influenced the results for some types of activities (Appendix S1: Table S5). For example, the overall spatial distribution pattern of urchin boats (combined weekend and weekday data) is driven by the weekday data. Similarly, the resulting pattern for com mercial fishing using the entire data set is similar to the result of using only the weekday data, but the result is different when the weekend data are used. Although rec reational activities may be more likely on a weekend, their site preference remains the same for weekdays and weekends. The low number of some types of boats observed on the weekends explains the lack of observed patterns when using weekend-only data.
interventions. Although the information derived from these surveys is useful on its own, comprehensive inter views with various user groups could provide validation for the motivations for the various fishing strategies observed here (e.g., Parnell et al. 2005). Future direction of this research is to conduct a more focused analysis on the potential impact of boat activity displacement to eco system functioning.
Our study provides several insights into the responses to MPA establishment of different fishing and non-fishing activities. We found support for non-fishing-the-line and ideal free distribution as mechanisms for the responses for some boat types following MPA estab lishment, while some responses were explained by the habitat choice of target species. Other activities, both fishing and non-fishing, were not affected by MPA establishment. Both fishing and recreational spatial patterns were affected by wave action. We found little indication that the distance to ports constrains a fishing boat’s site selection strategy, but it clearly constrains recreational activities. Evidently, it is incorrect to simply assume maintenance of the status quo in boat behavior (i.e., outside a new MPA, boat distribution pattern is unchanged). It is also incorrect to assume that none or a constant fraction of all boat types will be affected by MPAs: some activities clearly are more affected than others. Accounting for these responses will allow managers to better evaluate the social and ecological impacts of MPA establishment and better plan for these impacts, thus minimizing social tension and the potential for undesired outcomes or unexpected surprises.
aCknoWleDGmentS
We thank J. Caselle, H. Lenihan, G. McDonald, C. Elfes, and K. Siegel for their insights. We also thank Paul Dayton and the three anonymous reviewers for their constructive comments and suggestions on the earlier draft of this manuscript. This work is funded by California Sea Grant (R/RCC-03) (C. White, S. D. Gaines).
liteRatuRe CiteD
Agardy, T., G. N. di Sciara, and P. Christie. 2011. Mind the gap: addressing the shortcomings of marine protected areas through large scale marine spatial planning. Marine Policy 35:226–232.
Airamé, S., J. E. Dugan, K. D. Lafferty, H. Leslie, D. A. McArdle, and R. R. Warner. 2003. Applying ecological crite ria to marine reserve design: a case study from the California Channel Islands. Ecological Applications 13:170–184. Branch, T. A., et al. 2006. Fleet dynamics and fishermen behav
ior: Lessons for fisheries managers. Canadian Journal of Fisheries and Aquatic Sciences 63:1647–1668.
Cabral, R. B., R. C. Geronimo, M. T. Lim, and P. M. Aliño. 2010. Effect of variable fishing strategy on fisheries under changing effort and pressure: an agent-based model applica tion. Ecological Modelling 221:362–369.
Cabral, R. B., S. S. Mamauag, and P. M. Aliño. 2015. Designing a marine protected areas network in a data-limited situation. Marine Policy 59:64–76.
California Department of Fish and Game, PISCO, CINMS, and Channel Islands National Park. 2008. Channel Islands marine protected areas: first 5 years of monitoring: 2003– 2008. Page 20. California Department of Fish and Game, Sacramento, California.
CDFW. 2015. California Department of Fish and Wildlife. www.wildlife.ca.gov
Charles, A. 2010. Fisheries and marine protected areas: a spatial bioeconomic analysis of distributional impacts. Natural Resource Modeling 23:218–252.
Chollett, I., S. J. Box, and P. J. Mumby. 2015. Quantifying the squeezing or stretching of fisheries as they adapt to dis placement by marine reserves. Conservation Biology 30:166–175.
Cudney-Bueno, R., and X. Basurto. 2009. Lack of cross-scale linkages reduces robustness of community-based fisheries management. PLoS ONE 4:e6253.
Davis, K., M. Kragt, S. Gelcich, S. Schilizzi, and D. Pannell. 2015. Accounting for enforcement costs in the spatial alloca tion of marine zones. Conservation Biology 29:226–237. DFW. 2013. Marine Life Protection Act master plan. DFW,
Sacramento, California.
Douvere, F. 2008. The importance of marine spatial planning in advancing ecosystem-based sea use management. Marine Policy 32:762–771.
Dunn, D. C., and P. N. Halpin. 2009. Rugosity-based regional modeling of hard-bottom habitat. Marine Ecology Progress Series 377:1–11.
Edgar, G. J., et al. 2014. Global conservation outcomes depend on marine protected areas with five key features. Nature 506:216–220.
Foley, M. M., et al. 2010. Guiding ecological principles for marine spatial planning. Marine Policy 34:955–966.
Francini-Filho, R. B., and R. L. de Moura. 2008. Dynamics of fish assemblages on coral reefs subjected to different management regimes in the Abrolhos Bank, eastern Brazil. Aquatic Conservation: Marine and Freshwater Ecosystems 18:1166–1179.
Fretwell, S. D., and H. L. J. Lucas. 1969. On territorial behavior and other factors influencing habitat distribution in birds. Acta Biotheoretica 19:16–36.
Fulton, E. A., A. D. M. Smith, D. C. Smith, and I. E. van Putten. 2011. Human behaviour: the key source of uncer tainty in fisheries management. Fish and Fisheries 12:2–17. Gaines, S. D., C. White, M. H. Carr, and S. R. Palumbi. 2010.
Designing marine reserve networks for both conservation and fisheries management. Proceedings of the National Academy of Sciences USA 107:18286–18293.
Gillis, D. M. 2003. Ideal free distributions in fleet dynamics: a behavioral perspective on vessel movement in fisheries analy sis. Canadian Journal of Zoology 81:177–187.
Gornik, K., T. Lin, G. McDonald, N. Ng, C. Quigley, and D. Viana. 2013. The non-market value of private recreational boating in the Channel Islands National Marine Sanctuary: a 2012–2013 group project. Page 48. Group Project. Bren School of Environmental Science and Management, University of California Santa Barbara, Santa Barbara, California, USA.
Guenther, C., D. López-Carr, and H. S. Lenihan. 2015. Differences in lobster fishing effort before and after MPA establishment. Applied Geography 59:78–87.
Guidetti, P., et al. 2008. Italian marine reserve effectiveness: Does enforcement matter? Biological Conservation 141:699–709. Hamilton, S. L., and J. E. Caselle. 2015. Exploitation and recov
Hijmans, R. J., E. Williams, and C. Vennes. 2015. Geosphere: spherical trigonometry. R Foundation for Statistical Com puting, Vienna, Austria. https://cran.r-project.org/web/pack ages/geosphere/index.html
Hilborn, R. 1985. Fleet dynamics and individual variation: why some people catch more fish than others. Canadian Journal of Fisheries and Aquatic Sciences 42:2–13.
Horta e Costa, B., M. I. Batista, L. Gonçalves, K. Erzini, J. E. Caselle, H. N. Cabral, and E. J. Gonçalves. 2013. Fishers’ behaviour in response to the implementation of a marine pro tected area. PLoS ONE 8:e65057.
Karpov, K. A., M. Bergen, and J. J. Geibel. 2012. Monitoring fish in California Channel Islands marine protected areas with a remotely operated vehicle: the first five years. Marine Ecology Progress Series 453:159–172.
Kay, M. C., H. S. Lenihan, M. J. Kotchen, and C. J. Miller. 2012. Effects of marine reserves on California spiny lobster are robust and modified by fine-scale habitat features and dis tance from reserve borders. Marine Ecology Progress Series 451:137–150.
Kellner, J. B., I. Tetreault, S. D. Gaines, and R. M. Nisbet. 2007. Fishing the line near marine reserves in single and mul tispecies fisheries. Ecological Applications 17:1039–1054. Klein, C. J., A. Chan, L. Kircher, A. J. Cundiff, N. Gardner,
Y. Hrovat, A. Scholz, B. E. Kendall, and S. Airamé. 2008. Striking a balance between biodiversity conservation and socioeconomic viability in the design of marine protected areas. Conservation Biology 22:691–700.
LaFranchi, C., and L. Pendleton. 2008. Private boating and boater activities in the Channel Islands: a spatial analysis and assessment. Page 79. U.S. Department of Commerce, National Oceanic and Atmospheric Administration, National Marine Sanctuary Program, Silver Spring, Maryland, USA. Leslie, H., M. Ruckelshaus, I. R. Ball, S. Andelman, and H. P.
Possingham. 2003. Using siting algorithms in the design of marine reserve networks. Ecological Applications 13: 185–198.
Love, M. S., and M. Yoklavich. 2007. Habitat characteristics of juvenile cowcod, Sebastes levis (Scorpaenidae), in Southern California. Environmental Biology of Fishes 82:195–202. Margules, C. R., and R. L. Pressey. 2000. Systematic conserva
tion planning. Nature 405:243–253.
Mattison, J. E., J. D. Trent, A. L. Shanks, T. B. Akin, and J. S. Pearse. 1976. Movement and feeding activity of red sea urchins (Strongylocentrotus franciscanus) adjacent to a kelp forest. Marine Biology 39:25–30.
Miller, S. J., and R. T. Deacon. 2014. Protecting marine ecosys tems: regulation versus market incentives. University of California Santa Barbara Working Paper. http://www.steve-jmiller.com/wp-content/uploads/BycatchIFQs.pdf
Murawski, S. A., S. E. Wigley, M. J. Fogarty, P. J. Rago, and D. G. Mountain. 2005. Effort distribution and catch patterns adjacent to temperate MPAs. ICES Journal of Marine Science 62:1150–1167.
Office of National Marine Sanctuaries. 2009. Channel Islands National Marine Sanctuary condition report 2009. Page 60. U.S. Department of Commerce, National Oceanic and Atmospheric Administration, Office of National Marine Sanctuaries, Silver Spring, Maryland, USA.
Parnell, P. E., C. E. LennertCody, L. Geelen, L. D. Stanley, and P. K. Dayton. 2005. Effectiveness of a small marine reserve in southern California. Marine Ecology Progress Series 296:39–52.
Parnell, P. E., P. K. Dayton, C. E. Lennert-Cody, L. L. Rasmussen, and J. J. Leichter. 2006. Marine reserve design: optimal size, habitats, species affinities, diversity, and ocean microclimate. Ecological Applications 16:945–962.
Parnell, P. E., P. K. Dayton, and F. Margiotta. 2007. Spatial and temporal patterns of lobster trap fishing: a survey of fish ing effort and habitat structure. Bulletin, Southern California Academy of Sciences 106:27–37.
Parnell, P. E., P. K. Dayton, R. A. Fisher, C. C. Loarie, and R. D. Darrow. 2010. Spatial patterns of fishing effort off San Diego: implications for zonal management and ecosystem function. Ecological Applications 20:2203–2222.
Possingham, H., I. Ball, and S. Andelman. 2000. Mathematical methods for identifying representative reserve networks. Pages 291–306 in S. Ferson and M. Burgman, editors. Quantitative methods for conservation biology. Springer, New York, New York, USA.
Prince, J., and R. Hilborn. 1998. Concentration profiles and invertebrate fisheries management. Pages 187–196 in G. S. Jamieson and A. Campbell, editors. Proceedings of the North Pacific Symposium on Invertebrate Stock Assessment and Management. Canadian Special Publication of Fisheries and Aquatic Sciences 125. NRC Press, Ottawa, Ontario, Canada. R Core Team. 2014. R: a language and environment for statisti
cal computing. R Foundation for Statistical Computing, Vienna, Austria. http://www.R-project.org/
Sanctuary Integrated Monitoring Network. 2016. Sanctuary Aerial Monitoring and Spatial Analysis Program. http://sanc tuarymonitoring.org/projects/100416/sanctuary-aerial-moni toring-and-spatial-analysis-program
Smith, M. D., and J. E. Wilen. 2003. Economic impacts of marine reserves: the importance of spatial behavior. Journal of Environmental Economics and Management 46: 183–206.
Smith, M. D., and J. E. Wilen. 2005. Heterogeneous and correlated risk preferences in commercial fishermen: the perfect storm dilemma. Journal of Risk and Uncertainty 31:53–71.
Stevenson, T. C., B. N. Tissot, and W. J. Walsh. 2013. Socioeconomic consequences of fishing displacement from marine protected areas in Hawaii. Biological Conservation 160:50–58.
U.S. Department of Commerce, National Oceanic and Atmo spheric Administration, and National Marine Sanctuary Program. 2008. Channel Islands National Marine Sanctuary management plan/final environmental impact statement. Page 98. Channel Islands National Marine Sanctuary, Silver Spring, Maryland, USA.
Vincenty, T. 1975. Direct and inverse solutions of geodesics on the ellipsoid with application of nested equations. Survey Review 23:88–93.
Waltenberger, B., and M. Pickett. 2001. Integration of NOAA aerial monitoring and GIS programs for research, education, and management within the Channel Islands National Marine Sanctuary. Pages 469–471. Technical Report. National Oceanic and Atmospheric Administration, Santa Barbara, California, USA.
Watson, J. R., D. A. Siegel, B. E. Kendall, S. Mitarai, A. Rassweiller, and S. D. Gaines. 2011. Identifying critical regions in small-world marine metapopulations. Proceedings of the National Academy of Sciences USA 108:E907–E913. Weitzman, M. L. 2001. Gamma discounting. American
Economic Review 91:260–271.
White, C., B. S. Halpern, and C. V. Kappel. 2012. Ecosystem service tradeoff analysis reveals the value of marine spatial planning for multiple ocean uses. Proceedings of the National Academy of Sciences USA 109:4696–4701.
White, J. W., et al. 2013b. A comparison of approaches used for economic analysis in marine protected area network planning in California. Ocean and Coastal Management 74:77–89. Withy-Allen, K. R., and K. A. Hovel. 2013. California spiny
lobster (Panulirus interruptus) movement behaviour and hab itat use: implications for the effectiveness of marine protected areas. Marine and Freshwater Research 64:359–371. Yoklavich, M. M., M. S. Love, and K. A. Forney. 2007. A
fishery-independent assessment of an overfished rockfish stock, cowcod (Sebastes levis), using direct observations from an occupied submersible. Canadian Journal of Fisheries and Aquatic Sciences 64:1795–1804.
Young, M. A., R. G. Kvitek, P. J. Iampietro, C. D. Garza, R. Maillet, and R. T. Hanlon. 2011. Seafloor mapping and landscape ecology analyses used to monitor variations in spawning site preference and benthic egg mop abundance for the California market squid (Doryteuthis opalescens). Journal of Experimental Marine Biology and Ecology 407: 226–233.
Zeidberg, L. D., J. L. Butler, D. Ramon, A. Cossio, K. L. Stierhoff, and A. Henry. 2012. Estimation of spawning habi tats of market squid (Doryteuthis opalescens) from field sur veys of eggs off Central and Southern California. Marine Ecology 33:326–336.
SuppoRtinG inFoRmation