Fashion Rules?
Master Thesis
Political Science: Dutch Politics, Leiden University
Thesis supervisor: Dr. J.P. Vollaard
Second Reader: Dr. F.G.J. Meijerink
Florence Gerarda Joanna (Fleur) Veringa
Student number: 0904473
Date of submission: June 10, 2013
“Clothes make the man. Naked people have
little or no influence on society.”
Index
List of tables
5
Preface
6
Summary
7
Introduction
8
Theoretical Framework
10
Changes in voting behaviour 10
In the Netherlands 10
More attention to personalisation 11
Leadership traits 12
Increasing use of political marketing 13
In the Netherlands 14
Clothing as communication 15
Research Question 16
Hypotheses 16
Conclusion 18
Methodology
19
Design 20
Control group 20
Experimental groups 22
Questionnaires 23
Respondents 23
Testing hypotheses 24
Results
27
Control group 27
Testing hypotheses 28
Assessing normality 29
Hypotheses 29
Respondents’ advice 37
Conclusion 38
Discussion
40
Overview 40
Reflection 41
Further research 42
Conclusion 43
Literature
44
Books (chapters) 44
Journal articles 45
Newspaper articles 47
Websites 47
Appendix
48
1. Questionnaire 49
2. SPSS Codebook 53
List of tables
Table 1. Standard deviations of trait evaluations 28
Table 2. Means of trait evaluations on wearing a tie 30
Table 3. Means of trait evaluations on different persons 32
Table 4. Descriptive statistics for strong leadership- and
attractiveness-scores for clothing style 1, 2 and 3 35
Preface
The master thesis before you is written as a conclusion to the master programme Political
Science at Leiden University.
After finishing the bachelor Political Science in Leiden, the question arose: ‘now what?’ A difficult decision: Dutch Politics or Political Behaviour and Communication as a
track of the master Political Science. After careful consideration I chose the first option. In
this master thesis, however, I have tried to incorporate both scientific fields in view of my
next year’s plan to continue studying by doing the master Political Communication in
Antwerp, Belgium.
The writing of this thesis has gone through ups and downs. Finding a research topic
was not that hard, immediately I had the feeling I was on the right track. However, with the
approaching deadline for the first draft, I was slightly lost in the overview. But after some
days off and with the comments of my thesis supervisor, the fresh perspective helped me to
finish writing.
Not for a moment I have regretted my choice for the Dutch Politics track and the
subject of my final thesis. The good guidance of my thesis supervisor Dr. Vollaard, statistical
advice of Dr. Meijerink and the sharp questions of my fellow Dutch Politics students,
supported me in doing the best I could and have helped me to write the thesis as it is today. Of
course I also have to thank the men who wanted to pose for my photographs, without them
there would be no master thesis. And also the photographer was of unprecedented importance.
Lastly, I would like to thank all 129 respondents who took the time and effort to fill in one of
the questionnaires.
It is with great pleasure that I have worked on this thesis, and I hope you will have the same
experience whilst reading it.
Fleur Veringa
Summary
The role of ideology and religion on voting behaviour has declined. But, what does then
determine voting behaviour nowadays? New dimensions and (short-term) factors seem to play
a role and there is more attention to the personalization thesis. Some politicians are treated as
celebrities and image, appearance and also clothing are subjects considered to be important.
The suits of Mark Rutte and Diederik Samsom have been widely discussed in the run-up to
the 2012 Dutch parliamentary elections. Does fashion rule? The central question of this
master thesis is: Does the clothing style of politicians influence trait perceptions and voting
behaviour of Dutch voters?
A quantitative analysis of data obtained by an experimental study will be the basis for
this research. Unknown men will be photographed in different clothing styles, which
randomly assigned groups of respondents will evaluate on the basis of six leadership traits.
What will be analysed is if indeed the men in suits with ties are statistically significant more
positively evaluated on the six leadership traits compared to, for example, men in jeans and a
casual sweater. By testing four hypotheses, an answer to the research question can be given
and the implications of the results will be discussed. This analysis distinguishes between the
assessment by men and by women, by different age groups and by clothing style of
respondents themselves. In a first step to discover the influence of clothing on the evaluation
of Dutch politicians and voting behaviour, this study focuses only on male politicians, mainly
because men still dominate among party leaders in national parliamentary elections.
What seems to come out of the questionnaires overall, is the fact that it depends on the
person what he has to wear. Faces are more important when evaluating unknown persons in
pictures. Clothing style can in some way increase or decrease the evaluation scores of some
traits, but no clear relationship is to be found between certain traits and a specific clothing
style. Politicians’ clothing can reinforce certain leadership traits in the eyes of voters,
however, it differs between politicians which clothing style enhances which leadership traits.
In general, an in-between clothing style yields the most positive responses and the most votes.
But when looking independently at each trait, quite different evaluations appear between
different persons. Some small changes in methodology and recruitment of respondents will
make the findings of further research stronger. In further research, women definitely have to
Introduction
Recently, Dutch Prime-Minister Mark Rutte was pronounced as the third best-dressed world
leader by the American magazine Vanity Fair: “his classic, understated style suggests his
tailor must be as good as his optometrist.”1
David Cameron (Prime Minister of the United
Kingdom) and Laura Chinchilla (President of Costa Rica) were number one and two, but
Barack Obama (President of the United States) is just one of the names of the world leaders
Rutte leaves behind. Nowadays, politics is not only about the content and policy. The
introduction of television and weakening ideological ties in the Netherlands have led to a
greater focus on persons, image and appearance in Dutch politics (Van Praag and Brants
2008, 24). The audience is able to follow everything on television, internet and with smart
phones. As for the increasing attention to appearance in politics, politicians’ clothing is also
getting more attention.
In the run-up to the 2012 Dutch Parliamentary Elections, the suits of Prime Minister
Mark Rutte have been widely discussed.2 Moreover, the fact that opposition leader Diederik
Samson had his shirts made in the same shop in Amsterdam as Rutte became public
knowledge.3 Some party leaders even joined a photo shoot in the newest fashion for the Dutch
Financial Daily (Het Financieele Dagblad), after which they discussed the clothes they wear
when in parliament.4 Why are politicians’ clothes so intriguing? What can we learn about a
person by only looking at his or her clothes? What do we think clothing tells us about the
person wearing it?
Clothing can be seen as a form of nonverbal communication (Johnson et al. 2002, 25).
By means of the first impression and clothing of others, people classify each other (Hamid
1969, 191). People draw conclusions on the basis of clothing on characteristics and motives of
unknown persons. Those conclusions can be decisive and thus important in evaluations of and
preferences for a certain politician (Enzlin 1998, 50).
Does fashion rule? The title of this thesis is chosen to summarize in two words what
this thesis is about: the influence of clothing in politics. Therefore, the research question will
1
Weiner, J. “The Top 10 Best-Dressed World Leaders.” In: Vanity Fair (March 27, 2013).
2
See for example: Kouwenhoven, A. and D. Pinedo. “Zo wordt het dus niks, Mark.” In: NRC.Next (September 7, 2012); and Teeffelen, K. van. “Het pak, de kop en de inhoud.” In: Trouw (August 18, 2012).
3
See for example: Kouwenhoven, A. and D. Pinedo. “Kleren maken de lijsttrekker.” In: NRC Handelsblad
(September 7, 2012); and “Nieuw held van links; PvdA-leider Diederik Samson lijkt herboren na de zomer.” In:
De Telegraaf (September 1, 2012).
4
be formulated as follows: Does clothing style of politicians influence trait perceptions and
voting behaviour of Dutch voters?
In this era, wherein we can speak of constant political campaigning, campaign
consultants, rising costs and decreasing importance of content of politics, this study uncovers
whether clothing has an influence on voters’ minds or not and if so, which clothing style is
most appealing to them or which clothing style accentuates which leadership traits. The
societal relevance of this study is therefore a way to advise politicians. On the other hand, the
scientific relevance of this study lies in the fact that our knowledge on this subject, especially
in the Dutch case, is limited.
But why investigate the Dutch case? There is no certainty whatsoever if clothing has
some kind of influence in politics. Compared to other countries, the Dutch Parliament is rich
in various clothing styles (Hendriks and Meijerink 1998, 112). When clothing has an impact
on trait evaluations and voting behaviour, this should be seen in the Netherlands: a most likely
case. In addition, the numerous political parties of the Dutch political system and their party
leaders have to distinguish themselves from others by small things (Andeweg and Irwin 2009,
124). In a political system as the Dutch one, small changes will have a greater effect than in
states with a two-party system, because the switch between the two parties is much larger than
a switch between parties in a multi-party system.
In this master thesis, first of all, the theoretical foundation for this study will be
outlined. Changes in voting behaviour and campaign culture, in Western democracies in
general and the Netherlands in particular, will be described. Besides, attention shall be paid to
previous research on the influence of clothing in other sectors than politics.
A quantitative analysis of data obtained by an experimental study will be the basis for
this research. Unknown men will be photographed in different clothing styles, which
randomly assigned groups of respondents will evaluate on the basis of six leadership traits.
What will be analysed is if indeed the men in suits with ties are statistically significant more
positively evaluated on the six leadership traits compared to, for example, men in jeans and a
casual sweater. By testing four hypotheses, an answer to the research question will be given
and implications of the results will be discussed. This analysis will distinguish between the
assessment by men and by women, by different age groups and by the clothing style of
respondents themselves. In a first step to discover the influence of clothing on the evaluation
of Dutch politicians and voting behaviour, this study will focus only on male politicians,
Theoretical framework
The theoretical framework forms the basis for this master thesis. Changes in voting behaviour,
and thereby campaign cultures, in Western democracies in general, and the Netherlands in
particular, will be described. A trend from content as the most important factor in convincing
the voter towards communication and increased attention for the personalization thesis can be
discovered in the last years. Also leadership traits shall be introduced in this section. With the
gap of knowledge of the influence of clothing in politics, attention shall be paid to previous
research on the influence of clothing in other sectors than politics. After the introduction of
the research question, four hypotheses will be composed based on previous studies.
Changes in voting behaviour
The political marketplace, which includes every aspect a candidate, party or government has
to consider, as well as the more obvious aspects such as how voters behave, has changed
significantly since the 1960s (Lees-Marshment 2009, 5). Party membership has declined in
numbers and activity levels and also party identification has declined. The number of voters
participating in traditional politics is decreasing, in particular youth, with turnout falling. On
the other hand, involvement in new movements or pressure groups has increased (ibid., 6).
Voting behaviour had become less predictable, with the effect of an increase in electoral
volatility. Traditional bases of segmentation or cleavages in the electorate, such as class,
geography and family background, have been eroded, while complex new electoral segments,
such as those based on ethnicity, race, lifestyle, stage in life cycle, and age factors have
emerged (ibid.). Moreover, television and the Internet have now become the prime sources of
political information and the number and nature of media outlets and competition have vastly
expanded and have become more commercial, competitive and questioning of elites. Voters
are more critical of political elites and institutions (ibid.).
In the Netherlands
The changes described by Lees-Marshment were also seen in the Netherlands. According to
Andeweg and Irwin two societal developments were the driving force for these changes. On
the one hand, the religious and class composition of the Dutch society started to change
(Andeweg and Irwin 2009, 111). In the Netherlands the structure of voting always followed
political parties, Dutch voters voted according to their social groups and were not used to look
around for the most important party (ibid., 109-111). By means of the weakening of these ties,
the explanatory power of religious and class composition on voting behaviour dropped from
approximately 72% in 1956 to 28% in 2006 (ibid., 113).
On the other hand, the number of secular middle-class liberal voters grew
substantially, which made the Dutch structured model of voting behaviour no longer useful to
understand Dutch voting behaviour (ibid., 113). As social cleavages were weakening, so were
ties between parties and their voters. The competition for votes has become more open and
electoral volatility increases more and more (ibid., 41). However, Andeweg and Irwin state,
“the decline in the importance of group identification as the primary factor in explaining
voting choice does not mean that voters have had nothing to guide them in determining their
vote” (ibid., 114). A single or two-dimensional ideological structure is seen as a dominant and
sufficient model for understanding voting behaviour in the Netherlands (ibid., 118). But also
other factors, often short-term ones, are becoming more important in influencing voters’
choices (ibid., 124). The economy is one of these factors and the personalisation thesis also
gets more attention in this view.
More attention to personalisation
Karvonen argues that “one of the factors that has gained in importance is the role of
individual politicians and of politicians as individuals in determining how people view
politics and how they express their political preferences” (Karvonen 2010, 2). This is what is
called the personalization thesis. Personalization can be defined as the notion that “individual
political actors have become more prominent at the expense of parties and collective
identities,” a change over time (Karvonen 2010, 4). Some state Dutch party leaders, the party
faces, are winning or losing elections for their political parties nowadays and factors such as
charisma, appearance, presentation, and television-personality are deciding factors in
elections, at least in the view of different political parties and the media (Jansen and Van
Holsteyn 1998, 6). These thoughts have led to a large role for the Dutch party leaders and
more person-focused election campaigns (Toonen 1994, 85).
“Critics can be heard charging that voters no longer vote for a party and its ideas, but for a leader and his or her attractiveness” (Andeweg and Irwin 2009, 119). It is though a
major challenge to sort out to what extent voters have voted for a party or for a party leader or
voters indicate that they voted for a party (ibid., 121). Moreover, voters were asked in the
2006 national election studies if they would have voted for the person whose name they had
selected on the ballot if this person had been on the list of another party, they overwhelmingly
stated that they would not have done so (ibid., 121). These results suggest a minimal impact
of party leaders on election results. But still, the impact of the party itself has to be
distinguished from the impact of the person, which are both closely tied together (ibid., 122).
Andeweg and Irwin state “a party can be helped considerably by a leader who is able to sell the message well. A good product, well packaged, will sell” (Andeweg and Irwin 2009,
123). The party leader has to have greater popularity than the party to win votes for the party
(ibid.). Voters are convinced that they vote for the party, but they are influenced by who is
putting the message forward and in what way. With so many options available to the voters,
often with minor differences in content, the packaging and the messenger can have an
influence (ibid., 124). A shift from a focus on content to a focus on communication can be
discovered.
Leadership traits
Ohr and Oscarsson argue politically relevant and performance-related leader traits, such as
leadership capabilities, trustworthiness, reliability, and empathy, are important criteria for
voters’ political judgments and (voting) decisions, which they found this in their analysis of
political leader traits in several U.S. presidential elections and in other countries (Ohr and
Oscarsson 2011, 212). Also Keating, Randall and Kendrick used several traits, relevant for the
evaluation of politicians, namely dominance, strong leadership, cunningness, attractiveness,
compassion and honesty (Keating et al. 1999, 593). These two groups of traits can be seen as
perceptions of power and perceptions of warmth, both relevant for voting behaviour (ibid.).
Danny Hayes developed a theory of trait ownership, in which he expects and finds that
“Republicans will be perceived as stronger leaders and more moral than Democrats. At the
same time, Democrats are likely to be viewed as more compassionate and empathetic than
Republicans” (Hayes 2005, 911). By living up to these expectations and even by having some
leadership traits usually owned by candidates of the other party, advantage can be taken by
the candidate (Hayes 2005, 912). Candidates have thus more to gain by traits candidates of his
or her party do not normally own.
In the media is often stated that the image is what really matters in modern election
important factor for voters to base their vote on (see, for example, Hayes 2005; Van Holsteyn
and Andeweg 2012). But appearance of a politician indeed does matter to some extent
(Pellikaan and van Holsteyn 2012, 1). Candidate image will be not decisive in voting
decisions for those with strong partisan leanings or ideological positions (Barrett and
Barrington 2005, 100). But for a large part of the voters ideological positions are less coherent
and party affiliation is declining. Job-related character traits seem to play a role in candidate
evaluation and voting decisions (Rosenberg et al. 1991, 346).
“People ‘learn’ about several personality traits and are positively influenced in terms
of affect on the basis of a favourable photograph or negatively by an unfavourable one,
perhaps without knowing and noting that they are influenced at all” (Pellikaan and Van
Holsteyn 2012, 15). Undetected changes in photos of politicians’ faces do influence
perceivers’ character judgments of familiar politicians (Keating et al. 1999, 607). Rosenberg
et al. wanted to identify those elements of the visual presentation of a political candidate
which contribute to a favourable political image and therefore presented women in two ways,
- according to earlier steps in the research - a favourable and an unfavourable photograph
(Rosenberg et al 1991, 349). They found in two out of three artificial elections a significant
effect, even though voters had some information on issue positions of the candidates.
Candidates with a favourable photograph were significantly more popular than candidates
with an unfavourable photograph. In real elections voters are “presented with a variety of
types and sources of information thereby reducing the impact of candidates’ appearance or
style” (Rosenberg et al. 1991, 360). Voters’ trait evaluations of politicians are important for
their voting decisions and it can be concluded that image has an influence on these trait
evaluations.
Increasing use of political marketing
In election time, political parties try to show candidates in their best way. This is what we call
political marketing (Kramer et al. 1996). Political marketing can be defined as: “political
organisations (such as a political parties, parliaments and government departments) adapting
techniques (such as market research and product design) and concepts (such as the desire to
satisfy voter demands), originally used in business world, to help them achieve their goals
(such as win elections or pass legislation)” (Lees-Marshment 2001, 22).
Political campaigns have become more professionalized and more expensive (Brants
communication channel, the image is also important. It is not only the content that counts
(Karvonen 2010). Emerging new market segments such as young people, pensioners, women
and ethnic groups present new challenges for candidates and parties. Such segments are
distinctive in their lifestyles, attitudes, political participation and policies they desire. Parties
therefore need to respond in different ways, with new understanding that traditional politics
may not be able to help them with, but marketing may (Lees-Marshment 2009, 7). By means
of the declining levels in turnout, politics itself needs marketing.
In the Netherlands
“Boring, cheap and amateurish” was the image Dutch election campaign had before the
campaign of 2002 (Van Praag 2005, 21). The Dutch campaign culture has changed over the
years and political marketing has come to play a role in this spectrum. As stated in the
introduction of this thesis, the reasons for this shift are the weakening social cleavages,
technological developments and the changing relationship between media and politics (Van
Praag and Brants 2008, 23). Many state the 2002 parliamentary elections were the turning
point from modern campaigning to postmodern campaigning (Van Praag 2005, 22). In a
modern campaign the campaign is centralized, television is the central medium and the focus
is on parties rather than voters. A postmodern campaign is characterized by the upcoming
information and communication technology, a voter-orientation and a fragmentized media
landscape (ibid.). Van Praag and Brants state, however, the 2002 elections were no turning
point, but more of an acceleration (Van Praag and Brants 2008, 22 and 28).
Now, Dutch election campaigns are centrally organized and professionals around party
leaders (in Dutch: lijsttrekkers), are becoming more important and indispensable (Andeweg
and Irwin 2009; Van Praag and Brants 2008, 24). Electoral research takes a central position in
election campaigns of Dutch political parties and the costs of these campaigns are increasing.
According to Van Praag and Brants the voter is central in temporary election campaigns, more
than issue positions of political parties (Praag and Brants 2008, 24).
Professionals are indispensable, short messages for target populations are becoming
more important during the permanent campaigning. Political campaigns are professionalized,
not only because of the ‘media logic’, but rather because of the loosening ties between politics
and the voters (Van Praag 2005, 23). ‘Media logic’ implies that political parties are forced to
adjust to production routines and selection criteria of the media (a ‘public logic’ on the other
decreasing number of voters is sticking to the same political party, which makes electoral
punishment a real treat (Van Praag 2005, 23).
Clothing as communication
With the shift from a focus on content to a focus on communication and the television as a
central medium, politicians’ looks and appearance is more visible for the voters and
politicians should adjust to this. As earlier stated in the introduction, clothing is a nonverbal
form of communication (Johnson et al. 2002, 125). By means of the first impression and
clothing of others, people classify each other. “Judgments of others are so much a part of our
social experience that we tend to overlook their significance in the analysis of social
behaviour. […] Their value becomes marked in situations where information about the other
person is minimal or ambiguous and where there is more room for perceiver bias to operate”
(Hamid 1969, 191). Johnson, Schofield and Yurchishin (2002) discovered that respondents
thought to know a lot about others when only focusing on appearance and clothing, the first
impression. These respondents also assumed others could discover a lot about their
personality by only looking at their own clothing style (Johnson et al. 2002, 135). It seems
that someone’s appearance influences the view of others. People conclude on the basis of clothing on characteristics and motives of unknown persons. “Dress […] provides an efficient cue for the classification of others” (Hamid 1969, 191). Those conclusions or classifications
can be important in evaluations of and preferences for a certain politician (Enzlin 1998, 50).
The well-known experiments of Rosenberg and colleagues often held clothing
constant: a jacket and a tie (Jansen and Van Holsteyn 1998). There is a gap in the knowledge
of the influence of clothing in politics, especially in the Dutch case. In other fields of research,
such as management and advertisement, more is known about clothing as a form of
communication (see: O’Neal and Lapitsky 1991). Almost all research done on the subject
clothing and dress are American studies. A Dutch study on clothing and politics by Hendriks
and Meijerink focused on whether voters thought they could classify politicians by party on
the basis of clothing (Hendriks and Meijerink 1998, 112). Competences and traits in the eyes
of voters were not tested.
Earlier studies show that an appealing and attractive appearance of an unknown person
is favourable for his or her ‘sympathy score’. Jansen and Van Holsteyn (1998) state that when
looks of politicians influence the first impression voters have, this effect will be very unlikely
Holsteyn 1998, 107). Besides, Vielhaber and Gottheil (1965) found a relation between
characteristic evaluations of unknown persons after a very short observation (25 to 30
seconds) and subsequent independent performance evaluations of the same persons
(Vielhaber and Gottheil 1965, 916).
Research question
By means of bringing all this theory together, a research question for this master thesis is to
be posited. The changing style of political communication and change in the Dutch campaign
culture, by means of different trends, brings forth new factors to focus on in the behaviour of
voters. By looking at clothes as a form of non-verbal communication, we have to discover the
influence of clothing on voters’ view on politicians. The research question will therefore be:
Does the clothing style of politicians influence trait perceptions and voting behaviour of
Dutch voters? For answering this question, four hypotheses have been formulated.
Hypotheses
The Dutch politician Diederik Samsom wears a tie more often now that is the leader of the
Labour Party. He states that it looks better and it suits his current situation. 5 According to a
stylist, wearing a tie is very important to Samsom, because of his rebellious image of the past,
a tie makes him seem more respectable.6 “Men who frequently wear a tie were relatively most
often attributed the characteristics of ambition, politeness, and respectability” (Sakic et al.
2007, 419). Classic or conventional clothing includes a suit and a tie for men. It has been
proven that this style of clothing is associated with competence and authority, not only in
business situations (Sakic et al. 2007, 420). The study of Sakic et al. showed that more than
30% of participants found three traits to be more pronounced by men who frequently wear a
tie: ambition, politeness, and respectability (Sakic et al. 2007, 427).
H1: Wearing a tie as a politician has a larger positive effect on trait perceptions of voters
than not wearing a tie.
Reid, Lancumba and Morrow state that “style of dress had a greater effect on impressions formed by men” (Reid et al. 1997, 237). That is confirmed by Sakic et al. who state that sex of
respondents creates significant differences in attributing characteristics to other persons
5
“De mode regeert.” In: Het Financieele Dagblad (September 8, 2012).
6
(Sakic et al. 2007, 419). And also Hamid found that “dress condition had a greater determining effect on the males’ ratings of the concepts than the females” (Hamid 1969, 193).
Besides that, Hamid also found more extreme ratings on traits for persons of the opposite sex,
a “stereotyped response in that males evaluate females more often in extreme scale positions
while females rate males more often in extreme scale positions” (ibid.).
Reid, Lancumba and Morrow examined rival findings of different studies. “The aim
was to examine the influence of clothing styles on the formation of first impressions and more
specifically to observe what effects the clothing style and sex of the perceiver has on the type
of impressions formed as well as the effects of clothing style and sex of models on subjects’ perceptions” (Reid et al. 1997, 237). From this study the next two hypotheses can be
extracted. Different scholars found men to be less positive when rating other people (Reid et
al. 1997, 238; Hamid 1969, 192). “Women significantly more frequently than men attributed
successfulness, capability, physical attractiveness, and romantic characteristics to men who
frequently wear a tie” (Sakic et al. 2007, 423).
The second hypothesis will include the differences between males and females. In the
mentioned studies, it was a common finding that males and females did not attribute the same
characteristics to people, but these findings were not cohesive in the way they found the
attribution of characteristics differing. More important, it is expected that women do evaluate
men who wear a tie more positive than men who do not wear a tie on some specific traits,
according to Sakic et al. The traits successfulness, capability, physical attractiveness, and
romantic characteristics will be in this study converted into the two traits used in this study:
strong leadership and attractiveness. These two findings will be merged into one hypothesis,
namely:
H2: Women evaluate men who wear a tie more positive than men who do not wear a tie and
than men who evaluate men who wear a tie, on the traits attractiveness and strong leadership.
Another relation found in several psychological studies is the relation between clothing style
of the respondent and the clothing style of the person being evaluated. Suedfeld, Bochner and
Matas reported that “subjects gave more favourable ratings in the condition in which they
were dressed similarly to the stimulus person” (Suedfeld et al. 1971, 280). However, others
did not find this relationship when presenting female respondents with male stimulus
photographs (Reid, Lancumba and Morrow 1997, 237). The overall finding of most studies is
Lancuba and Morrow 1997, 237; Johnson, Schofield and Yurchishin 2002). But what should
be checked are the differences in evaluations of respondents’ clothing styles with gender as a
control variable.
H3: When the clothing style of the respondent and the politician to be evaluated are similar,
trait perceptions will be more positive.
Sakic et al. state that age of respondents creates significant differences in attributing
characteristics to other persons (Sakic et al. 2007, 419). “Out of 14 characteristics, significant
differences in age were determined for 8 characteristics in the sample of men and 9
characteristics in the sample of women. In general, with increasing age, there was an increase
in the proportion of men and women who on the basis of frequent wearing of a tie attributed
greater politeness, education, successfulness, physical attractiveness, romantic characteristics
and fashion consciousness” (Sakic et al. 2007, 427). The conclusion of this study was that
older people more often than younger people, regardless of sex, were more positive about
wearing a tie. Therefore, the fourth hypothesis will be formulated as follows:
H4: The older the respondent, the more positive about a formal clothing style.
Conclusion
The uncovered trend from content towards communication, has led us to study the influence
of politicians’ clothing on the voting behaviour and trait perceptions of voters. In this chapter
an overview of existing literature resulted in the formulation of a research question and the
development of four hypotheses. The following chapter will elaborate on the methodology of
Methodology
Now having the framework for this study, the way in which the study is going to be carried
out will be described. Starting off with the case selection and research design, the two-round
survey in an experimental setting will be explained. Afterwards, the questionnaires and the
logic of sampling will be introduced. As last, the way in which each hypothesis is tested will
be clarified.
Case selection
The focus of this study is on the Dutch case. This is a most likely case to investigate to get a
first impression on whether clothing has influence on the perceptions of voters or not. This is
because in the Netherlands large differences in clothing styles can be seen between members
of the Dutch Parliament, the Second Chamber. More different clothing styles are
distinguishable than for example in the American House of Representatives, where a more
formal clothing style is appropriate (Hendriks and Meijerink 1998, 112). For Dutch
respondents it is normal to see politicians in casual clothing, for respondents from some other
countries this will be may well be hard to imagine. By means of the different clothing styles
of Dutch politicians, it is especially relevant in this case to investigate the influence of
clothing styles on voters’ perceptions of leadership traits of politicians.
Besides the fact that clothing differs more in Dutch Parliament than in some other
countries, we can think of another reason to investigate the Dutch case. The Dutch multi-party
system includes a lot of different parties. Nowadays eleven political parties fill seats in the
Second Chamber.7 A Dutch voter will not likely turn from a vote for a party at one side of the
political spectrum, to a vote for a party at the other side of the political spectrum. However,
some political parties are so close to each other that sometimes a small change in for example
the party manifesto or a small misstep could lead to a vote for another party. Such a move is
not that radical for Dutch voters, compared to voters in countries with a two-party system
(Andeweg and Irwin 2009, 124). The step to switch from one party to another is much larger
for voters and therefore small changes will have less effect. The influence of clothing styles
can be seen as such a small change, which will likely have more effect on voters in a political
system common to the Netherlands, than as for example common to Britain.
7
The Netherlands are thus the perfect case to investigate the influence of clothing in
politics. If there is no influence of clothing on voting behaviour or trait evaluations of
politicians by voters to be found, this will probably also be the case in other Western
democracies. We can speak of a most likely case.
Design
The central question of this study, ‘does the clothing style of politicians influence trait
perceptions and voting behaviour of Dutch voters?’ will be answered by analysing a
self-developed dataset. It is therefore important to obtain the data in the best possible way, which
will be accomplished by different groups of respondents completing different questionnaires
which will focus on different clothing styles and leadership traits.
Studies on the electoral effects of appearance are difficult ones. The appearance of
well-known politicians is tough to separate from their overall performance, history and
political affiliation (Jansen and Van Holsteyn 1998, 87). For that reason, we will use
respondents’ trait perceptions of unknown men to measure the influence of their clothing
styles on first impressions. Mathes and Kempher state that personality traits in general exist in
the mind of the perceiver and have less to do with the person being perceived. “It appears that
people readily accept beliefs (sometimes invalid beliefs) concerning the relationship between
appearance and personality traits” (Mathes and Kempher 1976, 4). It is therefore not necessary to ask the ‘unknown’ men about their perceptions of their own leadership traits as a
starting value, for this a control group is used.
Control group
Starting off, six men will be photographed, only their faces and necklines (the visible clothes
on the picture have to be about the same for all men). The men will be selected from the
researchers’ acquaintances by means of one criterion: between 45 and 60 years old. Stolte
found significant differences in the evaluation of the same person in pictures of different ages,
it is therefore that a somewhat specific age group is selected (Stolte 1996, 308). These men
will be photographed by criteria from Rosenberg, Tran and Kahn (1991) found to be the most
positive for trait perceptions of voters of politicians (smile, pose, background, et cetera).
The reason why only men are incorporated in this study is rather simple. The question
is whether clothes make a difference in politics. When one takes a look at the Dutch
head of political parties in the 2012 parliamentary elections. The aim of this research is to
advise politicians, so the most advantageous method is by only using men. Because of
insufficient knowledge in the field of clothing styles and politics in the Dutch case, this study
can be seen as an exploratory study. The most important question is whether there is some
kind of influence on how voters seem to evaluate their leaders and therefore it is the easiest
way to explore a possible relationship. On the other hand, clothing styles of women are a lot
more diverse and, more than with men, clothes in the same sort of style can be rather
different.
A first group of approximately fifty respondents, which will rate the six pictures, is the
so-called control group. The control group evaluates the pictures on six politically relevant
leadership traits using a zero to seven, 8-point bipolar scale:
- Submissive / Dominant (will be referred to as ‘dominance’)
- Weak / Strong (will be referred to as ‘strong leadership’)
- Naive / Cunning (will be referred to as ‘cunningness’)
- Unattractive / Attractive (will be referred to as ‘attractiveness’)
- Heartless / Compassionate (will be referred to as ‘compassion’)
- Dishonest / Honest (will be referred to as ‘honesty’) (Keating, Randall and Kendrick
1999, 599).
These evaluations will be used in two ways. In the following steps of the study the mean trait
evaluations will be used as a ‘standard’ score for each of the men. And besides, the trait
evaluations of the control group will be used to select three out of six men to continue with in
the next steps of this study. The selection procedure to bring the number of men back from six
to three is based on the standard deviations of the trait evaluations of the respondents in the
control group. For each of the evaluated traits the standard deviations per stimulus person will
be calculated. The ones with the lowest standard deviation on most traits will be selected. The
reason for this selection procedure is the relatively unambiguous evaluation of the stimuli
persons with the lowest standard deviations. Respondents do evaluate these men in a similar
way. In the further course of the study this makes some analysis easier to execute. The mean
score of each of the trait evaluations of the control group will be used as a standard or basic
score for one person. Changes in this score (the mean scores for this person on each trait in
different clothing styles) will be considered as the influence of the clothing style in the
picture.
Alongside the trait evaluations, control group respondents also have to fill in some
best to have an equal proportion of males and females and respondents from a large range of
ages, so that there will be (if at all) the smallest bias possible.
Experimental groups
The three then selected men, the stimuli persons, will be photographed in three different
clothing styles (numbered as clothing style 1, 2 and 3):
1. A picture with a suit and tie – the formal clothing style;
2. A picture with jeans and a sweater – the informal clothing style;
3. A picture with a jacket, trousers and no tie – the in-between clothing style.
In this second round pictures will be evaluated by randomly selected experimental groups.
Three groups of approximately twenty-five respondents will get different sets of photos (see
also appendix 3):
- Group I
o Person A: Clothing style 1
o Person B: Clothing style 2
o Person C: Clothing style 3
- Group II
o Person A: Clothing style 2
o Person B: Clothing style 3
o Person C: Clothing style 1
- Group III
o Person A: Clothing style 3
o Person B: Clothing style 1
o Person C: Clothing style 2
Respondents have to rate the pictures on a scale from zero to seven according to different
traits they appoint to the politicians in the pictures. The traits, on which respondents in these
three groups have to rate the pictures, are the same traits as listed above for the control group.
As for the control group, the respondents of the experimental groups also have to
complete the same general questions (gender, age and highest level of education completed).
Besides that, after the evaluation of the three ‘party leaders’ they will be asked to vote for one
of the three men in the pictures. In this case there is also a possibility to vote for none of the
‘party leaders’, because the possibility exists that respondents think none of the men in the
clothing style as ‘formal’, ‘informal’ or ‘between formal and informal’. In this way, later on, we can compare clothing styles of respondents to the clothing style of the ‘politician’ they
would vote for. Subsequently follows an open-ended question. The question is: “How do you
think a party leader should be dressed?” With this extra information, some underlying factors
can be discovered. An example of the questionnaires can be found in Appendix 1.
Questionnaires
All surveys will be carried out online, via the website of thesistools.com. Results are, when
enough respondents completed the questionnaire, converted into an Excel-file. This file can
be imported into SPSS. In SPSS the data analysis will be carried out. The second round of the
research consists of three quite similar questionnaires. By distributing one link, the three
surveys will be randomly assigned to the respondents. The three Excel-files will be merged
into one SPSS data file. When importing the complete Excel file into SPSS, the open-ended
question will be excluded.
Respondents
The aim of this study is to find out whether there is a relationship between clothing style and
trait evaluations of politicians by voters. In this matter, the kind and distribution of
respondents is not that important, because if the group of respondents is big enough, existing
relationships will be uncovered. On the other hand, if there happens to be a relationship, it
would be also good to say something about the kind of relationship and whether it depends on
which group of respondents is asked, or not. To test some of the hypotheses, it is important to
have a diverse group of respondents, based on gender and age. Respondents are selected by a
snowball sample. A snowball sample is a non-probability sampling method, a form of
accidental sampling, whereby each respondent is asked to suggest other respondents (Babbie
2010, 193). Friends, family and fellow students were asked to spread the link of the online
survey to others, preferably of a different gender and age. In this way a diverse group of
respondents is achieved. Because this procedure results in samples with questionable
representativeness, it’s most often used for exploratory purposes like this study (Babbie 2010,
Testing hypotheses
In this section the analysis which will be used to test each of the hypotheses will be discussed.
Before testing the hypotheses scores which are believed to be more positive than others must
be defined. In most cases, the higher the rating, the more positive a respondent is about a
leadership trait for a stimulus person. The focus here will be on: honesty, strong leadership,
attractiveness and compassion. So more positive is a higher score on these four scales. It is
more complicated to define this for dominance and cunningness. Nevertheless, it was decided
to treat dominance and cunningness the in the same way as the other four traits. A higher
score will mean a more positive evaluation, also on these two scales.
H1: Wearing a tie as a politician has a larger positive effect on trait perceptions of voters
than not wearing a tie.
In this study, wearing a tie will be equated to a formal clothing style, which is the only
clothing style with a tie. First of all, respondents’ answers to the question which ‘party leader’
they would vote for (V4) will be checked to see whether it is for instance mostly picture 1, the
formally dressed man in every questionnaire. The next check will be the comparison between
the trait evaluations of the pictures in the second round of the survey with the pictures in the
first round of the survey (the control group). Is there a difference in trait evaluations of
respondents of both groups? Does wearing a tie increase the evaluation scores? The mean
scores of each trait of the men in formal clothing will also be compared with the mean trait
scores of the men in other clothing styles.
After this, paired tests will be carried out in SPSS for each trait and between all three
clothing styles. Statistically significant differences in trait evaluations between the three
different clothing styles together with the calculation of the effect size will enable us to see
which influence different clothing styles have on evaluation of the six leadership traits.
Hypothesis 1 will be confirmed when a formal clothing style is significantly more positive
evaluated than an informal and a between formal and informal clothing style on at least four
leadership traits.
Especially for this hypothesis, but also for others, we have to be aware of interaction
257). In this study it will imply that not the clothing style and not the head of the men in the
pictures, but the combination of the two may explain the trait evaluations.
H2: Women evaluate men who wear a tie more positive than men who do not wear a tie and
than men who evaluate men who wear a tie, on the traits attractiveness and strong leadership.
Primarily there will be checked whether there is a difference in voting behaviour (V4)
between men and women, afterwards Independent Samples T-tests will be used to discover
differences between males and females in their evaluation of clothing styles on each of the
traits. Statistically significant differences will reveal differences in evaluations of males and
females. When this is however not the case, we will also look at patterns of evaluations
between men and women: are there specific traits on which evaluations of men or women are
always higher than evaluations of respondents of the other sex? For this analysis the complete
dataset will be split according to the variable ‘gender’. For all three clothing styles women are expected to evaluate the ‘party leaders’ on the pictures more positive than men will do.
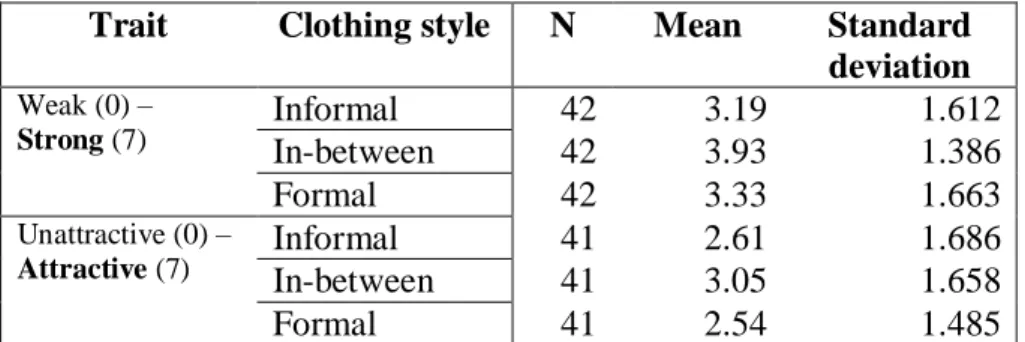
After that will be analyzed whether there is a difference in trait evaluations of women
on the different clothing styles worn by the stimuli persons, specifically on the traits
‘attractiveness’ and ‘strong leadership’. Using a one-way repeated measures ANOVA
clothing style evaluations will be compared. A one-way repeated measures ANOVA is an
analysis of variance in which the same sample of participants is measured under three
different conditions (in this case clothing styles) on the same continuous scale (Pallant 2007,
258). The non-parametric alternative for the one-way repeated measures ANOVA is the
Friedman test (Pallant 2007, 235).
H3: When the clothing style of the respondent and the politician to be evaluated are similar,
trait perceptions will be more positive.
The answers of the respondents on the question which clothing style the respondent him- or
herself is mostly wearing will be compared to the evaluations of the clothing styles on the
pictures in the questionnaire. Ratios of answers on these two questions will be compared, after
which by means of cross tabulation and the Chi-square statistic significant relations will be
sorted out. Expected is thus a comparable clothing style to be more positively evaluated than
H4: The older the respondent, the more positive about a formal clothing style.
Pearson Product-Moment correlation coefficient and Spearman’s Rank Order Correlation (the
non-parametric alternative for the Pearson correlation coefficient) statistic will be used to
discover a possible relationship between age and trait evaluations for each trait and for each
clothing style. These two statistics are used not only to calculate the strength of the
relationship between two continuous variables (age and evaluations), but also to indicate the
direction (positive or negative) of the relationship. A positive correlation indicates that as one
variable increases, so does the other. A negative correlation indicates that as one variable
increases, the other decreases (Pallant 2007, 95).
Conclusion
In this chapter there is elaborated on the methodology of this study. A control group will
evaluate six pictures of stimuli persons, men who are said to be party leaders. When three
men are selected, these men (in different clothing styles) will be evaluated on six different
leadership traits by three different randomly assigned groups of approximately 25
respondents. Afterwards, the hypotheses will be tested with statistical analyses by using
Results
The previous chapters hinged on the preparation for the analysis of the collected data. In this
chapter the results of the statistical analyses will be presented. First of all, the results of the
control group are presented. After which the preparation of the dataset will be clarified. Then,
each of the hypotheses will be tested and results will be presented. Besides that, a summary of
the answers of the respondents to the open-ended question will be given and thereafter a
conclusion of the results.
Control group
The control questionnaire, which showed the respondents pictures of six men (only their faces
and neck), was filled in by 57 respondents. However, only 53 respondents completed the
questionnaire completely. The four respondents who did not fill in the whole survey were
excluded from the results. The analysis of the control group is therefore based on evaluations
of 53 respondents, who completed the first questionnaire in which six men were evaluated.
With the 53 respondents, the range of ages is from 18 to 62 years, with a mean of
35.25 and standard deviation of 14.80. More females (36 females, 67.9%) than males (17
males, 32.1%) completed the control questionnaire. A Kolmogorov-Smirnov test shows
significance (p = .000), so this dataset violates the assumption of normality (Pallant 2007, 57).
This means that the majority of the scores do not lie around the centre of the distribution,
implying that more scores are subject to coincidence (Field 2009, 134). It is important to keep
this in mind, because the results of this group of respondents will be used in the next steps of
this study. A dataset that violates the assumption of normality provides weaker conclusions
than a dataset that with a non-significant Kolmogorov-Smirnov test, which indicates
normality (Pallant 2007, 63).
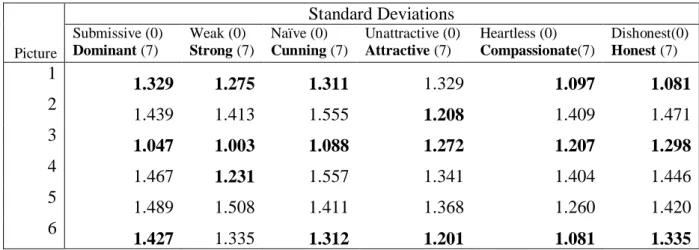
Table 1 shows the standard deviation of the mean trait evaluations of the six traits for
the six men. For each trait (columns) the three lowest standard deviations are bold. In this way
is shown that three out of six men are evaluated by respondents with the smallest standard
deviations on at least five out of six traits. Small standard deviations signify in this case
Picture
Standard Deviations Submissive (0)
Dominant (7)
Weak (0)
Strong (7)
Naïve (0)
Cunning (7)
Unattractive (0)
Attractive (7)
Heartless (0)
Compassionate(7)
Dishonest(0)
Honest (7) 1
1.329 1.275 1.311 1.329 1.097 1.081
2
1.439 1.413 1.555 1.208 1.409 1.471
3
1.047 1.003 1.088 1.272 1.207 1.298
4
1.467 1.231 1.557 1.341 1.404 1.446
5
1.489 1.508 1.411 1.368 1.260 1.420
6
1.427 1.335 1.312 1.201 1.081 1.335 Table 1. Standard deviations of trait evaluations
Values are standard deviations of the mean trait evaluations on a zero to seven, 8-point bipolar scale (N = 53). Bold values indicate the three lowest standard deviations for each trait.
For the next round of the survey the men in pictures 1, 3 and 6 are chosen to be used for
further research. For these men, at least for five out of six traits they had the lowest standard
deviation of the mean trait evaluation. With a clear image respondents seem to have of these
men, it is easier to continue the research because the mean trait evaluations will be used in the
next steps.
Testing hypotheses
The three follow-up questionnaires were filled in by 88 respondents (in total). However, 12 of
them did not complete the last questions (about gender, age and own clothing style). These
questions are important for the forthcoming analysis and therefore these scores have been
deleted. The dataset now consists of 76 respondents in total. Not every questionnaire is
completed by the same amount of respondents, because of the random selection of which
respondent has to fill in which questionnaire (questionnaire 1 – 21 respondents; questionnaire
2 – 25 respondents; questionnaire 3 – 30 respondents). However, this is not considered to be a
problem for following analyses, because the differences are not that big and results will be
weighted by the number of respondents per questionnaire. In the current dataset, no outliers
were found.
Of the respondents, 44% was male (33 respondents) and 56% female (42 respondents).
The age of the respondents is between 18 and 84, with a mean of 34.73 and a standard
Assessing normality
Many statistical analyses assume dependent variables to be normal distributed. This means
that the majority of the scores lie around the centre of the distribution and as scores start to
deviate from the centre, their frequency is decreasing (Field 2009, 134). If a dataset violates
the assumption of normality, more respondents are in the ends of the bell-shaped curve, which
means there is a greater chance of coincidence and a less strong conclusion can be drawn
from the analyses (Field 2009, 134). The assumption of normality is violated within this
dataset. The results of the Kolmogorov-Smirnov statistic, which assesses the normality of the
distribution of scores, are significant (p = .000 or p = .001 for each of the variables), which
suggests a violation of the assumption of normality (Pallant 2007, 62). Therefore,
non-parametric tests will form the basis for the data analysis. Non-non-parametric test statistics will be
compared to statistics of their parametric alternatives and whenever these indicate the same
differences or relationships, the parametric statistic will be used and presented.
Hypotheses
H1: Wearing a tie as a politician has a larger positive effect on trait perceptions of voters
than not wearing a tie.
Out of the three clothing styles used in this research, the formal clothing style (always worn
on picture one in each of the three questionnaires) is the only clothing style which includes a
tie. This clothing style will thus be used to test hypothesis 1. First of all, when looking at the
‘voting behaviour’ of the respondents, a small indication for the non-confirmation of this
hypothesis is directly uncovered. Respondents were asked which candidate they would vote
for in elections based on the shown pictures. The ‘politicians’ with a formal clothing style
were not the winning edge. One quarter of the respondents said they would vote for the
candidate in formal clothing, compared to 35.5% who would vote for the candidate with the
in-between clothing style.
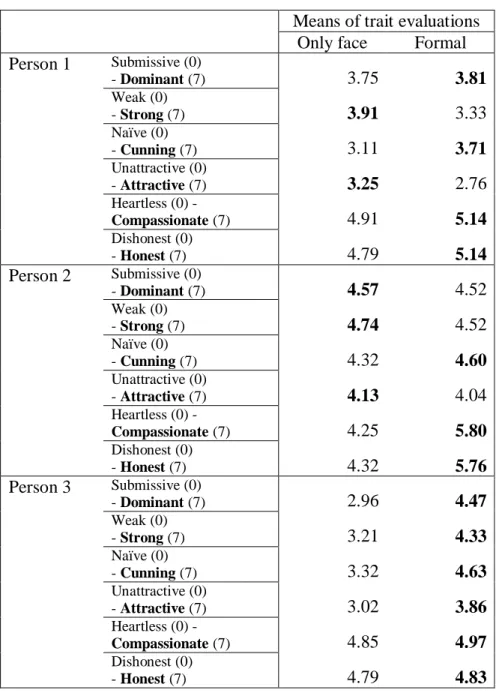
In table 2 the differences in mean trait evaluations of the pictures of the three chosen
men of the first round of the survey and the mean trait evaluations of these men wearing a suit
and a tie, the formal clothing style, are shown. Both trait evaluations are based on a zero to
seven-scale. The evaluations will be compared for each person and for each of the individual
dimensions of leadership and some leaders would want to strengthen one or more specific
leadership traits covered in this study.
Means of trait evaluations
Only face Formal
Person 1 Submissive (0)
- Dominant (7) 3.75 3.81
Weak (0)
- Strong (7) 3.91 3.33
Naïve (0)
- Cunning (7) 3.11 3.71
Unattractive (0)
- Attractive (7) 3.25 2.76
Heartless (0) -
Compassionate (7) 4.91 5.14
Dishonest (0)
- Honest (7) 4.79 5.14
Person 2 Submissive (0)
- Dominant (7) 4.57 4.52
Weak (0)
- Strong (7) 4.74 4.52
Naïve (0)
- Cunning (7) 4.32 4.60
Unattractive (0)
- Attractive (7) 4.13 4.04
Heartless (0) -
Compassionate (7) 4.25 5.80
Dishonest (0)
- Honest (7) 4.32 5.76
Person 3 Submissive (0)
- Dominant (7) 2.96 4.47
Weak (0)
- Strong (7) 3.21 4.33
Naïve (0)
- Cunning (7) 3.32 4.63
Unattractive (0)
- Attractive (7) 3.02 3.86
Heartless (0) -
Compassionate (7) 4.85 4.97
Dishonest (0)
- Honest (7) 4.79 4.83
Table 2. Means of trait evaluations on wearing a tie
Values are mean trait evaluations for three men in two different pictures on a zero to seven, 8-point bipolar scale (only face: N = 53, formal clothing style: N = 76). Bold values indicate the highest evaluation for each person, for each trait.
For the traits ‘cunningness’, ‘compassion’ and ‘honesty’ the evaluation scores increase in all
cases by showing the men in a formal clothing style and for person 1 and 3 also in the case of
‘dominance’. Person 3 is in all cases higher evaluated when wearing a suit and a tie, than
Looking at table 2, wearing a tie has indeed a positive effect on trait evaluations.
Evaluations of clothing style one will now be compared to evaluations of clothing styles two
(informal clothing style) and three (in-between clothing style). Will the positive effect still
hold?
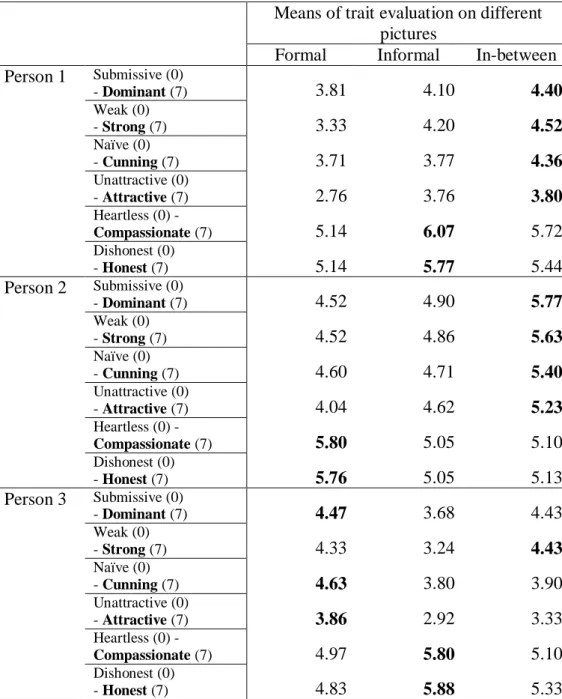
Mean trait evaluations are shown in table 3. What can be seen from a first glance at
table 3 is the fact that in just a very few cases the formal clothing style is highest evaluated.
The highest scores seem to fall in the category of the in-between clothing style. When looking
closer, the thing standing out is that only the leadership trait ‘strong leadership’ is in all three
cases highest evaluated with one clothing style, namely the in-between clothing style. So,
when one wants to be viewed as a strong leader, a clothing style which is between a formal
and informal clothing style seems to be the most appropriate. Person 1 and 3 seem to be most
compassionate and honest (traits 5 and 6) in the informal clothing style. However, person 2
seems most compassionate and honest in a formal clothing style, which is strange. These two
clothing styles are most different from each other. This may indicate that faces are more
important for voters in their evaluations of these traits.
As shown before, the data does not live up to the assumption of normality, thus
non-parametric tests have to be used. However, the results of paired samples t-tests are
comparable to results of the Wilcoxon Signed Rank Test (the non-parametric alternative for a
paired samples t-test). Therefore t-test results will be shown, because parametric tests are (in
this case) more useful.
For each independent trait three pairs will be tested. Pair one is formal clothing style
(1) and informal clothing style (2), pair two is formal clothing style and in-between clothing
style (3) and pair three is informal clothing style and in-between clothing style. What is
expected is a significant difference for every trait in pair one, the formal and informal clothing
styles compared, because these two are most different. Also expected are rising scores from
clothing style 2, to clothing style 3, to clothing style 1, especially for strong leadership,
compassion, attractiveness and honesty.
What we see is a significant difference between person 1 and 3 and between person 2
and 3, in which person 3 (the man with an in-between clothing style) gets a significantly
higher evaluation on dominance. A paired-samples t-test was conducted to evaluate the
impact of wearing a tie on voters’ evaluations of leadership traits, in this case dominance.
There was a statistically significant increase in dominance-scores for the clothing style
‘between formal and informal’ (M = 3.95, SD = 1.413) to wearing a formal clothing style (M