Salman Khan
RYERSON UNIVERSITY Toronto, Canada
DO COMPANIES INVESTING IN
BIG DATA ANALYTICS REALIZE A
RETURN ON INVESTMENT?
Student Name(s):
Salman Khan
Student Number(s):
052476231
Course Title:
MRP SS2016
Table of Content
Executive Summary
1. Introduction
2. Literature Review
2.1 Research Question identified
2.2 Additional benefits besides financial ROI? 2.3Redefining the Research Question
2.4 Is Big Data Analytics Financially Profitable? 2.5 Benefits of Big Data Analytics
2.6 Analysis of benefits across multiple Survey Reports
3. Primary research
3.1 Methodology
4. Survey Analysis and Results
4.1Descriptive Analysis
4.2 Key Learnings for Analytics Managers
5. Conclusion
6. Appendix
Executive Summary
1.
Introduction
Data is the new oil. The last century witnessed oil putting the economy on wheels. Data-driven smart economy has grown much faster than the economic growth of the yester years. Big data brings big opportunities and the ability to achieve exceptional growth rates for firms and economies. “Big Data” initially emerged as a buzzword to describe data sets that were too large and complex to be managed using traditional database systems. With time, the use of the term evolved to not just describe large and complex data sets but also refer to the emerging technologies used to collect, store and manage data. The ability to store and manage massive data sets sparked an interest in tools and techniques necessary to extracts insights giving popularity to the term “Analytics”.
2.
Literature Review
2.1.
Research Question
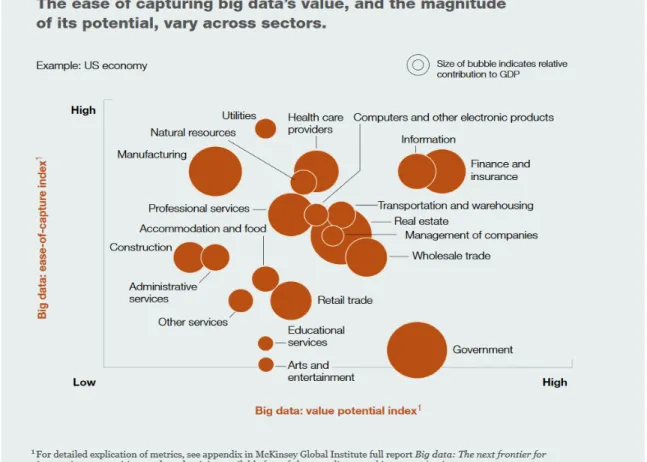
Research of academic journals indicates that there is a lack of academic papers studying the return on investment on Big Data Analytics investment (referred to as “analytics” in rest of paper for brevity). This is not surprising given that analytics is a relatively new and evolving discipline with many organizations still experimenting with the methodology needed to measure ROI. Moreover, due to the novelty of the analytics domain, limited empirical data is available making it difficult to measure. A 2010 survey by the International Data Corporation (IDC) found that 33% of the organizations were unclear on how to determine the returns on their business analytics projects. The survey also found that certain sectors such as education, and manufacturing had a higher rate of uncertainty in measuring ROI than the finance or investment sectors (kdnuggets, 2010). This is not surprising given that the banking industry is one of the early adopters of analytics in its quest to prevent fraud and conceive new financial products and services (See Figure 1.)
advantage from investments in Analytics is directly hindered by its inability to effectively measure the expected benefits.
Few research studies have been authored to determine whether analytics solutions are generating a positive return on investment. One such found that that for every dollar an organization invests in an analytics solution, the return was $13.01 (Nucleus, 2014). This was an increase of 22% when compared to a similar study done in 2011 by the same company (Nucleus, 2014). Some studies do not delve into how ROI is measured and evaluated but focus on the important activities within organization that are positively impacted and contribute to the overall success of the organization. Most of these studies have been published by technology research companies like Gartner, IDC or analytics solutions providers like IBM, Deloitte and Accenture.
2.2.
Additional benefits besides financial ROI?
In order to fully understand and measure the ROI of analytics, organizations need to identify the activities within an organization that are directly affected by the investment. The focus should not just be on the financial returns of the analytics investment; instead the benefits should be viewed through a holistic lens to grasp how different functions of the organization are affected by analytics. Some studies indicate that senior management and executives are looking at analytics investment as more than just an attempt to reduce costs or increase revenue (Davenport & Dyche, 2013). In fact, executives in companies that were early-adopters of Analytics were more interested in either finding an efficient alternative for current business functions or finding new business capabilities.
that the major benefit of analytics was that it played a key role in better decision making while only 9% identified better financial performance (Deloitte Analytics, 2013). A study by Canada’s Big Data Consortium in 2015 (Ryerson, 2015) identified Exceptional Customer Insights, Improved Productivity, Better Decision-Making and Product and Service Innovation as some of the promises of an analytics investment (Appendix 2). Another study completed in 2015 by Business Application Research Center, surveyed over 500 people from Germany, Australia, Switzerland and North America across several industries retail (8%), IT (16%), manufacturing (14%), consulting (13%) and found that only 47 % of respondents identified cost reduction (Appendix 3) as a benefit of their Analytics investment (BARC, 2015).
Figure 1. Ease of capturing big data’s value, and the magnitude of its potential,
vary across sectors
Moreover, different functions within an enterprise use analytics to different degrees and for different purposes and subsequently derive benefits that are relevant to their core business. The study (BARC, 2015) found that although analytics was used in almost all departments in the organization, it was most heavily utilized by marketing and sales (Appendix 4).
in analytics is able to innovate and replace manual quality control checks with an automated one. This reduces risk of releasing a below par product into the market but also reduces employee resources need to perform manual quality control checks. Indirectly, the company is realizing an additional benefit of freeing up employee time for other tasks.
2.3.
Redefining the Research Question
The take-away from the above literature review is that organizations do not necessarily perceive the benefits of analytics from a financial perspective. Firms can realize many non-financial benefits by investing in analytics and there appears to be no standard approach to measure the return on investment. Within this context, my initial research question of whether companies are realizing ROI in analytic should be followed up with a second question:
1. Are companies realizing ROI in Big Data Analytics?
2. What are the key benefits of Big Data Analytics?
2.4.
Are companies realizing ROI in Big Data Analytics?
With the proliferation of smart phones, tablets and other network based digital devices, the telecommunication industry creates massive amounts of data on a regular basis. However, many players in the industry have been unable to take advantage of the data deluge and register a profit. A 2016 study by McKinsey (Bughin, 2016) found that only a handful of companies managed incremental profit higher than 10 percent. Most companies were preoccupied with fixing low quality data issues or finding appropriate talent and thus unable to boost the bottom line.
Figure 2. Impact of big data on company profit
the lurch for ROI. Another study about Big Data projects in American and European companies found only 27 percent of projects were actually profitable while 12 percent were in an inconclusive state at the time (Capgemini & Informatica, 2016). Data governance and engagement between technology and business were identified as critical factors leading to profitability. Collectively, the studies found that the number of participants who claimed positive ROI range from 2% to 66%. Considering the buzz surrounding big data and the lucrative investments in this field, the ROI is quite low. At least one analytics expert predicted this; in 2006, Thomas Davenport (Davenport, 2006) predicted that it will take years before companies can reap the benefits of their analytics investments. There could be several reasons for why ROI is not positive. Firstly, many companies are bogged down by the implementation of the underlying infrastructure to install, deploy and maintain software tools. Moreover, organizations that are not data savvy have to quickly learn how to capture, store and clean data prior to extracting insights. This is a challenging and error prone task that will require several iterations to master. Secondly, businesses are failing to align their business models with their data assets (Nicolaus Henke, Ari Libarikian, and Bill Wiseman , 2016). The tendency to treat big data as a technology investment as opposed to an organizational transformation is preventing decision makers from seeing the big picture where data assets take center-stage.
2.5.
Benefits of Big Data Analytics
resources need to perform manual quality control checks. Indirectly, the company is realizing an additional benefit of freeing up employee time for other tasks. Despite the interdependencies within an organization, we can categorize the major benefits of analytics as follows:
1. Customer Insights lead to Customer Satisfaction and more Sales
2. New product or services create new revenue streams
3. Data Driven Mindset resulting in faster decision making
4. Support innovation
5. Reduce operational costs
6. Improved productivity and performance
For each benefit, case studies from varying companies and technology research firms are highlighted to demonstrate real world values that are unlocked by analytics.
2.5.1.
Customer Insights lead to Customer Satisfaction and Sales
value but found it challenging as data was fragmented across multiple databases and the entire process of mining this data and creating a promotion took a staggering 8 weeks. This meant they were always behind the curve as 8-week-old data is not as valuable. To solve this problem, Sears invested in a Hadoop cluster to store incoming real-time data as well as historical data and used analytics tools to mine the data on the cluster itself. Not only did the time to create a promotion drop from 8 weeks to just 1 week but this also generated previously unknown insights for the marketing team and resulted in higher quality and targeted promotions. (McAfee et al., 2012). An Accenture survey found that 70% of firms are using Analytics solutions in customer centric areas (Appendix 6) to acquire new customers and to retain existing ones (Accenture, 2013). About 60% of firms were using it to improve the customer experience with 52% reporting strong returns on this approach.
2.5.2.
New product or services create new revenue streams
and decided to diversity by setting up a unit that sells data used for economic forecasting. Another example from the health industry where entrepreneurs have realized the value of consolidating clinical, financial, health and behavioural data to create a novel platform that can predict patient health issues for their clients and in turn reduce costs (Brown, Chui & Manyika, 2011). A media company is using Datameer’s analytics platform to collect user behavioural data on mobile application and make recommendations on how to increase ad responses (Datanami, 2014). The above examples signal a significant tread towards collecting and consolidating valuable data and turning it into a value creator both internally and externally. This attitude resonates in a Deloitte survey (where 44% of participants surveyed were willing to share organization data with outsiders in return for actionable insights (Deloitte, 2013).
2.5.3.
Analytics fosters a Data Driven Mindset & faster Decision-Making
2015). An even larger number, 51% felt that adopting a data driven strategy was a difficult task that was necessary for success (Forbes & Teradata, 2015). Decision makers still heavily rely on personal experience and intuition, based on a survey that found that 32% of respondents rated themselves a 3 on a 5-point composite scale that measured how data driven their company was (McAfee et al., 2012). Despite this finding, there is still a positive outlook for companies that identify as being data driven; the top 30% of these companies were found to be 6% more profitable and 5% more productive on average, in their respective industries (McAfee et al., 2012). This is further substantiated by another survey of 179 publicly traded companies that found that those that adhered to data driven decision-making were found to 5 - 6% more productive (Brynjolfsson, et.al, 2011). To illustrate with an example, Westfield Insurance employees were facing low productivity due to the unavailability of reliable and time-sensitive and thus were unable to make timely decisions. This prompted senior leaders to look to IBM to provide a solution which involved the deployment of an enterprise data Analytics and data warehouse implementation which directly addressed this problem by providing a platform where client facing employees were able to access accurate and real-time information to satisfactorily answer client questions and close deals quickly (Balboni et al, 2013).
2.5.4.
Support innovation
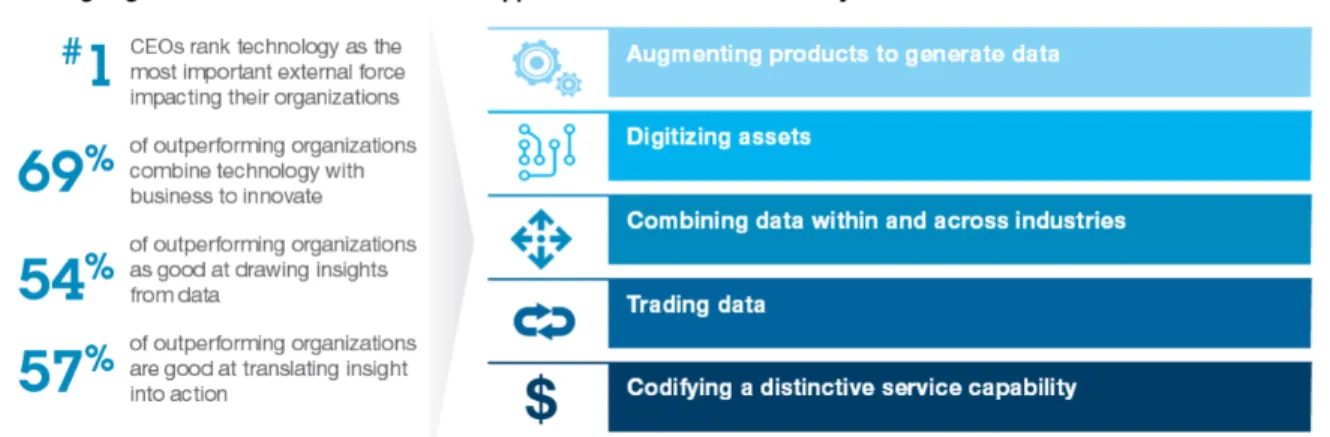
the advent of Big Data, scholars are advocating a fourth approach which asks how organizations can create value for their clients using data and analytics tools (Parmar et al., 2014). Figure 2 below shows the findings from an IBM study which lists different ways organizations identify innovation opportunities by exploiting data within their analytics platforms (Balboni et al, 2013). The same study found that 75% of the leading organizations, who outperformed in their industries with the application of analytics solutions, identified innovation and revenue generation as major sources of value creation.
Figure 3 Different ways organizations identify innovation opportunities from Analytics framework
Digitizing assets has led to an explosion in availability of music, videos and books to the masses and spawned new business models such as TV streaming services (Netflix), music (iTunes) and audio books readers (Kobo). This phenomenon is now spreading to physical assets as 3D printing takes off. For example, a retail store in South Korea has created virtual stores around the city that allow individuals to scan items they would like delivered to their home in 2 hours (Parmar, Cohn, Marshall, 2014).
Combining data within and across industries has empowered businesses to discover new insights and create connectivity between previously disconnected devices or systems. Working with IBM’s Smarter Cities division, the city of Bolzano, in Italy, developed a network of sensors in the home of retired residents who account for 25% of the city’s population. The sensors monitor water usage, temperate and CO2 level among other things to ensure that any abnormal patterns trigger a warning to relatives or health providers. This improved quality of life and decreased social and health services costs by almost 30%. (Parmar et al., 2014).
Trading Data refers to companies exchanging internal data perceived as valuable by outsiders. This practice has resulted in partnerships between organizations that previously would not be considered traditional partners. For example, TomTom partnered with Vodafone to identify users who are driving and used this insight to provide useful traffic information to make trips shorter. (Parmar et al., 2014).
executives decided to externalize it. Citigroup, in 2011, productized its internal model used to locate inefficient transactions within its financial system. (Parmar et al., 2014).
2.5.5.
Reduce Operational Costs
2.5.6.
Improved Productivity and Performance
cylinder-heads (IBM Case Studies, 2014). Another firm, Qualcomm, found that due to the large number of data warehouses, performance management was becoming a problem as the IT staff was spending more and more time tuning the data warehouses to keep them active. Qualcomm deployed IBM’s PureData System for Analytics in combination with Cognos BI to improve performance of their data warehouses. For example, some queries are now processing 600 times faster. Reports that would take over 30 hours to complete now execute in 10 minutes. Secondary benefits included reducing infrastructures costs and lowering time to meet changes made by the business from months down to days. (IBM Case Studies, 2013).
2.6.
Analysis of benefits across multiple Survey Reports
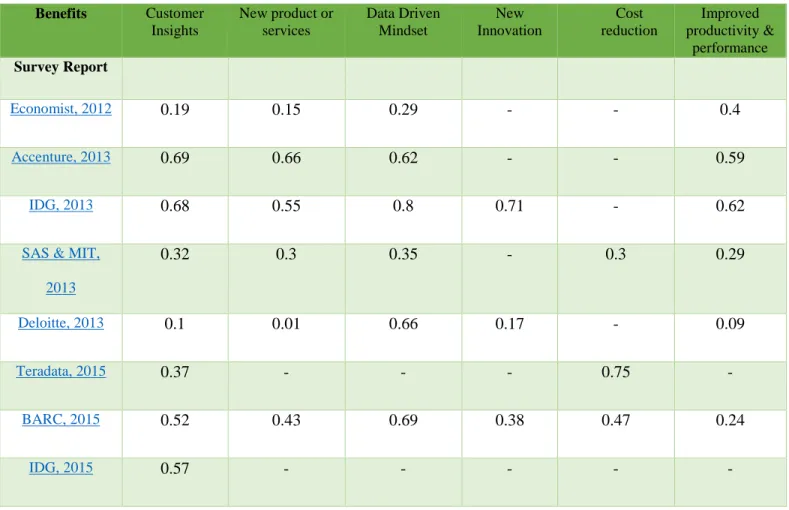
In the previous section, each of the six identified benefits were reviewed in depth with real world examples. In this section, 8 survey findings were reviewed to corroborate that these six benefits are valid measures of benefits for firms with analytics investments followed by analysis of the collected data.
values do not necessarily mean the studies did not measure this number. See Appendices 9 to 14 for the survey reports used to populate the Table 1.
2.6.1.
Findings
Since the surveys in the above reports were conducted with different numbers of participants, we cannot compute an average for comparison. However, we can derive some findings from the above table data and validate that the research question is pertinent.
2.6.2.
Cost reduction and innovation are least commonly reported benefits
The information in the table confirms the theory that companies are not focusing just on reducing costs with their analytics investment. . Cost reduction, along with innovation was the surprisingly
Benefits Customer Insights
New product or services Data Driven Mindset New Innovation Cost reduction Improved productivity & performance Survey Report
Economist, 2012 0.19 0.15 0.29 - - 0.4
Accenture, 2013 0.69 0.66 0.62 - - 0.59
IDG, 2013 0.68 0.55 0.8 0.71 - 0.62
SAS & MIT,
2013
0.32 0.3 0.35 - 0.3 0.29
Deloitte, 2013 0.1 0.01 0.66 0.17 - 0.09
Teradata, 2015 0.37 - - - 0.75 -
BARC, 2015 0.52 0.43 0.69 0.38 0.47 0.24
IDG, 2015 0.57 - - - - -
the least commonly reported benefit and supports the argument made earlier in the paper that the benefits attained by an analytics investment should be analyzed through a holistic lens and not just through a strictly financial perspective.
2.6.3.
Customer Insights is a reported benefit in every survey
Customer insights is a popular benefit probably because many of the companies surveyed were e-commerce retailers and analytics has become crucial in the e-e-commerce space where competition is cut throat. Delivering a positive customer experience with the use of analytics is imperative in attracting shoppers.
2.6.4.
Data Driven Mindset is identified as the major benefit
The entire premise of mining Big Data with Analytics is built around extracting valuable insight to from otherwise useless data to make faster and better informed decision. Companies that participated in the surveys appear to have understood this benefit of analytics well as this was the highest reported benefit.
2.6.5.
75% of the surveys measured at least 4 of the 6 benefits
2.6.6.
No major trends seen in surveys spanning from 2012 to 2015
3.
Primary Research
The objectives of this research project is to combine the findings of the literature review and survey analysis to derive conclusions on whether the ROI of an analytics investment is positive and what benefits are achieved through analytics. The analysis looks to identify benefits and challenges faced by organizations and whether any pattern emerges on how ROI is affected. Participants are queried on whether their organization uses a formal methodology for measuring ROI and whether new metrics were created for measuring progress of analytics projects. The survey questions that were designed to capture the data can be found in Appendix 15.
3.1 Methodology
To develop a better understanding of the research questions identified above, an online survey was designed. Details on the methodology used are to follow below.
Participants
The target audience of the research were analytics professionals who were working in the field of big data analytics. Participants were requested to provide job title, industry and organizational size but no personal information was collected.
Format
Scope
The literature review was the basis of the questions posed in the survey. The survey scope included the following components:
• Definition of Big Data Analytics and how it is applied in the organization • Big Data Analytics budget
• Benefits of Big Data Analytics • Challenges of Big Data Analytics
• Methodology used to measure ROI of Big Data Analytics
Before beginning the primary survey inquiries, three questions about the professional background of the participant were posed to ensure the respondent had an analytics background. To determine whether the participant was in a leadership role, a question about the current position was asked and this was followed up with an inquiry about the affiliated industry.
Participants were polled on their interpretation of analytics and on the number projects in progress to get a sense of their experience. The importance of analytics relative to other priorities was also probed followed by a question on what the analytics investment hoped to achieve. The second sections of the survey was to determine the budget assigned to analytics activities and how it was distributed. The next section was designed to solicit details on the benefits of analytics as well as whether analytics met the initial expectations of the organization. Participants were asked to relatively rank the benefits based on a given list. This section concluded with asking the participant to report on the financial ROI of analytics and on the overall success of analytics.
4.
Survey Analysis and Results
4.1.
Descriptive Analysis
Although the sample size is not very large, the analysis offers interesting insights about how the ROI relates to organizational activities, objectives and challenges. The analysis focuses on looking for relationships that affect the ROI. In essence, ROI is treated as a dependent variable and the data analysis is used to paint a picture of what activities can influence ROI. The analysis is not necessarily looking for causality, which is unlikely as the sample is not very large, but endeavours to provide managers with a framework with which to reflect about ROI in analytics.
Number of Participants
The survey was online from June 20th until August 12th . A total of 33 professionals from varying industries participated. Out of the 33 participants, 16 were employed at the senior management level or higher and 10 were in management positions.
2 5 1 10 8 4 3 1 1 0 2 4 6 8 10 12
CTO Director Intern Manager Senior
Manager Senior Staff Staff PresidentVice Team Lead Q1. What is your current position in the organization? (N=33)
Organizational Size and Industry
Organizational size was largely biased towards enterprises with greater than 1000 employees or small companies with less than 250 employees (Figure XY2). The industry type was heavily skewed with Technology, Finance and Professional Services having a presence of 66%.
Figure 5. Distribution of Participant Organization Size Financial ROI Breakdown
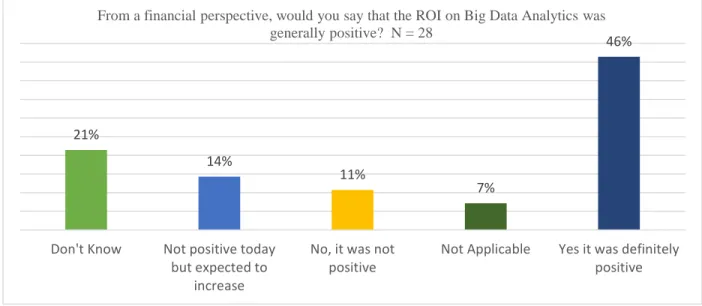
The distribution of the financial ROI question (Figure X) shows that only 46% of the participants stated ROI was positive while 24% believed it was negative. When compared with studies reviewed in the literature review, the ROI falls in the middle range.
16
1 3 4
7
Q2. In terms of size, how would you classify your organization?
Enterprise (> 1000 employees)
Large (> 500 employees)
Medium (< 500)
Micro (< 10)
Figure 6. Distribution of Participant responses on whether ROI was Positive
Success vs Financial ROI
Participants were asked to rate how successful they believed the analytics initiatives was. Each respondent that stated that the initiative was either extremely or very successful also reported that financial ROI was positive Participants who found the initiative moderately successful reported a financial ROI or expected it to increase in the near term. Managers, as is the business norm, think of ROI strictly in financial terms.
21%
14%
11%
7%
46%
Don't Know Not positive today but expected to
increase
No, it was not
positive Not Applicable Yes it was definitelypositive From a financial perspective, would you say that the ROI on Big Data Analytics was
Figure 7. Success of project against ROI
ROI vs Analytics Importance to Organization
Each participant who identified analytics as being extremely important relative to other projects with the organization, also reported that ROI was positive. Out of 11 participants who identified that analytics was less than extremely important, 6 reported that ROI was not positive. This finding resonates with the literature review where researchers noted a disconnect between technology and business strategy was a major reason for why ROI was not positive (ZS Associates, 2016) . Surely, if a project is considered extremely important relative to others, chances are leadership will support the alignment with business strategy. Projects that do not garner significant importance have higher tendency to run into problems due to lack of support from senior leadership.
ROI vs Organizational Objectives for Analytics
Participants were polled on the importance of commonly cited objectives for investing in analytics and asked to rate each benefit on a scale of 1 – 5 where 1 was Extremely Important and 5 was
3 2 1 2 6 2 1 0 1 2 3 4 5 6 7
Extremely successful Very successful Moderately
successful Slightly successful Not successful at all
Success vs Financial ROI
Not important At All. All objectives except for streaming data are well represented under the Extremely Important category.
Figure 8.Relative Importance of Organizational Objectives
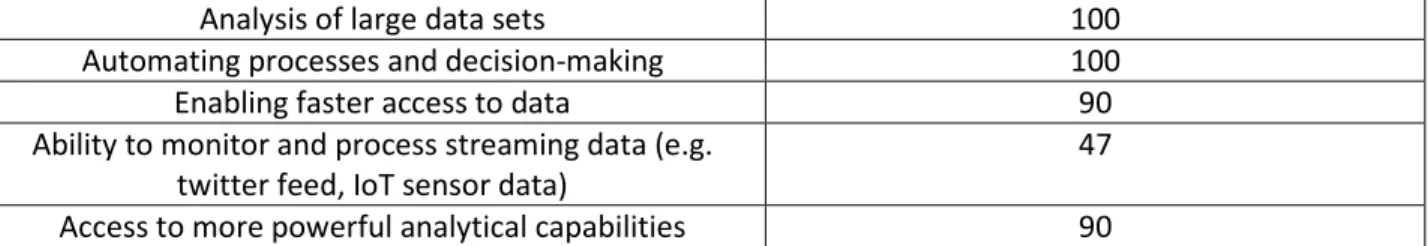
Participants associated several goals to their analytics initiative with data analysis and powerful analytics being the most popular ones. To dig deeper, for each objective, participants reporting positive ROI when placing the objective in top 3 were grouped together to determine the relationship of the group with ROI. The percentage of participants who report a positive ROI when an objective is ranked in top 3 (of importance) is consistently over 90% with the exception of those looking to monitor and process streaming data. Besides validating the survey collection and design, this finding is a reminder to managers that a goal oriented approach when adopting analytics, or any other technology or technique is key to success.
Objective % participants reporting positive ROI when
identifying objective in top 3
Building predictive models to improve forecasting 90 Combining heterogeneous data sets 90
12 7 2 1 0 10 6 5 1 1 8 8 1 3 2 10 7 2 3 1 10 5 6 1 1 13 6 2 1 1 5 4 7 3 3 0 2 4 6 8 10 12 14
1 (Extremely Important) 2 (Very Important) 3 (Moderately
Important) 4 (Slightly Important) 5 (Not Important At All)
Relative Importance of Objectives
Data Analysis Predictive Models Combining Data
Faster Data Access Automated Process Decision Powerful Analytics
Analysis of large data sets 100 Automating processes and decision-making 100 Enabling faster access to data 90 Ability to monitor and process streaming data (e.g.
twitter feed, IoT sensor data) 47 Access to more powerful analytical capabilities 90
Table 2. Objective when ranked in top 3 against ROI
ROI and Benefits of Analytics
Figure 9. Relative Importance of Benefits on a Scale of 1 to 6
Slicing the data further revealed a total of 11 participants chose faster and accurate decision making as their top three benefits. Nine of these reported a positive ROI (80%). A stark contrast was observed when analyzing the number of participants who placed this benefit at the lowest levels of importance; only two out of six (33%) registered a positive ROI. Participants who did not know the ROI were not considered in this analysis.
Analysis of the 11 cases that placed increase in insights within the top three benefits revealed that 6 (55%) did not report a positive ROI while 5 did (45%). The performance of this set of participants is much lower than those who attached importance to faster and accurate decision making. This leads us to question whether there is a segment of managers who are pursuing analytics with a flawed understanding of its intended goal of supporting data-driven decision making. Are some
2 2 2 3 2 2 2 2 2 2 3 1 6 3 2 2 2 0 2 2 4 1 1 5 1 1 4 4 2 2 4 5 2 1 3 2
0 2 4 6 8 10 12 14 16 18
1 (Most Important) 2 3 4 5 6 (Least Important)
Relative Importance of Analytics Benefits
Cost Reduction Increase in Innovation Increase in Insight
managers overlooking the fundamental role of analytics and jumping excitedly into buzz generating analytics tools?
Cost reduction features low on the most importance scale with only 2 (8%) participants considering it extremely important. This is in line with the literature review which found that only 9% of participants identified better financial performance as the major benefit of analytics (Deloitte Analytics, 2013).
Business Challenges affecting ROI
Data governance and lack of talent were the most common and highest severity challenges identified by participants. A study by Canada’s Big Data Consortium in 2015 (Ryerson, 2015) agrees with the finding that talent gap is an issue. In fact, the study conducted in partnership with Ryerson found that the gap is estimated to be between 10,500 and 19,000 professionals. Data governance being a challenge is supported by a study in late 2015 that found that organizations are struggling with data governance practices (Forrester Consulting, 2015).
Figure 10. Ranking challenges against each other 1 7 4 9 6 2 6 5 7 5 5 2
4 5 4 5
0 1 2 3 4 5 6 7 8 9 10
Securing Funding Lack of Expertise Infrastructure Data Governance
Severity of Challenges
4.2.
Key Learnings for Analytics Managers
One of the major hurdles businesses face today is the lack of leaders who can navigate a data driven path to success. Experts have identified that there is a lack of managers today who truly understand how data can be used to create value (Davenport, 5 Essential Principles for Understanding Analytics, 2015). The analysis above contains information valuable for understanding activities linked to an analytics initiative. Below, we discuss some of the key learnings that can be derived from analysis to benefit analytics managers and assist them in meeting their analytics goals by with understanding and influencing ROI.
Financial ROI of Analytics Projects
take numbers published in research studies a grain of salt and continue to strive for increasing financial ROI.
What about Non-Financial ROI?
The study found that only 2 out of 13 participants (15%) who selected cost reduction as a benefit ranked it as being most importance. This is supported in the literature review that finds senior management and executives are looking at analytics investment as more than just an attempt to reduce costs or increase revenue. Senior leaders in early adopter analytics firms are more interested in either finding an efficient alternative for current business functions or finding new business capabilities (Davenport & Dyche, 2013).
This raises the question whether managers should also consider non-financial ROI and not just concern themselves with reducing costs or increasing revenue which relate directly to profits? How do we measure intangible benefits such as increasing customer satisfaction or automation of a business process which previously required manual intervention? Can these be easily quantified in dollars amounts so they can be incorporated into financial calculations? Do customized metrics need to be created to measure them? These are questions analytics managers must deliberate to get a deep understanding of the overall ROI. Managers are advised to avoid fixating on financial ROI and encouraged to gauge the ROI of analytics through a holistic lens that looks beyond dollar value.
Boost the Organizational Importance of your Analytics Initiative
to analytics activities. Surely, if a project is considered extremely important relative to others, chances are leadership team will strive align the analytics project with business strategy. Managers who cannot impel the importance of their analytics initiative will have low support from senior management and a lower tendency to meet their financial goals.
Setting Goals Almost Always Drives Success
The survey found defining objectives before implementing analytics solutions was effective. The percentage of participants who reported a positive ROI when an objective was identified within top three on the importance scale is consistently over 90% with the exception of those looking to monitor and process streaming data. This finding is a reminder to managers that defining goals before embarking on any project is vital for success.
Focus on the Fundamentals - Better Decision Making
point, managers can make better decisions that subsequently derive additional benefits such as increase in productivity or innovation.
Getting Support for Business Challenges
Lack of talent and data governance issues pose the biggest hurdle for analytics managers as they strive for financial success. Managers can use this data to build a case when approaching senior leadership for additional resources and argue that the probability of a positive financial ROI is low unless the challenges are addressed
Encourage Simultaneous Analytics Projects
Larger number of simultaneous projects means higher the potential for positive ROI. At least that is what the survey results found. In this case the number of projects threshold was 5. We can speculate about the reasons for why ROI was positive 8 out of 9 times for those organizations that had more than 5 concurrent analytics projects. Firstly, if an organization has multiple analytics projects going on, there is the opportunity for managers to discuss best practices, pitfalls and collaborate to achieve success. Alternatively, the first project may have been so successful that the leadership was quick to approve additional projects. Secondly, and more importantly, to be able to run multiple projects at the same time, there must be strong leadership backing for these initiatives to have approval in the first place. Practice does lead to perfection, or at least very close to it. Managers should promote additional analytics projects within the organization.
Methodology for Measuring ROI
from being extremely satisfied with their current methodology. Managers can take this as a lesson to review the ROI measuring methodology for improvement.
Are Metrics Necessary?
5.
Conclusion
Big data analytics is a burgeoning field that is still in its infancy. This is evident by the literature review that found more than 50% of companies that are investing are still unprofitable. Over time, as companies learn by iteratively creating, managing and mining their data assets, the return on investment will begin to increase. Besides learning by doing, another essential ingredient for ensuring analytics a successful investment is to find managers who understand the business through a data centric mindset. This paper combined the literature review and survey results to derive insights that can benefit big data analytics managers.
Appendix 1
Appendix 2
Appendix 3
Appendix 4
Appendix 5
Appendix 6
Appendix 7
Appendix 8
Appendix 9 – Survey Report used to create Table 1
Accenture Analytics
URL:
https://www.accenture.com/ca-en/~/media/Accenture/Conversion- Assets/DotCom/Documents/Global/PDF/Technology_6/Accenture-Analytics-In-Action-Survey.pdf
Appendix 10 – Survey Report used to create Table 1
IDG Research, 2013
URL:
http://www.informationweek.com/big-data/big-data-analytics/big-data-roi-still-tough-to-measure/d/d-id/1110150
Appendix 11 – Survey Report used to create Table 1
Deloitte, 2013
URL:
http://www2.deloitte.com/content/dam/Deloitte/global/Documents/Deloitte-Analytics/dttl-analytics-analytics-advantage-report-061913.pdf
Appendix 12 – Survey Report used to create Table 1
Business Application Research Center, 2015
URL:
http://barc-research.com/research/big-data-use-cases-2015/
Appendix 13 – Survey Report used to create Table 1
MIT Sloan
URL:
https://www.sas.com/content/dam/SAS/en_us/doc/whitepaper2/reimagining-possible-data-analytics-106272.pdf
Appendix 14 – Survey Report used to create Table 1
Economist Intelligent Unit
URL:
http://www.economistinsights.com/sites/default/files/downloads/EIU_SAS_BigData_4.pdf
Appendix 15 – Survey Questions
1. Please indicate that you have read the consent form and agree to proceed with the survey.
Yes, I have read the consent form and agree to participate in this survey No, I would not like to proceed with the survey
2. What is your current position in the organization?
CIO CTO CEO CFO
Other C-Level President Vice President Director
Senior Manager Manager
Team Lead Senior Staff Staff
Other (please specify)
3. In terms of size, how would you classify your organization?
Micro (< 10) Small (< 250) Medium (< 500)
4. Which industry does your organization belong to?
Arts and Entertainment Education
Energy & Utilities Finance
Government Healthcare Non-profit
Oil & Gas, Mining Professional Services Real Estate Retail Technology Telecommunication Transportation Manufacturing
Other (please specify)
5. What does Big Data Analytics mean to you? Please check all the apply. If your desirable answer is not listed, please add it in the Other section.
Data Management - Ensure data is of reliable quality
Hadoop / Spark - Open source cluster computing framework to store large amounts of data Data Mining - Discover relevant patterns in large amounts of data
Analytics - Derive insights rapidly from data to make business decisions
Predictive Analytics - Use machine learning techniques to analyze historical data and predict future outcomes
Text Mining - Analyze internal or external data (e.g. social media) to discover patterns and relationships
6. When was the first Big Data Analytics initiative launched in your organization?
Less than 1 year ago Between 1 - 2 years ago Between 2 -3 years ago Between 3 -4 years ago More than 4 years ago Don't Know
Not Applicable
7. How many different Big Data Analytics initiatives are in progress in your organization today?
None 1 - 2 3 - 5
More than 5 Don't Know Not Applicable
8. How important is Big Data Analytics relative to other priorities in your organization?
Extremely important Very important Moderately important Slightly important Not important at all
9. Which departments in your organization utilize Big Data Analytics on a daily basis? Please check all that are relevant
IT Finance Marketing
Customer Service / Support Human Resources
Research & Development Operations
Production
Other (please specify)
11. About what percentage of your organization's budget this year is marked for Big Data Analytics initiatives?
12. In percentages, please indicate how the budget for Big Data Analytics is approximately distributed across the following activities?
13. Using any number from 0 to 10, where 0 is Not at All and 10 is Extremely Well, how well have your Big Data Analytics initiatives met your initial expectations?
0 (Not
At All) 1 2 3 4 5 6 7 8 9
10 (Extremely
Well)
Not Applicable
0 (Not At
All) 1 2 3 4 5 6 7 8 9
10 (Extremely Well)
14. Which of the following benefits do you directly attribute to your Big Data Analytics investment?
Reduction in costs
Increase in innovation (product, service, processes) Faster and more accurate decision-making
Increase in customer or operational insights Creation of additional revenue streams
Increase in productivity (e.g. employee productivity) Other benefits? (please specify)
16. From a financial perspective, would you say that the ROI on Big Data Analytics was generally positive?
Yes it was definitely positive
No, it is not positive today but is expected it to increase in the near future No, it was not positive
Don't Know Not Applicable
17. Overall, how successful do you consider your Big Data Analytics initiatives?
Extremely successful Very successful Moderately successful Slightly successful Not successful at all Not Applicable
18. Which of the following challenges were faced in the implementation of your Big Data Analytics initiatives?
Difficulty in securing funding from leadership
19. Please rank the challenges faced by the Big Data Analytics initiatives relative to each other from 1(Most Challenging) to 4 (Least Challenging). Please assign a unique number between 1 and 4 for each challenge.
20. Does your organization have a formal methodology to measure return on investment of Big Data Analytics projects?
Yes, we use the same methodology used for non Big Data Analytics projects Yes, we created a new methodology to measure ROI for Big Data Analytics
No, but we are working on creating a new methodology for measuring ROI for Big Data Analytics No, we do not have a methodology to measure ROI of Big Data Analytics
Don't Know Not Applicable
21. Were any new metrics created to measure the performance of your organization's Big Data Analytics initiatives?
Yes No
Not Applicable
22. Were the metrics created initially useful in your goal of measuring return on investment of Big Data Analytics initiatives?
Yes, they were exactly what we needed No, we had to revise the metrics We did not create any metrics Don't Know
Not Applicable
23. Overall, how satisfied are you with the current methodology to measure return on investment of Big Data Analytics initiatives?
Extremely Satisfied Very Satisfied Satisfied
Somewhat Satisfied Not at all Satisfied Not Applicable
24. Would you like to to receive a copy of the survey report? Please click next after making a selection below to submit the survey.
No, I would like to remain anonymous
References
Accenture, A. (2013, April). Breakthroughs and Barriers Using Advanced Analytics to Achieve ROI - Accenture. Retrieved April 25, 2016, from
https://www.accenture.com/us-en/insight-analytics-action-summary.aspx
Balboni, F., Finch, G., Rodenbeck Reese, C., & Shockley, R. (2013, October 29). Analytics: A blueprint for value. Retrieved April 25, 2016, from
http://www-935.ibm.com/services/us/gbs/thoughtleadership/ninelevers/
Barton, D., & Court, D. (2012). Making advanced analytics work for you. Harvard business review, 90(10), 78-83.
Bertolucci, J. (2013, March). Big Data ROI Still Tough To Measure - InformationWeek. Retrieved April 25, 2016, from http://www.informationweek.com/big-data/big-data-analytics/big-data-roi-still-tough-to-measure/d/d-id/1110150
Big Data and Analytics, I. (2014). Explore customer stories. Retrieved April 25, 2016, from http://www.ibm.com/analytics/us/en/case-studies.html
Brown, B., Chui, M., & Manyika, J. (2011). Are you ready for the era of ‘big data’. McKinsey Quarterly, 4(2011), 24-35.
Brynjolfsson, E., Hitt, L. M., & Kim, H. H. (2011). Strength in numbers: How does data-driven decision making affect firm performance?. Available at SSRN 1819486.
Bughin, J. (2016, June). Telcos: The untapped promise of big data. Retrieved from http://www.mckinsey.com:
http://www.mckinsey.com/industries/telecommunications/our-insights/telcos-the-untapped-promise-of-big-data?cid=digistrat-eml-alt-mkq-mck-oth-1606
Buhl, H. U., Röglinger, M., Moser, F., & Heidemann, J. (2013). Big data. Business & Information Systems Engineering, 5(2), 65-69.
Capgemini & Informatica. (2016, June). The Big Data Payoff: Turning Big Data in Business Value. Retrieved from
https://www.capgemini.com/resource-file-access/resource/pdf/the_big_data_payoff_turning_big_data_into_business_value.pdf
Davenport, T. H. (2015, October 21). 5 Essential Principles for Understanding Analytics. Retrieved from Harvard Business Review: https://hbr.org/2015/10/5-essential-principles-for-understanding-analytics
Davenport, T. H. (2006, January). Competing on Analytics. Retrieved from Harvard Business Review: https://hbr.org/2006/01/competing-on-analytics
Deloitte. (2013). The Analytics Advantage | Deloitte | Deloitte Analytics Services | Article | Insights. Retrieved April 25, 2016, from
http://www2.deloitte.com/global/en/pages/deloitte-analytics/articles/the-analytics-advantage.html
Economist, T. (2012). Big Data: Lessons from the Leaders. Retrieved April 25, 2016, from
http://www.economistinsights.com/sites/default/files/downloads/EIU_SAS_BigData_4.p df
Enterprise, I. (2015, March 9). 2015 Big Data and Analytics Survey. Retrieved April 25, 2016, from http://www.idgenterprise.com/resource/research/2015-big-data-and-analytics-survey/
Forbes, I., & Teradata. (2015, September). Betting on Big Data: How the Right Culture, Strategy and Investments Can Help You Leapfrog the Competition - See more at:
Http://www.forbes.com/forbesinsights/teradata_big_data/index.html#sthash.HjlISabK.dp uf. Retrieved April 25, 2016, from
http://www.forbes.com/forbesinsights/teradata_big_data/index.html
Forrester Consulting. (2015, August). Delivering Governed Data For Analytics At Scale . Retrieved from
http://www.pentaho.com/sites/default/files/uploads/resources/pentaho_governed_data_de livery.pdf
Galunic, C., & Rodan, S. (1998). Resource recombinations in the firm: knowledge structures and the potential for Schumpeterian innovation. Strategic Management Journal, 19(12), 1193–1201
IDC. (2015, November 09). Press Release. Retrieved from IDC: http://www.idc.com/getdoc.jsp?containerId=prUS40560115
IDC: A Third of US Organizations Unsure How to Measure Analytics Benefits. (2010, March 30). Retrieved April 25, 2016, from
http://www.kdnuggets.com/2010/04/b-idc-organizations-unsure-how-to-measure-analytics-benefits.html
Manyika, J., Chui, M., Brown, B., Bughin, J., Dobbs, R., Roxburgh, C., & Byers, A. H. (2014). Big data: The next frontier for innovation, competition, and productivity. 2011. URL http://www.
McAfee, A., Brynjolfsson, E., Davenport, T. H., Patil, D. J., & Barton, D. (2012). Big data. The management revolution. Harvard Bus Rev, 90(10), 61-67.
Nicolaus Henke, Ari Libarikian, and Bill Wiseman . (2016, August). Straight talk about big data. Retrieved from McKinsey:
http://www.mckinsey.com/business-functions/business-technology/our-insights/straight-talk-about-big-data
Parmar, R., Cohn, D. L., & Marshall, A. (2014, March). Driving innovation through data. IBM Global Business Services. – See more at: http://www.ibm.com/big-data/au/en/big-data-and-analytics/Driving_innovation_through_data_Exec_Report_0520.pdf
Parmar, R., Mackenzie, I., Cohn, D., & Gann, D. (2014). The new patterns of innovation. Harvard Business Review, 92(1), 2.
Research, BARC. (2015, July). Big Data Use Cases 2015 – Getting real on data monetization. Retrieved April 25, 2016, from http://barc-research.com/research/big-data-use-cases-2015/
Research, N. (2014, September). Analytics pays back $13.01 for every dollar spent - Nucleus Research | Return On Investment (ROI). Retrieved April 25, 2016, from
http://nucleusresearch.com/research/single/analytics-pays-back-13-01-for-every-dollar-spent/
Ryerson. (2015, October 21). Big Data Consortium recommends strategies to close talent gap - Ryerson Today - Ryerson University. Retrieved April 25, 2016, from
http://www.ryerson.ca/ryersontoday/data/news/2015/10/20151021-ryerson-and-big-data-consortium-outline-strategies-to-close-talent-gap.html
Schroeck, M., & Shockley, R. (2012, October). Analytics: The real-world use of big data. Retrieved April 25, 2016, from
http://www-935.ibm.com/services/us/gbs/thoughtleadership/ibv-big-data-at-work.html
Shim, J. P., French, A. M., Guo, C., & Jablonski, J. (2015). Big Data and Analytics: Issues, Solutions, and ROI. Communications of the Association for Information Systems, 37(1), 39.
ZS Associates. (2016, June). Broken links: Why analytics investments have yet to pay off.