PERFORMANCE EVALUATION OF THE COMPARTMENT BAG TEST FOR E. COLI IN DRINKING WATER
Alice Wang
A dissertation submitted to the faculty at the University of North Carolina at Chapel Hill in partial fulfillment of the requirements for the degree of Doctor of Philosophy in the Department
of Environmental Sciences and Engineering in the Gillings School of Global Public Health.
Chapel Hill 2015
ii © 2015 Alice Wang
iii ABSTRACT
Alice Wang: Performance Evaluation of the Compartment Bag Test for E. coli in Drinking Water
(Under the direction of Mark D. Sobsey)
Nearly 748 million people worldwide lack access to improved drinking water sources, putting them at risk for waterborne illnesses. Fecal contamination of drinking water is one of the largest contributors to the 1.8 million deaths per year from diarrheal disease. Because many countries lack active monitoring of drinking water quality, it is often unknown if consumed waters are safe. Current microbial monitoring methods typically require the use of specialized equipment, electricity, and trained personnel. However, in low-resource settings, these capacities are often unavailable.Therefore, there is a need for a low-cost, portable, and simple method for determining the microbial quality of drinking water in low-resource settings.
iv
v
ACKNOWLEDGMENTS
I am truly grateful and would like to acknowledge the support of my doctoral dissertation committee. Thank you to Dr. Orlando Coronell, Dr. Jennifer Horney, Dr. Michael Emch, Dr. Jill Stewart and Dr. Mark Sobsey. I am humbled by the opportunity to work with such wonderful professors and great minds in science! Thanks to my doctoral dissertation committee, throughout my dissertation research I was able to be detail oriented and yet see how the experiments I was conducting can fit into a larger public health picture. I am appreciative of their encouragement, mentorship, and advice throughout my time as a doctoral student.
I would like to acknowledge special gratitude for Dr. Sobsey, who has been my advisor since Spring of 2008! I want to thank Dr. Sobsey for having faith in me and accepting me in his laboratory when I was only an undergraduate student with no laboratory experience or previous microbiology knowledge. I am so thankful of his many years of patience, mentorship, and wisdom. I have tremendously enjoyed working with Dr. Sobsey and am excited to join the prestigious rank of other Sobsey-ite graduates!
vi
This research represents hard work from many students, staff, and collaborators. I am grateful to Hannah Leker and Prianca Reddi who have dedicated hours in the laboratory with me. Thanks to my colleagues Katherine Pierson and Dr. Ku McMahan who have provided assistance in experimental design and general brainstorming of ideas. Thanks to Douglas Wait for his help with ordering and shipping laboratory supplies, especially when ordering and shipping entails dealing with international customs. I am also grateful for Dr. Glenn Walters whose innovative thinking has allowed microbial water quality testing to be conducted even in the remote Andes Mountains or African savannahs with modified incubators.
I could not have accomplished this research without the incredible assistance of my collaborators. In Peru, I want to acknowledge Meleny Katherine Puris Condor; Erica Cerron Garcia; Maria Yolanda Ramirez; Jorge Reyes Morano and Prudencia Javier from the Instituto Nacional de Estadística e Informática; Eddy Rojas from La direccion ejecutiva de Salud
Ambiental laboratorio; Margarita Molina from the Instituto de Investigacíon Nutricional; Gladys Nahir Chuquipiondo Laulate and Dina Chong Vasquez from the Asociación Civil Selva
Amazonica; and Dr. Shea RutsteinFrom ICF International. In Liberia, I want to acknowledge Henry Bundor; Alex Leinkpor; Patricia Morrison; Grace Gwesa, Aletha Nana, and Edwin Fallah from the Water Quality Control Laboratory of the Ministry of Health and Social Welfare of Liberia; and Dr. Joanna Lowell from ICF International. In Tanzania, I want to acknowledge Robert Masunya, Yusuph Bunzali, Gogadi Mgwatu, and Maryam Mshana from the Mwanza Urban Water and Sewerage Authority; Dr. John Feighery of mWater; and Lars Stordal from UN-Habitat.
vii
viii
TABLE OF CONTENTS
LIST OF TABLES……….………..xiii
LIST OF FIGURES………..……....xvi
LIST OF ABBREVIATIONS………...…xvii
CHAPTER 1: OVERVIEW AND OBJECTIVES……….………..1
1.1 Introduction and Background...1
Global drinking water issues and the Millennium Development Goal target...1
Limitation of water quality testing in low-resource settings………...4
The Compartment Bag Test as a novel method for microbial water quality analysis……….……….4
1.2 Objectives...5
CHAPTER 2: LITERATURE REVIEW……….………8
2.1 Burden of Disease Due to Inadequate Water, Sanitation, and Hygiene………...…….8
2.2 Escherichia coli as a Water Quality Indicator……….……12
2.3 Need for Microbial Water Quality Monitoring……….………...15
2.4 Current Microbial Water Quality Tests……….………..15
2.5 Limitations of Current Microbial Water Quality Tests in Low Resource Settings……….…..18
2.6 How the Compartment Bag Test Overcomes Limitations in Low Resource Settings……….……..19
2.7 Previous Compartment Bag Test Performance Evaluations………..…..22
ix
2.8 Improving Compartment Bag Test bacteriological culture………..……...26
2.9 Compartment Bag Test performance evaluations with improved bacteriological medium………..28
Comparing the CBT to membrane filtration for E. coli detection in water……...28
2.10 Need for further CBT evaluation………...29
CHAPTER 3: LABORATORY EVALUATION OF THE COMPARTMENT BAG TEST……….…….32
3.1 Introduction………..………32
3.2 Methods……….……...34
3.3 Results……….…….41
Comparison of CBT with Hi-E. coli and Colilert media for E. coli quantification in surface source water samples at different incubation temperatures………...41
Further bacteriological analysis of CBT presumptive positive and negative compartments via E. coli and coliform isolation by streak-plate colony isolation on a standard E. coli and coliform chromogenic agar medium………...46
Evaluation of presumptive E. coli positive and false negative isolates with biochemical analysis by EnteroPluri testing………..48
Evaluation of presumptive E. coli positive and false negative isolates from color positive and color negative bag chamber by molecular analysis using qPCR for the uidA gene target………...50
Evaluation of presumptive E. coli positive and false negative isolates with MALDI-TOF MS molecular analysis………....51
Summary of CBT performance outcomes based on identification of bacteria isolates from bag compartments by confirmatory tests for identification of presumptive E. coli ………..…………...53
3.4 Discussion……….………...54
x
CHAPTER 4: EVALUATION OF THE COMPARTMENT BAG TEST FOR
E. COLI IN A PERUVIAN DEMOGRAPHIC AND HEALTH SURVEY……….….59
4.1 Introduction………..………59
4.2 Methods………....61
4.3 Results……….….64
Comparison of field and laboratory sample holding times and incubation temperatures………..………...64
Comparison of field and laboratory results of E. coli concentration in household drinking water samples……….65
E. coli occurrence and concentrations in relation to residual chlorine…………..68
E. coli concentrations according to water source and treatment………69
4.4 Discussion……….……...70
4.5 Conclusions……….….75
CHAPTER 5: EVALUATION OF THE COMPARTMENT BAG TEST FOR E. COLI IN A LIBERIAN DEMOGRAPHIC AND HEALTH SURVEY………...76
5.1 Introduction………..…76
5.2 Methods……….…...78
5.3 Results……….….79
Source of drinking water sample………...79
Contamination levels of household drinking water by source………...80
Comparison of field and lab-based results……….82
5.4 Discussion……….………...88
5.5 Conclusions……….……….92
CHAPTER 6: USE OF THE COMPARTMENT BAG TEST AS A HEALTH BEHAVIOR TOOL IN TANZANIA………..………..93
xi
6.2 Methods………....96
Study location and household sample selection……….96
Household recruitment and data collection………97
Data analysis………..98
Ethical approval……….99
6.3 Results………..99
Understanding the background of surveyed participants………...99
Perception of water safety and treatment on day one………..100
Motivations and barriers to water treatment………...……….101
Perception of water safety and treatment on day two compared to day one……101
Reactions to the Compartment Bag Test……….103
6.4 Discussion……….….………105
6.5 Conclusions……….…...108
CHAPTER 7: CONCLUSIONS AND RECCOMENDATIONS………....109
7.1 Summary of Significant Findings………...109
CBT detection and quantification of E. coli in water………..…111
Feasibility of CBT use by diverse users………..113
Feasibility of CBT use in various environments………..114
Feasibility of CBT use in different applications………..116
7.2 Implications of Significant Findings………..119
7.3 Research Limitations………..……...121
7.4 Recommendations………..……124
xii
APPENDIX 1: CBT MPN ESTIMATE OF E. coli PER 100ML WATER SAMPLE………...128
APPENDIX 2: TRAINING MATERIALS FOR USE OF CBT IN DHS…………..………….130
APPENDIX 3: INSTRUCTIONS FOR USE OF MODIFIED INCUBATOR………...148
APPENDIX 4: LIBERIA CBT FIELD DATA COLLECTION FORM……….152
APPENDIX 5: LIBERIA DHS SAFE WATER BROCHURE………...153
APPENDIX 6: CBT KNOWLEDGE INTERVENTION SURVEY………...155
xiii
LIST OF TABLES
Table 2.1 A Summary of the description of transmission routes, examples of types
of infections, and control strategies for infectious diseases associated with water……...9 Table 2.2 Comparison of the CBT to current drinking water tests………21 Table 2.3 Summary statistics for E. coli detection in presumptive positive and negative
CBT compartments by streak plate isolation on a chromogenic E. coli agar medium..…25 Table 2.4 Comparison of LTB with X-gluc and Hi-E. coli bacteriological medium
compositions………..27 Table 2.5 Comparison of categorical concentrations of E. coli from the CBT and
membrane filtration for indicated numbers of samples and percentage of
samples per category………...29 Table 2.6 Performance characteristics of the CBT for the detection of E. coli
compared to membrane filtration………...………29 Table 3.1 Numbers of water samples tested with the CBT at each incubation
temperature for each dilution level in either Colilert medium or CBT
Hi-E. coli medium………..…35 Table 3.2 Summary of triple-streak procedure for isolating and culturing E. coli
and re-growing frozen cultures for further biochemical and molecular assays
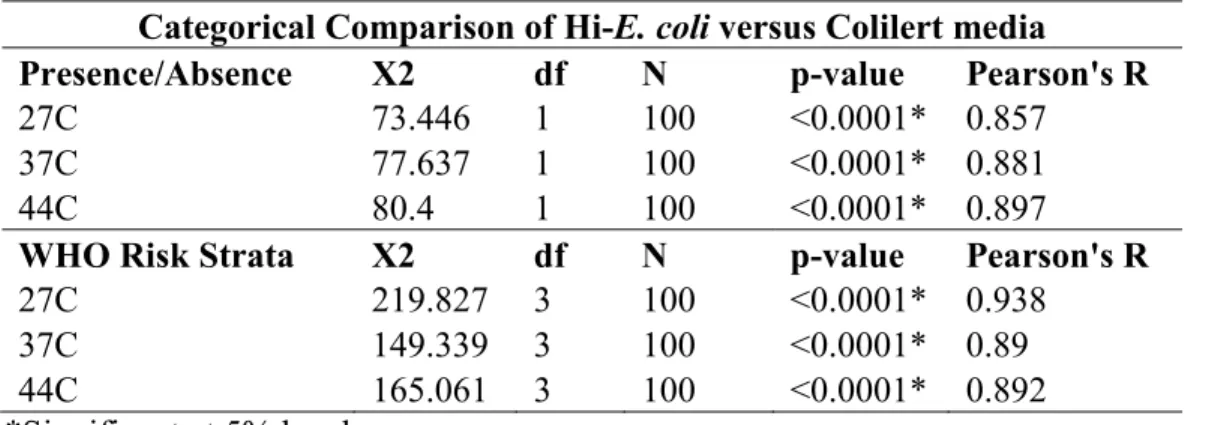
for speciation………..36 Table 3.3 Summary of Chi-Square and Pearson’s R correlation statistics for the
categorical comparison of Hi-E. coli and Colilert media across different
incubation temperatures……….44 Table 3.4 Three-way ANOVA regression results with log10(MPN) as the dependent
variable………...45 Table 3.5 Logistic regression results comparing MPN < 48.3 versus >=48.3 as the
dependent variable………..………...46 Table 3.6 Confirmation of E. coli presence or absence in color positive and color
negative CBT chambers based on streak plate E. coli colony isolation from
xiv
Table 3.7 Biochemical speciation using the EnteroPluri system for bacteria isolates from CBT E. coli test chambers based on color positivity or negativity in
CBT bag chambers………...49 Table 3.8 Molecular speciation of E. coli by qPCR for the uidA gene of bacteria
isolates from CBT E. coli test chambers based on color positivity or negativity
in bag chambers……….…51 Table 3.9 Molecular speciation of E. coli by MALDI-TOF MS of bacteria isolates from
CBT E. coli test chambers based on color positivity or negativity in bag chambers…....52 Table 3.10 Summary results of different methods to analyze CBT performance based on
confirmation of presumptive E. coli positivity or negativity……….54 Table 4.1 Average water sample holding time for field and laboratory analysis at all
three field sites in Peru, 2011………...……..…64 Table 4.2 CBT incubation methods and temperatures used at all three field sites………65 Table 4.3 Overall summary of median, arithmetic mean, and lower and upper 95%
confidence limits (CL) of E. coli concentrations from each test of household
drinking water samples………...………...66 Table 4.4 Summary of matched pair non-parametric test results and Spearman’s rank
correlations for E. coli concentrations in household water samples of all three
survey locations combined and separate……….……….………..67 Table 4.5 E. coli occurrence and concentrations for household drinking water with
different concentrations of free chlorine……….…………...69 Table 4.6 Number and percentage of field CBT analyzed household drinking water
samples in each WHO decimal category of E. coli concentration for improved
and unimproved sources………....69
Table 4.7 Number and percentage of laboratory MF analyzed household drinking water samples in each WHO decimal category of E. coli concentration for improved
and unimproved sources………70
Table 5.1 Source of household drinking water: Percentage of the distribution of households by source of drinking water according to residence, Liberia Water
Testing Pilot 2013………..………80
xv
Table 5.3 Comparison of lab Compartment Bag Test and field Compartment Bag Test results: number of samples with matching E. coli contamination risk category
enumerated using the lab CBT and the field CBT, Liberia Water Testing Pilot 2013..…83 Table 5.4 Comparison of lab membrane filtration and field Compartment Bag Test
results: number of samples with matching E. coli contamination risk category
enumerated using the lab MF and the field CBT, Liberia Water Testing Pilot 2013…....84 Table 5.5 Comparison of lab Compartment Bag Test and lab membrane filtration results:
number of samples with matching E. coli contamination risk category enumerated
using the lab CBT and the lab MF, Liberia Water Testing Pilot 2013………..…85 Table 5.6 Correlations comparing different test methods: number of samples with matching E. coli contamination risk category enumerated using the lab CBT and the lab MF,
Liberia Water Testing Pilot 2013……….………..86 Table 5.7 Results of hypothesis testing for different pairs of test types: number of samples with matching E. coli contamination risk category enumerated using the lab CBT
and the lab MF, Liberia Water Testing Pilot 2013……….…...88 Table 6.1 Perception of water safety………101
xvi
LIST OF FIGURES
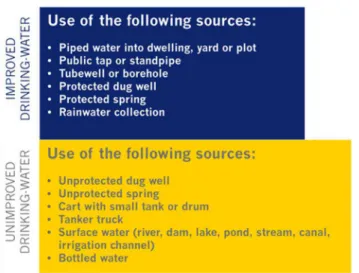
Figure 1.1 Definition of improved/unimproved drinking water sources by the Joint
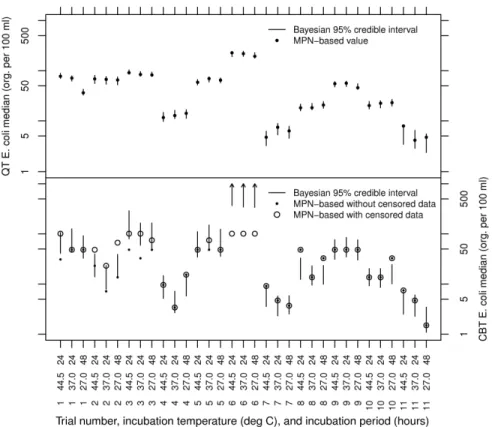
Monitoring Programme……….………...2 Figure 2.1 Water quality sample analysis results for E. coli for each combination of
sampling trial, incubation temperature, and incubation period, including Bayesian and conventional (MPN-derived) medians using QT (top panel) and CBT (bottom
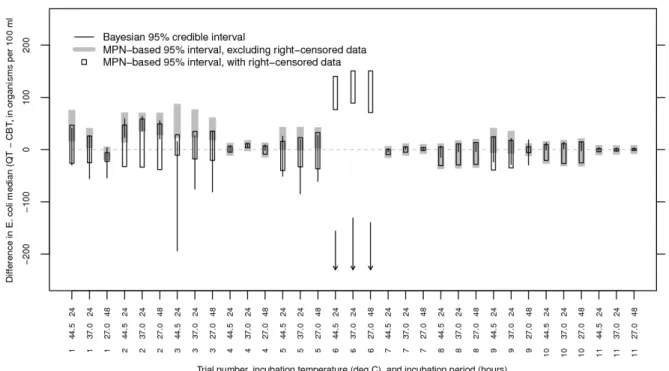
panel)……….……….23 Figure 2.2 Difference between QT and CBT results, measured as the difference between
the assessed E. coli concentration median for each combination of sampling trial
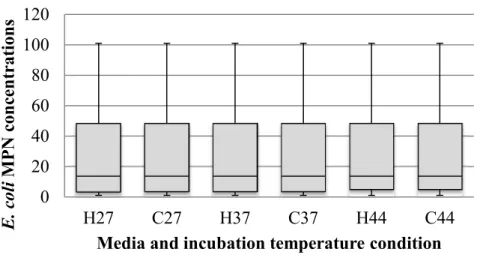
and incubation temperature………...……….………24 Figure 3.1 Box and whisker plot of E. coli MPN concentrations for Hi-E. coli (H) and
Colilert (C) media at different incubation temperatures of 27°C, 37°C, and 44.5°C…....42 Figure 3.2. Scatterplot of paired media log10(MPN) E. coli results as measured by
Hi-E. coli and Colilert media at different incubation temperatures……….…..42 Figure 3.3 Percentage of bacteria isolates identified as species other than E. coli by
MALDI-TOF MS from false positives.……….………53 Figure 4.1 Arithmetic means and 95% confidence intervals for E. coli concentrations in
household drinking water samples by each test, and by each survey region –Lima
(n=252), Loreto (n=181), Junín (n=232)……… ………..66 Figure 6.1 Map of the Town of Mwanza and the three routes on which households
were surveyed………...……….…97 Figure 6.2 Primary drinking water sources of surveyed participant households……….100 Figure 6.3 Comparison of log odds on the perception of water safety on day one and
xvii
LIST OF ABBREVIATIONS
ANOVA Analysis of Variance CBT Compartment Bag Test CI Confidence interval
DALYs Disability-adjusted life years DHS Demographic and Health Survey EC-MUG 4-methylumbelliferyl-β-D-glucuronide FC Fecal Coliform
GEMS Global Enteric Multicenter Study GBD Global burden of disease
H2S Hydrogen Sulfide
INEI Instituto Nacional de Estadística e Informática IRB Institutional Review Board
JMP Joint Monitoring Programme LTB Lauryl Tryptose Broth
MALDI-TOF Matrix Assisted Laser Desorption/Ionization Time of Flight MDG Millennium Development Goals
MICS Multiple Indicator Cluster Survey MPN Most Probable Number
MS Mass Spectrometry
xviii PBS Phosphate Buffered Saline PCR Polymerase Chain Reaction POU Point of use
qPCR Quantitative Polymerase Chain Reaction
RT-qPCR Real-time Quantitative Polymerase Chain Reaction
spp Species
TC Total Coliforms TSA Tryptic Soy Agar
UN-Habitat United Nations Human Settlements Programme UNICEF United Nations International Children’s Fund USD United States Dollar
USAID United States Agency for International Development WASH Water, sanitation and hygiene
WHO World Health Organization
1
CHAPTER 1: OVERVIEW AND OBJECTIVES
1.1 Introduction and Background
Global drinking water issues and the Millennium Development Goal target
It is estimated 748 million people worldwide lack access to safe drinking water sources, putting them at risk for water-borne illnesses, especially diarrheal disease (WHO/UNICEF, 2014). Fecally contaminated drinking water is one of the largest contributors to the 1.8 million deaths per year from diarrheal disease. The vast majority of these deaths occur in children under five years of age because they are especially susceptible to the effects of diarrheal disease. In developing countries, the lack of safe, managed water sources, and water infrastructure results in the use and consumption of water from unprotected, compromised, and potentially polluted sources (Brown et al., 2008; Lee et al., 2005; Wright et al., 2004). Reviews of public health interventions to prevent diarrheal disease have documented median reductions in diarrhea from water quality interventions ranging from about 15 to 40%, (Clasen et al., 2007; Esrey et al., 1991; Fewtrell et al., 2005).
2
microbial water quality, is imperative in distinguishing safe and unsafe water and then
preventing unsafe water with directed interventions, identifying and responding to outbreaks of waterborne illness, tracking the sources of contamination to then intervene and minimize exposure, assessing the effectiveness of water disinfection and distribution programs, as well as ensuring safe water a human right.
One of the aims of the Millennium Development Goals (MDG), as set forth by the United Nations in 2000, Target 7c, is to halve by 2015 the number of people without access to safe drinking water. For the MDG target, the definition of an improved or unimproved water source was based on the water source and/or the type of technology employed at a water point, see Figure 1.1, rather than actual sampling and analysis of the drinking water. This approach to classifying water access was due to the cost and complications that microbiological water testing entails (WHO/UNICEF, 2012). Global access to improved water sources has increased since 1990, due in large part to the successful mobilization of resources organized in support of the MDG, and Target 7c is considered to be “on track” and was met in 2010, five years ahead of schedule (WHO/UNICEF, 2012).
3
4
Limitations of water quality testing in low-resource settings
Currently approved methods for the enumeration of E. coli in drinking water samples require the use of specialized equipment, including an electrically powered incubator, and entail complicated procedures that must be performed by trained personnel (Bain et al., 2012a). Many areas of the world that lack access to improved drinking water sources are located in remote rural regions where little or nothing is known about the microbial quality of drinking water sources used by communities and households. In such low-resource settings, which may also be very isolated, accessible methods for determining the microbial quality of drinking water sources are lacking. Furthermore, standard methods used to monitor microbial water quality for regulatory compliance in even developed countries may be extremely difficult to use in these types of settings (Bain et al., 2012a). For example, the US EPA procedures for microbial analysis of water samples state that the sample must be kept between 1-4oC during transit and should be analyzed as soon as possible after collection and not more than 30 hours post-collection (US EPA, 1982). It is difficult to achieve these sample-handling conditions in low-resource settings and the quality of analysis of a sample that does not follow these guidelines will potentially be compromised. Therefore, there is a need for a low-cost, portable, simple method that does not require specialized and highly skilled analysts, additional equipment and materials, such as an incubator, and can be performed on-site, to determine the microbial quality of drinking water in low-resource settings (Bain et al., 2012a; Onda et al., 2012).
The Compartment Bag Test as a novel Method for microbial water quality analysis
5
resource settings (Bain et al., 2012a; McMahan et al., 2009; 2011). The CBT is portable, simple to perform with few steps, can be visually scored, requires no cold chain or supporting
equipment and specialized materials, and can be performed on-site. The CBT is a polyethylene bag (Whirl-Pack, Nasco) that was modified to provide separate internal chambers of 56, 30, 10, 3, and 1 mL sample volumes, totaling 100 mL. A Hi-E. coli test bud of E. coli bacteriological medium (HiMedia Labs, Mumbai, India) containing a chromogenic glucuronide substrate, 5-bromo-4-chloro-3-indolyl- ß -D-glucuronic acid (X-gluc), is added to a water sample and the amended water is swirled to fully dissolve the medium. Once the medium reagent is dissolved, the sample is transferred to a sterile CBT. The sample is then distributed among the 5
compartments by tilting the bag from side to side and manual adjustment (squeezing) of the compartment volumes. An external 2-piece spring plastic clip is placed across the bag above the liquid levels in the compartments but below the tops of the compartments in order to isolate the compartments from each other. The sealed bag is then incubated at 27-44.5°C for 18-24 hours, or longer at the lower temperatures of 27-30 oC, and the compartments that show bacterial growth by the presence of any trace of blue or blue-green color are considered to be positive for E. coli growth. The combination of positive compartments and their volumes provide the basis for an MPN estimate of the E. coli concentration per 100 mL of water that is looked up in a table (See Appendix 1).
1.2 Objectives
6
with the addition of X-gluc. A new and improved medium for the detection of E. coli has been produced and will be further tested in the laboratory. Also, while previous laboratory based experiments on the CBT have been conducted, there is the potential for differences between laboratory effectiveness and efficacy in the field. This proposed research is largely aimed at assessing the efficacy and applicability of this new method for use in low-resource settings in the field compared to other currently available and accepted methods. The CBT will be evaluated both in the laboratory and field for its performance in E. coli detection in drinking water and its sources. The specific objectives are outlined below.
1. Laboratory validation of CBT detection of E. coli in water samples
a) Compare CBT media with Colilert in detection and quantification of E. coli b) Evaluate CBT detection results at various incubation temperatures
c) Identify presumptive positive and negative E. coli isolates from the CBT 2. Field application of CBT within a Demographic Health Survey in Peru
a) Compare the CBT when used in the field by surveyors and in the laboratory by trained technicians to membrane filtration done in in the laboratory by trained technicians
b) Evaluate the robustness, effectiveness and applicability of the CBT in low resource settings and when incorporated within a national health survey at pilot scale
3. Field application of CBT within a Demographic Health Survey in Liberia
7
b) Evaluate the robustness, effectiveness and applicability of the CBT in low resource settings and when incorporated within a national health survey at pilot scale
4. Evaluation of the CBT as a health behavior and education tool in Tanzania a) Observe the ease and usability of the CBT by household users, and its impact on user perceptions of and attitudes about water quality
8
CHAPTER 2: LITERATURE REVIEW
2.1 Burden of Disease Due to Inadequate Water, Sanitation, and Hygiene
9 (Pruss-Usten et al., 2014).
Several diseases are related to WASH due to pathogen transmission via water (see Table 2.1). Disease transmission by water can be classified into four categories: waterborne, water-washed, water-based and water- related (White, Bradley, & White, 1972). Ingesting fecally contaminated water transmits waterborne pathogens. Lack of adequate quantity of water for washing and bathing transmits water-washed pathogens. Water-related pathogens are transmitted via an insect vector that breeds in water. Water-based pathogens are transmitted via a parasite vector that lives in contaminated water, some of which have an intermediate aquatic host.
Table 2.1 A Summary of the description of transmission routes, examples of types of infections, and control strategies for infectious diseases associated with water
Transmission Route
Description Example of infections Control Strategies Waterborne Water is a passive
vehicle for infectious agent; transmission is due to consumption of contaminated water
Bacterial infections: Salmonella typoid, enterobacteria, cholera
Viral infections: hepatitis A, rotavirus Parasitic infections: amoebiasis, giardiasis, intestinal protozoa, ascariasis, hookworm
Improvements in microbial water quality
Water-washed Insufficient
quantities of water for hygiene leads to infection
Enteric infections: diarrheal diseases and gastroenteritis
Skin infections: scabies Lice-borne infections: typhus Eye and ear infections: otitis, conjunctivitis, trachoma Increase water supply, improvements in hygiene practices Water-based The infective
agent’s life cycle takes place in an aquatic organism; infection is
transmitted through contact with
contaminated water or ingestion of infective agent
Infections due to crustaceans: dracunculiasis
Infections due to fish: diphyllobothriasis
Infections due to shellfish: flukes, shistosomiasis Reduce surface water contamination or contact with contaminated water
Water-related Infections spread by insects that
Infections due to mosquitos: malaria, yellow fever, hemorrhagic fever
10
breed in water Infections due to tsetse flies: trypanosomiasis
Infections due to blackflies: onchocerciasis
for breeding; Use of barriers like bed nets or pesticides (Table adapted from Wenhold and Fraber, 2009)
The microbial quality of drinking water has a large impact on health if access to safe water is limited or lacking (Fewtrell and Bartram, 2001). Contaminated drinking water may contain unsafe levels of microorganisms that pose a risk to human health (WHO/UNICEF, 2010). Interventions in drinking water quality to reduce diarrheal disease target primarily waterborne pathogens. Waterborne pathogens comprise a broad range of microorganisms ranging from viruses to bacteria to parasites. For example, a case-control study in Ecuador documented cases of diarrhea as a result of all three classes of pathogens: Escherichia coli, Rotavirus and Giardia (Eisenberg et al., 2006). The Global Enteric Multicenter Study (GEMS), a prospective case-control study conducted in four sites in Africa and three in Asia during the years 2007 through 2011, found that most cases of moderate-to-severe diarrhea were attributable to four pathogens: rotavirus, Cryptosporidium, enterotoxigenic Escherichia coli, and Shigella (Kotloff et al., 2013). Other pathogens noted important in selected GEMS sites include: Aeromonas, Vibrio chloerae O1, and Campylobacter jejuni (Kotloff et al., 2013).
11
also be zoonotic and exposure and infection can result due to ingestion of contaminated water or contaminated pork (Sobsey, 2015). These zoonotic pathogens can infect many animals including livestock such as such as poultry, cattle and sheep. Infected animals often have no symptoms of disease except the fecal shedding of pathogens. Fecal shedding of pathogens from infected animals is a concern if untreated animal fecal wastes, utilized to amend soil for agriculture or discharged through irrigation, contaminate drinking water supply, produce that may be eaten raw, or waters used for bathing or recreation (Sobsey, 2015).
Pathogens transmitted through the fecal-oral route often cause diarrheal disease
(Feachem, 1983). These pathogens are typically considered enteric pathogens because they can infect the gastrointestinal tract and once shed into the environment via excreta, they are capable of being transmitted in a variety of ways including through ingestion of or contact with
12
more than 1.8 million deaths annually (Bain et al., 2014; WHO/UNICEF, 2014). 2.2 Escherichia coli as a Water Quality Indicator
Monitoring for indicators for fecal pollution better protects the public’s health than monitoring for specific pathogens. There are numerous known pathogens and potentially even more unknown pathogens. The methods for monitoring pathogens are expensive, technically demanding and time-consuming (Edberg, 2000). Because the presence of pathogens correlates well with the presence of fecal contamination, current drinking water testing relies on fecal bacteria as indicators of both fecal contamination and possible presence of pathogens (Gleeson and Gray, 1996; Leclerc et al., 2001; McFeters et al, 1974; Rompre et al., 2002). In 1904, a fecal coliform test was developed for total coliforms encompassing all members of the
Enterobacteriaceae that could ferment lactose to produce acid and gas. (Eijkman, 1904; Edberg et al., 2000). In 1914, the United States Treasury Department proposed a standard for drinking water safety that codified the utilization of a total coliform test (Clesceri et al., 1998; Edberg et al., 2000).
The total coliform test was soon criticized because it included numerous species not of fecal origin (Frost, 1915; Fuller, 1915). In 1977, a study found 96.8% of coliforms isolated from human feces were E. coli with the remaining 3.2% isolates identified as Klebsiella, Citrobactor, and Enterobacter species (Dufour, 1977; Tallon et al., 2005). These genera are now referred to as thermotolerant coliforms or fecal coliforms and have been used as indicators of fecal
13
Theobald Smith first proposed E. coli as indicator in 1890s as the primary drinking water indicator since E. coli is part of the normal intestinal flora of mammals and could be found in mammal feces at concentrations of 109/gram (Edberg et al., 2000). Now the indicator organism E. coli is the standard indicator of fecal contamination in drinking water, endorsed by the US EPA and the World Health Organization (WHO, 2011). The two key factors of why E. coli was chosen as indicator are: 1) the finding that some other “fecal” indicators were often non-fecal in origin, and 2) the development of improved testing methods for E. coli such as defined substrate technology (DST) introduced in 1987 (Edberg et al., 2000; Tallon et al., 2005). DST contains 4-methyl-umbellfieryl-B-D-glucuronide (MUG), which can be only metabolized by the enzyme, β-glucuronidase, particular to E. coli and present in more than 95% of all isolates of E. coli
(Edberg et al., 2000). In DST, the substrate acts as a main food source and the metabolism of the substrate allows growth of the target microbe at the expense of others, eliminating a confirmation step. With the simplicity of DST, the detection of E. coli is the most widely accepted target for measuring the microbial quality of drinking water that is at risk for fecal contamination.
14
Council of the National Academies, 2004; Riesbro et al., 2012).
However, failures to meet some of these criteria have been reported, such as the variable E. coli to pathogen ratios in water samples analyzed during drinking waterborne outbreaks or in tropical climates (Gleeson et al., 1997; Van Lieverloo et. al., 2007; Oh et al., 2012). High concentrations of E. coli have been found in tropical natural water systems and pulp and paper mills with no known sources of fecal contamination (Tallon et al., 2005). Despite these findings, the extent to which E. coli fulfills the majority of the indicator criteria is considered sufficient to be preferred over other microbial indicators (WHO, 2011).
15 2.3 Need for Microbial Water Quality Monitoring
Fecal contamination of drinking water is one of the main causes of diarrheal illness in low-resource settings (WHO/UNICEF, 2009). Many of these cases of illness could be avoided if regular microbial water quality testing were performed to determine the microbial quality of drinking water, which could prompt action to remediate fecally contaminated water when found. These tests results can inform communities or households of whether their current drinking water source is safe, if they should seek other sources of drinking water, or use water treatments such as disinfection treatment before consumption. The same is true for situations following natural disasters in which water infrastructure may be impaired and thus drinking water quality may be compromised. There exist many tests to detect and quantify E. coli and other fecal coliforms in drinking water; however the tests may be complex, time-consuming, and expensive (Bain et al., 2012a). Current methods may not be appropriate for low-resource settings. However, the Compartment Bag Test (CBT) offers an alternative to the other tests that enable its use in these settings (Bain et al., 2012a; McMahan et al., 2011; Stauber et al., 2014).
2.4 Current Microbial Water Quality Tests
The three current EPA-approved standard methods for detecting E. coli in drinking water sources are membrane filtration using differential and selective chromogenic and fluorogenic agar media such as Bio-Rad RAPID’E. coli 2™ agar (Bio-Rad) or BD MI agar (MI), multiple tube fermentation (MTF) tests using differential and selective broth culture media, and
16
pour plate methods, including Coliscan™ Easygel® (Easygel). All of these tests require
resources and conditions that are not readily available in most resource-poor settings, such as in rural areas of developing countries (WHO, 2011; US EPA, 2002). While these methods are appropriate for testing water in developed countries where trained personnel, electricity, and expensive laboratory equipment are available, most rural regions of developing countries will not have access to any of these requirements (Bain et al., 2012a). Therefore, these current microbial water quality tests will not be available to accurately assess the quality of drinking water in these settings.
17
and a source of vacuum, electricity (for a vacuum pump and bacteriological incubator), and trained personnel able to carry out the steps of the analytical method and score the results.
The multiple tube fermentation (MTF) technique is a quantal method that gives a most-probable-number (MPN) estimation of E. coli concentration in water samples. The MTF method utilizes differential and selective liquid broth media and multiple sample volumes that are scored as positive or negative for the distinctive growth of E. coli, such as the appearance of
fluorescence under long wavelength UV light using fluorogenic EC-MUG medium (Edberg et al. 1988). This method uses several culture tubes requiring precise measurements using pipets, racks to hold the culture tubes, and other sterile laboratory equipment. Positive results take 48 hours and have lower precision than methods based on enumerating colonies, such as membrane filtration, though this technique is sensitive (US EPA, 1986). It is a tedious procedure requiring the preparation of sterile broth culture media usually by autoclaving, trained personnel,
electricity, and expensive laboratory equipment. Thus, the MTF method is not an appropriate or practical method for use in resource-poor settings.
18
light and the concentration of E. coli is expressed as an MPN value per 100 mL sample based on the number of positive and negative wells. Quanti-Tray 2000 can enumerate from 1-2,419 MPN, giving a wide range of concentration values. While simpler than the previous two methods, this method is the most expensive on account of the required purchase of a Quanti-Tray sealer and the relatively high cost of the Colilert defined substrate culture medium.
Coliscan™ Easygel® (Easygel) uses only a 5 mL sample of water, a bottle containing the Easygel medium, and a proprietary petri dish that has been coated with a chemical catalyst that solidifies the pectin gelling agent in the culture medium. The sample water is mixed in the bottle with the Easygel medium, poured into a pre-treated petri dish, and allowed to solidify for 40 minutes. The petri dish is then incubated at 44.5oC for 24 hours (Coliscan Easygel, 2014). While simple, this method still requires trained personnel, laboratory equipment, electricity, and frozen storage of the proprietary culture medium. Furthermore, the small sample size limits the lower detection limit for E. coli to 20 or more CFU per 100 mL, which is well above the level of <1 E. coli per 100 mL that is considered safe for drinking water.
19
used by communities and households. In such low-resource settings, which may also be very isolated, accessible methods for determining the quality of drinking water sources are lacking. Furthermore, standard methods used to monitor microbial water quality for regulatory
compliance in even developed countries may be extremely difficult to use in these types of settings (Bain et al., 2012a). For example, the US EPA procedures for microbial analysis of water samples state that the sample must be kept between 1-4oC during transit and should be analyzed as soon as possible after collection and not more than 30 hours post-collection (US EPA, 1982). It is difficult to achieve these sample-handling conditions in low-resource settings and the quality of analysis of a sample that does not follow these guidelines will potentially be compromised. Therefore, there is a need for an accessible, low-cost, portable, simple method that does not require specialized and highly skilled analysts, additional equipment and materials, such as an incubator, and can be performed on-site, to determine the microbial quality of drinking water in low-resource settings (Bain et al., 2012a; Onda et al., 2012; Sundram et al., 2000).
2.6 How the Compartment Bag Test Overcomes Limitations in Low Resource Settings The Compartment Bag Test (CBT) is a novel method for quantifying E. coli in drinking water samples and has the potential to overcome the barriers to microbial water quality testing in low resource settings (Bain et al., 2012a; McMahan et al., 2009; 2011). The CBT is portable, self-contained, simple to perform with few steps, can be visually scored, requires no cold chain or supporting equipment and specialized materials, and can be performed on-site (Stauber et al., 2014). The CBT is a polyethylene bag (Whirl-Pack, Nasco) that was modified to provide
20
containing a chromogenic glucuronide substrate, 5-bromo-4-chloro-3-indolyl- ß -D-glucuronic acid (X-gluc), is added to a water sample and swirled to fully dissolve (Manafi, 1996). Once the medium reagent is dissolved, the sample with dissolved medium is transferred to a sterile CBT. The sample is then distributed among the 5 compartments of the CBT by tilting the bag from side to side and manual adjustment (squeezing) of the compartment volumes. An external 2-piece plastic spring clip is placed across the bag above the liquid levels in the compartments but below the tops of the compartments to isolate the compartments from each other. The sealed bag is then incubated at 27°C to 44.5°C for 18-24 hours (or up to 48 hours when temperatures are in the 25°C to 30 oC range) and the compartments that show bacterial growth with any trace of blue or blue-green color are considered to be positive for E. coli growth. The combination of positive compartments and their volumes are converted to an MPN estimate of the E. coli concentration per 100 mL of water.
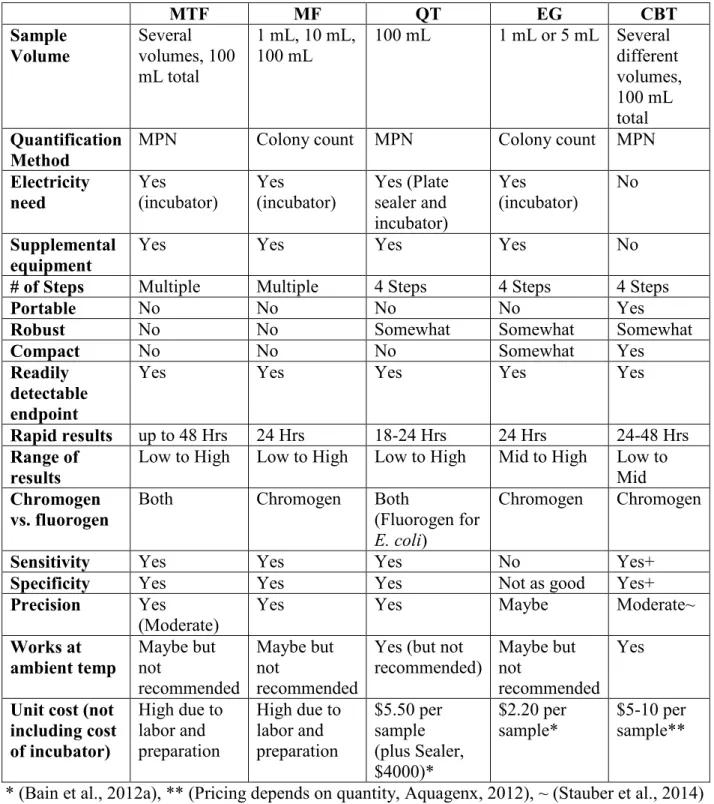
Because of the lightweight, plastic components of the CBT, the test is portable and compact. There are no glass components or heavy and bulky equipment needed for the CBT, allowing the test to be robust in use. The CBT can be incubated at reasonable ambient incubation temperatures, between 27°C to 44.5°C. In tropical regions with a warm climate, an incubator may not be necessarily. The use of the chromogenic medium allows for the CBT end point result can be visually scored without the need for a UV lamp. There are few steps to the CBT method. A chlorine tablet can be added to disinfect the used CBT, and the test can be disposed of as normal trash. Table 2.2 compares the CBT to some current E. coli tests based on key
21
Table 2.2 Comparison of the CBT to current drinking water tests
MTF MF QT EG CBT
Sample Volume
Several volumes, 100 mL total
1 mL, 10 mL, 100 mL
100 mL 1 mL or 5 mL Several different volumes, 100 mL total Quantification Method
MPN Colony count MPN Colony count MPN
Electricity need Yes (incubator) Yes (incubator) Yes (Plate sealer and incubator) Yes (incubator) No Supplemental equipment
Yes Yes Yes Yes No
# of Steps Multiple Multiple 4 Steps 4 Steps 4 Steps
Portable No No No No Yes
Robust No No Somewhat Somewhat Somewhat
Compact No No No Somewhat Yes
Readily detectable endpoint
Yes Yes Yes Yes Yes
Rapid results up to 48 Hrs 24 Hrs 18-24 Hrs 24 Hrs 24-48 Hrs Range of
results
Low to High Low to High Low to High Mid to High Low to Mid Chromogen
vs. fluorogen
Both Chromogen Both
(Fluorogen for E. coli)
Chromogen Chromogen
Sensitivity Yes Yes Yes No Yes+
Specificity Yes Yes Yes Not as good Yes+
Precision Yes
(Moderate) Yes Yes Maybe Moderate~
Works at ambient temp Maybe but not recommended Maybe but not recommended
Yes (but not recommended)
Maybe but not
recommended Yes
Unit cost (not including cost of incubator)
High due to labor and preparation
High due to labor and preparation $5.50 per sample (plus Sealer, $4000)* $2.20 per sample* $5-10 per sample**
22
2.7 Previous Compartment Bag Test Performance Evaluations Comparing the CBT to Idexx Quanti-Tray Colilert method
Prior laboratory performance studies were conducted by McMahan et al, to characterize the ability of the CBT to quantify E. coli in drinking water by comparing it to the IDEXX Colilert® Quanti-Tray 2000 (QT), a recognized standard method for microbial water quality testing (McMahan et al, manuscript in preparation). A total of 884 surface water samples were collected over eleven sampling dates from surface water sites in Chapel Hill, North Carolina (United States), supplemented with specific growth medium for E. coli, either Colilert for QT or lauryl tryptose broth (LTB)
supplemented with X-gluc for CBT, and incubated for 24 to 48 hours at three different incubation temperatures, 44.5°C, 37°C, or 27°C.
The comparison between the QT and CBT analytical methods using the Mann-Whitney test in Figure 2.1 and the Bayesian hierarchical analysis in Figure 2.2 both indicate that the new CBT
procedure yields results consistent with those of the Colilert QT procedure. This assessment is based, in part, on the frequency with which the confidence intervals for the difference between the E. coli median values derived from the two testing procedures contain zero. Because these intervals are expected to contain zero roughly 95% of the time, it is expected that of 30 intervals, between 24 to 30 of them contain zero. More specifically, of the 30 confidence intervals constructed (excluding trial 6) for the difference between the QT and CBT results for each statistical procedure, 24 from the
23
differences, there appears to be sufficient statistical evidence to reject the hypothesis that the procedures are different.
Results recorded at incubation periods of both 24 and 48 hours indicate that the CBT yields results consistent with those from the Colilert QT system for E. coli detection, and that the CBT samples incubated at non-standard temperatures (temperatures above 25°C and below 37°C) gave results equivalent to standard temperatures. Therefore, ambient temperature incubation is possible and the CBT has the potential to serve as a low-cost, accessible solution for practical microbial drinking water quality testing in low resource settings.
24
Figure 2.2 Difference between QT and CBT results, measured as the difference between the assessed E. coli concentration median for each combination of sampling trial and incubation temperature. Bayesian credible intervals which end in an arrow (trial 6) indicate that the interval bound is several orders of magnitude less than the panel y-axis limits.
25
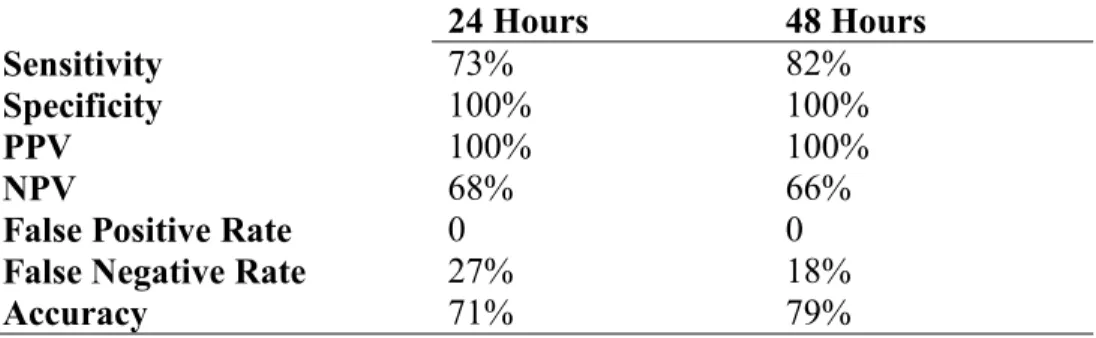
Table 2.3 Summary statistics for E. coli detection in presumptive positive and negative CBT compartments by streak plate isolation on a chromogenic E. coli agar medium
24 Hours 48 Hours
Sensitivity 73% 82%
Specificity 100% 100%
PPV 100% 100%
NPV 68% 66%
False Positive Rate 0 0
False Negative Rate 27% 18%
Accuracy 71% 79%
26
2.8 Improving Compartment Bag Test bacteriological culture
The X-gluc chromogen has been shown previously to be highly accurate in detecting E. coli based on its detection of ß-glucuronidase activity, with a 1% false-negative rate and 5% false-positive rate (Watkins et al., 1988). However, in the McMahan et al. study, the CBT
demonstrated a false positive rate of 0% and false-negative rate of 28-37%, after 24 and 48 hours of incubation, respectively, via identification of isolated bacteria by biochemical assay using the EnterotubeTM II system (Becton Dickinson) for identification of Enterobacteriaceae (McMahan et al., manuscript in preparation). In order to not underestimate E. coli concentration in water, due to implications for public health protection, further evaluation is needed to better determine the accuracy, sensitivity, and specificity of the CBT.
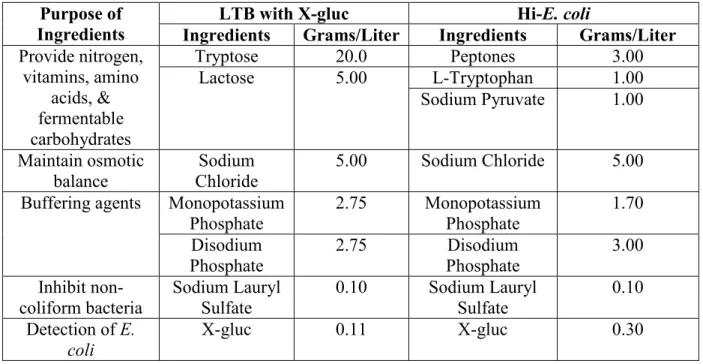
In this previous study, the CBT medium used for comparison with Colilert was lauryl tryptose broth (LTB) medium, a standard coliform medium, supplemented with 0.1114 g/L of X-gluc, a chromogenic Beta-D-glucuronide substrate. The efficacy of LTB in culturing E. coli is well established (Feng & Hartman, 1992; Park et al., 1995), and the results found in this study show that this efficacy was still apparent with the addition of the chromogenic substrate X-gluc to LTB. However, some limitations of this medium could be that due to varying nutritional requirements and the presence of the anionic surfactant sodium lauryl sulfate, certain bacterial strains and injured bacteria may grow poorly or fail to grow. Also, LTB may form a precipitate when stored at colder temperatures. Although this precipitate generally dissipates upon warming to room temperature, precipitation of medium may hinder visible detection of E. coli growth in a liquid medium. Therefore, an improved chromogenic medium for E. coli growth was developed.
27
carbohydrates, tryptophane (a substrate for indole production), a chemical agent to resuscitate injured cells, and a synthetic analog of lactose that inactivates the lac repressor and induces synthesis of beta-galactosidase. The concentration of X-gluc is about 163% greater in the new medium than in the previously studied medium mixture. Table 2.4 below compares the
previously used LTB supplemented with X-gluc and Hi-E. coli bacteriological medium
composition. An increase in X-gluc concentration may allow for sufficient concentration of the hydrolysis product from the chromogenic glucuronide substrate by the E. coli bacteria growth to produce a visible color change for detection of E. coli with decreased occurrence of previous false negatives.
Table 2.4 Comparison of LTB with X-gluc and Hi-E. coli bacteriological medium compositions
Purpose of Ingredients
LTB with X-gluc Hi-E. coli
Ingredients Grams/Liter Ingredients Grams/Liter Provide nitrogen,
vitamins, amino acids, & fermentable carbohydrates
Tryptose 20.0 Peptones 3.00
Lactose 5.00 L-Tryptophan 1.00
Sodium Pyruvate 1.00
Maintain osmotic
balance Chloride Sodium 5.00 Sodium Chloride 5.00 Buffering agents Monopotassium
Phosphate
2.75 Monopotassium Phosphate
1.70 Disodium
Phosphate
2.75 Disodium
Phosphate 3.00 Inhibit non-coliform bacteria Sodium Lauryl Sulfate
0.10 Sodium Lauryl Sulfate
0.10 Detection of E.
coli
28
2.9 Compartment Bag Test performance evaluations with improved bacteriological medium Comparing the CBT to membrane filtration for E. coli detection in water
In a recent study by Stauber et al. (2014), 261 water samples collected around metro-Atlanta in volumes of 10, 50, or 100 ml were analyzed in duplicate by membrane filtration with a selective medium (mI agar, Becton Dickinson, Sparks, MD) containing chromogenic and
fluorogenic β- glucuronide and β-galactoside substrates for the detection and enumeration of E. coli and coliforms, respectively, following standard method 1604 (US EPA, 2002). After applying the membranes of filtered water to the agar medium, the plates were inverted and incubated for 18–24 h at 37°C. E. coli colonies were quantified and reported as colony forming units (CFU) per 100 mL (US EPA, 2002). The same water samples were also processed in duplicate in volumes of 100 mL by the CBT method with the improved Hi-E. coli medium. Positive compartments of the bag were identified as those that turned a blue-green color, indicating the presence of E. coli due to the hydrolysis of the chromogenic β-glucuronide
29
Table 2.5 Comparison of categorical concentrations of E. coli from the CBT and membrane filtration for indicated numbers of samples and percentage of samples per category
Membrane Filtration (CFU/100 ml) CBT (MPN/100
ml)
<1 1-10 11-100 >100 Total
<1 28 8 4 0 40
70.0% 20.0% 10.0% 0% 100%
1-10 1 30 9 2 42
2.38% 71.4% 21.4% 4.76% 100%
11-100 0 7 50 11 68
0% 10.3% 73.5% 16.2% 100%
>100 0 0 8 103 111
0% 0% 7.21% 92.8% 100%
Total 29 45 71 116 261
11.1% 17.2% 27.2% 44.4% 100%
(Modified from Stauber et al., 2014)
Table 2.6 Performance characteristics of the CBT for the detection of E. coli compared to membrane filtration
Sensitivity 94.9%
Specificity 96.6%
PPV 99.6%
NPV 70%
False Positive Rate 3.4 % False Negative Rate 5.1%
Accuracy 95%
(modified from Stauber et al., 2014)
2.10 Need for further CBT evaluation
30
for low-resource settings (Bain et al., 2012a; McMahan et al., 2011; Stauber et al., 2014). The simplicity of the test allows anyone with brief training to test their own water, thereby
empowering people with knowing if their water is safe so that they can determine their own remedial actions. There are several different applications of this technology for water quality analysis including management, surveillance and verification of water quality, food and beverage safety, and use in disaster preparedness. Previous research on the CBT by McMahan et al.
indicated that the CBT yields consistent results when compared to the QT system with Colilert medium for E. coli detection, and that the CBT samples incubated at non-standard temperatures gave similar results to those at standard temperatures (McMahan et al., manuscript in
preparation). However the sensitivity and accuracy ranged from 71-82%. The study conducted by Stauber et al. indicated that the CBT yields consistent results when compared to membrane filtration for E. coli detection (Stauber et al., 2014). This study also demonstrated that the use of the improved Hi-E. coli medium can increase the accuracy of the CBT for detection and
quantification of E. coli by 20.3-33.8%.
Based on the limited available literature, the new CBT media should be further tested in the laboratory and in the field. While previous laboratory based experiments on the CBT have been conducted, there is the potential for performance differences between laboratory
31
32
CHAPTER 3: LABORATORY EVALUATION OF THE COMPARTMENT BAG TEST
3.1 Introduction
The Joint Monitoring Programme of the UN relies greatly on household surveys to determine the safety of the drinking water supply present in the home. Due to the unavailability of simple, convenient, and affordable methods to test water in the field, a classification system for improved and unimproved drinking water sources is used as a proxy to identify safe and unsafe household water in lieu of physically testing microbial water quality (WHO/UNICEF, 2012). A novel water quality field test was developed by the investigators of this study to
overcome the obstacles of microbial water quality testing in low resource settings. The method is called the Compartment Bag Test (CBT) and the test quantifies Escherichia coli in 100-mL drinking water samples. The CBT has the potential to overcome the barriers to microbial water quality testing in low resource settings because it is portable, simple to perform with few steps, can be visually scored, requires no cold chain, supporting equipment, or specialized materials, and can be performed on-site (McMahan et al, 2009; 2011; Bain et al., 2012a; Stauber et al, 2014).
33
lauryl tryptose broth with added X-Gluc. Once the medium reagent is dissolved, the sample is transferred to a sterile CBT. The sample is then distributed among the five compartments to their fill lines by tilting the bag from side to side while manually adjusting the compartment volumes by squeezing the bag exterior. An external 2-piece spring plastic clip is placed across the bag above the liquid levels in the compartments but below the tops of the compartments to isolate the compartments from each other. The sealed bag is then incubated at 27°C-44.5°C for 18-24 hours, or up to 48 hours when temperatures are below 30 oC, and the compartments that show bacterial growth and any trace of blue or blue-green color from the hydrolysis product of the X-Gluc are considered to be positive for E. coli growth. Ambient incubation temperatures for E. coli growth are possible and their effective performance has been demonstrated for several different fecal indicator bacteria tests in a previous study (Brown et al., 2011). The combination of positive and negative compartments and their volumes are scored and then expressed as a Most Probable Number (MPN) estimate of the E. coli concentration per 100 mL of water based on a table developed for and provided with the test.
The purpose of this research is to evaluate the performance of an updated version of the CBT for detecting and quantifying E. coli in samples of potential drinking water sources using an improved culture medium (Hi-E. coli test bud, HiMedia Labs, Mumbai, India). Field samples of ambient water were analyzed in the laboratory to further characterize the performance of the test with the new chromogenic medium for improved detection and quantification of E. coli
34
culture purified and then speciated to determine if the CBT method accurately detected E. coli. Speciation was determined by biochemical analysis using the EnteroPluri system (Becton, Dickinson and Company, USA), and by molecular analysis using qPCR for the uidA gene (Biogx, Inc, USA), as well as matrix-assisted laser desorption/ionization - time of flight mass spectrometry (MALDI-TOF MS) analysis (bioMérieux, Inc , France) (Bej et al, 1991; Holland et al, 1999).
3.2 Methods
Surface waters (with turbidity between 3-8 NTU) from Morgan Creek in Chapel Hill, North Carolina were analyzed by the CBT using the CBT Hi-E. coli chromogenic medium and Colilert E. coli fluorogenic medium with incubation at three different temperatures: 27ºC, 37ºC, and 44.5ºC. Both media detect E. coli based on hydrolysis of a β-D-glucuronide substrate to yield a visibly detectable hydrolysis product. Five separate experiments with varied sample water dilutions were conducted that produced 600 media comparison samples, half conducted with Hi-E. coli medium and half with Colilert medium.
35
made at the1:10 dilution. For each test group and within each dilution level, the incubation temperatures of the water samples were evenly divided between 27° C, 37° C, and 44° C, so that each incubation temperature-sample dilution combination for the 1:10 dilution had a sample size of 40 and the 1:2 dilution had a sample size of 100. Table 3.2 presents how samples were split between the temperature and dilution levels for the CBT test group, and the Colilert test samples were divided in the same way.
Table 3.1 Numbers of water samples tested with the CBT at each incubation temperature for each dilution level in either Colilert medium or CBT Hi-E. coli medium
Incubation Temperature
Sample Dilution 27° C 37° C 44° C Total
1:10 40 40 40 120
1:2 60 60 60 180
Total 100 100 100 300
Bacteriological medium, either CBT Hi-E. coli or Colilert, was added to a 100 mL water sample per manufacturer’s instruction and swirled to fully dissolve. Once the medium was dissolved, the sample with dissolved medium was poured into a sterile CBT. The sample was then distributed among the 5 compartments to their fill lines by manual adjustment of the compartment volumes. The CBT was then sealed with an external 2-piece spring plastic clip across the bag above the liquid levels in the compartments but below the tops of the
36
compartments and their volumes were used find the MPN estimate of the E. coli concentration per 100 mL of water based on a table of previously calculated MPN values for all combinations of positive and negative compartment volumes in the CBT.
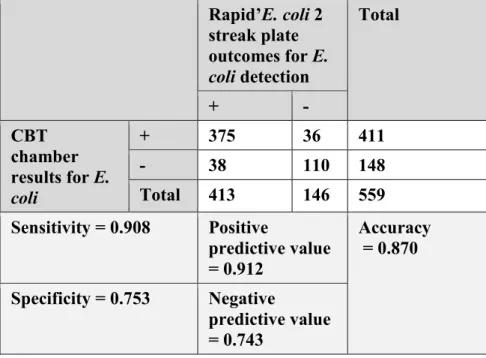
Of the 300 samples analyzed using Hi-E. coli medium, a total of 559 bacteria were isolated and purified from positive and negative chambers by using sterile wooden sticks for culture purification via the steps in Table 3.1 below. Purified bacteria isolates were stored as frozen cultures. They were later thawed, re-plated, and re-grown before biochemical and molecular analysis by streak plating on non-selective tryptic soy agar (TSA) plates with
incubation at 44.5°C for 18-24 hours to obtain isolated colonies. The biochemical assay involved picking material from an isolated colony with the self-contained inoculating wire of the
EnteroPlurri test. The molecular analysis was done by two methods: qPCR targeting the uidA gene for glucuronidase activity, and matrix-assisted laser desorption/ionization - time of flight mass spectrometry (MALDI-TOF MS) analysis.
Table 3.2 Summary of triple-streak procedure for isolating and culturing E. coli and re-growing frozen cultures for further biochemical and molecular assays for speciation
Procedure Medium Comments
1st streak Rapid’E. coli Bio-Rad 2 agar
Streaked liquid from a compartment in each CBT onto Bio-Rad Rapid’E. coli 2 agar plate (1
plate/CBT) 2nd streak Rapid’E. coli Bio-Rad
2 agar
Chose isolated colony from first Bio-Rad Rapid’E. coli 2 agar plate and re-streaked onto second Bio-Rad Rapid’E. coli 2 agar plate, in duplicate (2 plates/CBT)
3rd streak TSA Chose one isolated colony from each Bio-Rad Rapid’E. coli 2 agar plate and re-streaked onto TSA agar plate (2 plates/CBT)
Frozen cultures TSB + 20% glycerol
Chose one isolated colony from each TSA agar plate and added directly to 1 mL liquid TSB
medium in 1.5 mL microcentrifuge tube for freezer storage
37 frozen cultures
for biochemical and molecular
analysis
microcentrifuge tube onto TSA agar for regrowth from frozen culture; isolated colonies picked from TSA plate were used for further assays
The EnteroPlurri test (Liofilchem) involved picking a colony from the regrown frozen culture on the TSA plate with the self-contained inoculating wire and inoculating simultaneously all 12 different conventional media compartments and incubating at 37°C for 24 hours. After inoculation and incubation, the 15 biochemical reactions: glucose, gas production from glucose, lysine decarboxylase, ornithine decarboxylase, H2S, indole, adonitol, lactose, arabinose, sorbitol, Voges-Proskauer, dulcitol, phenylalanine, deaminase, urea and citrate, were be observed in the plastic compartments. The resulting combination of positive reactions as per manufacturer’s instructions, allowed the identification of genus and species within the family of
Enterobacteriaceae using the key provided by the manufacturer.
For qPCR analysis, a colony from the regrown sample on TSA was picked suspended in 500 µl in the nonselective broth, TSB, and grown overnight in a screw cap tube in order to
decrease potential interference of glycerol. From the overnight cultures, 250 µl was centrifuged for 5 minutes (5000 x g), the supernatant was removed with a pipet tip and the pelleted cells retained. In the screw cap tube where the pelleted cells were retained, 100 µl of deionized water
was added. The samples were then heated in a boiling water bath for about two minutes in order to lyse the cells. Then, a crude DNA extraction from the approximately 100 µl volume of boiled
38
codes for the enzyme β-glucuronidase, which is responsible for hydrolysis of β -D-glucuronide substrates, such as X-gluc and 4-methyl-umbelliferyl-4-β-D-glucuronide (MUG). Primer and probe sequences are proprietary. A qPCR master mix of lyophilized beads containing the E. coli-specific primer and probe set, Omnimix lyophilized beads, and 20 µL reagent grade dilution water were combined with 5 µL of sample and analyzed via the Cepheid Smart Cycler II system: with a thermal cycling regimen of 120 seconds at 95o C, followed by 45 cycles of 5 seconds at 95o C, followed by 43 seconds at 62o C (Noble et al., 2010; Krometis et al., 2011). In order to determine potential qPCR amplification inhibition, SKETA (a salmon sperm DNA target) was also run with about half the samples tested (Biogx, Inc, USA). If a cycle-fluorescence curve came up, the sample was scored as E. coli positive; if no cycle-fluorescence curve came up, the sample was scored as E. coli negative.
The MALDI-TOF MS method is a soft ionization process and analysis allows for biomolecules, such as DNA and proteins, to be ionized and analyzed (Patel, 2013). A colony from the regrown samples was picked with a sterile toothpick, smeared on a MALDI-TOF MS plate, with a matrix of different samples applied (bioMérieux VITEK MS with version 2.0 Knowledge Base database, bioMerieux, Durham NC). The inoculated plate was irradiated by a laser pulse and allowed for biomolecules to be ionized and desorbed. The sample ions are accelerated in an electric field and enter a flight tube where they are separated based on their differing masses and relative abundance. The mass to charge ratio is measured and a generated
spectrum (often referred to as a fingerprint) is compared to a library. MALDI-TOF MS can
determine the genus, and often species, by bioinformatics software included with the analytical system in under an hour of analysis time (Croxatto et al, 2011). There was no need to specify the
39
from a large population of clinically relevant bacteria from the MALDI-TOF MS results. It is often difficult to differentiate Shigella species and E. coli due to similar properties via
MALDI-TOF MS (Ochman et al., 1933). However, this was not an issue in this study because E. coli was selected for in samples based on their detection and isolation by β -D-glucuronidase activity using chromogenic culture and isolation media; Shigella species are negative for this activity.
In order to evaluate the laboratory performance of the CBT when applied to field samples of ambient surface water, the results from the MPN estimates of CBT with Hi-E. coli and
Colilert media for different incubation temperatures, as well as the biochemical and molecular speciation results, were compared and statistically analyzed in SPSS (IBM Corp. Released 2013. IBM SPSS Statistics for Windows, Version 22.0. Armonk, NY: IBM Corp) and R (R Foundation for Statistical Computing, Vienna, Austria. ISBN 3-900051-07-0, URL
http://www.R-project.org/). A Chi-Square test was conducted to observe the association between the MPN results of the CBT with its chromogenic medium and the CBT with a standard fluorogenic medium, Colilert, in categories of positivity versus negativity and on the basis of the WHO decimal risk levels for E. coli concentrations per 100 mL in the ranges of <0, 1-10, 10-99, and >100 (WHO, 2011).
40
on log10(MPN) of that level when compared to a reference level chosen to be the smallest value of the categorical variable. For example, the coefficient on CBT versus Colilert tells us the effect on log10(MPN) of using CBT to measure E. coli concentration versus using the Colilert media. In this example, Colilert is the reference level of the categorical variable test type. When coefficients are not statistically significant, we consider them to be no different from 0 so that there is no effect on log10(MPN) of the level under consideration versus the reference level of a given categorical variable.
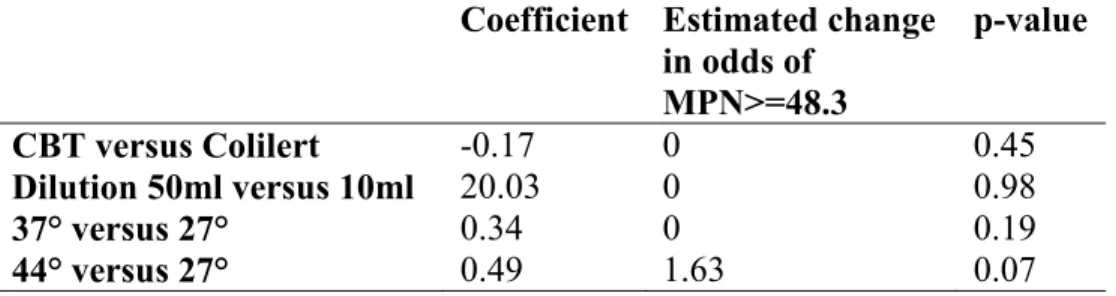
Similar to the ANOVA regression, logistic regression, which measures the effect of the independent variables on the dependent variable, were also be performed. Three logistic regressions were performed using less than or greater than or equal to 100.0 MPN, less than or greater than or equal to 48.3 MPN, as well as less than or greater than or equal to 1.5 MPN. These three sets of MPN categories are of interest to the study for being at and above the detection limit of the test (left censored versus right censored) as they represent some of the smallest and largest MPN values in the dataset that correspond to very safe and unsafe drinking water, respectively (WHO, 2011). The MPN greater or equal to 48.3 was chosen as a cutoff of interest to the study since it represents the MPN value in the dataset that corresponds to unsafe drinking water and the upper detection limit of the CBT (WHO, 2011; McMahan et al., 2011; Stauber et al., 2014). Because in the logistic case the response is a dummy variable, the
coefficients are interpreted as the multiplicative effect on the log odds of having an MPN greater than or equal to the three MPN categories mentioned for a unit change in the explanatory